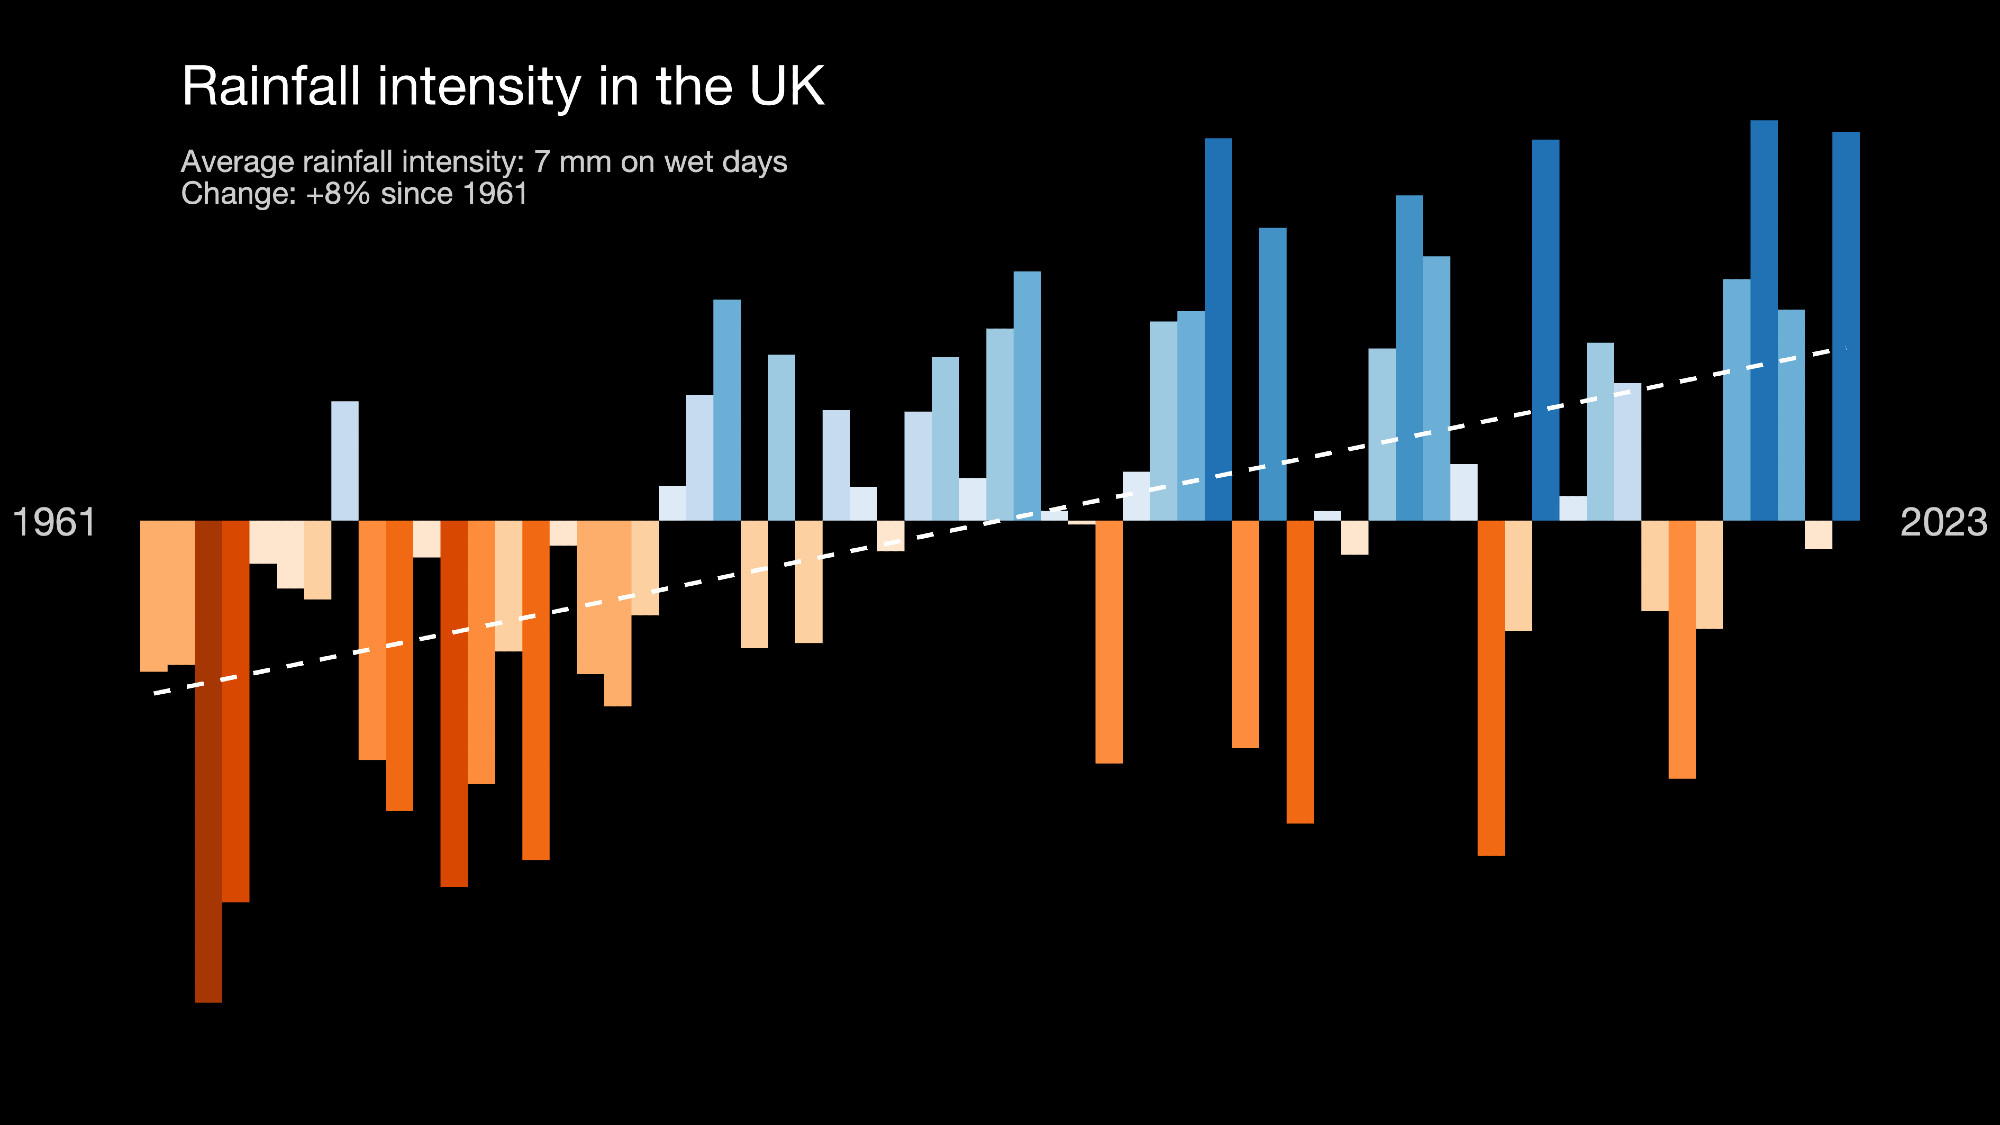
Most of the UK has seen an increase in intensity of rainfall over past 60 years. When it rains, it rains more, especially in autumn and winter.
This metric is a fairly standard one defined as the average rainfall that falls at each location on days with more than 1mm (a wet day). So it’s a sum of rainfall on all wet days divided by number of wet days. Then averaged across the UK.
There are definitely some typeset records that even I can get ML to read pretty well, but the messy handwritten stuff needs more serious expertise and £.
Great that the tides data is still coming!
The daily rainfall project is about 20x bigger than Rainfall Rescue, which we ran during lockdown, and which broke Zooniverse records for volume of transcriptions. There may well be a role for volunteers to check the really difficult sheets but the majority of the effort needs to be automated.
No, but we would know the tendency of how extreme rainfall is changing a lot more accurately. Which will help those planning for how bad it might get.
One day, a company with significant ML expertise will see these paper records and think… hmmm… maybe solving the problem of turning 350,000 images into invaluable digital data which inform us on how climate change is affecting intense rainfall is an important public good that we could contribute to.
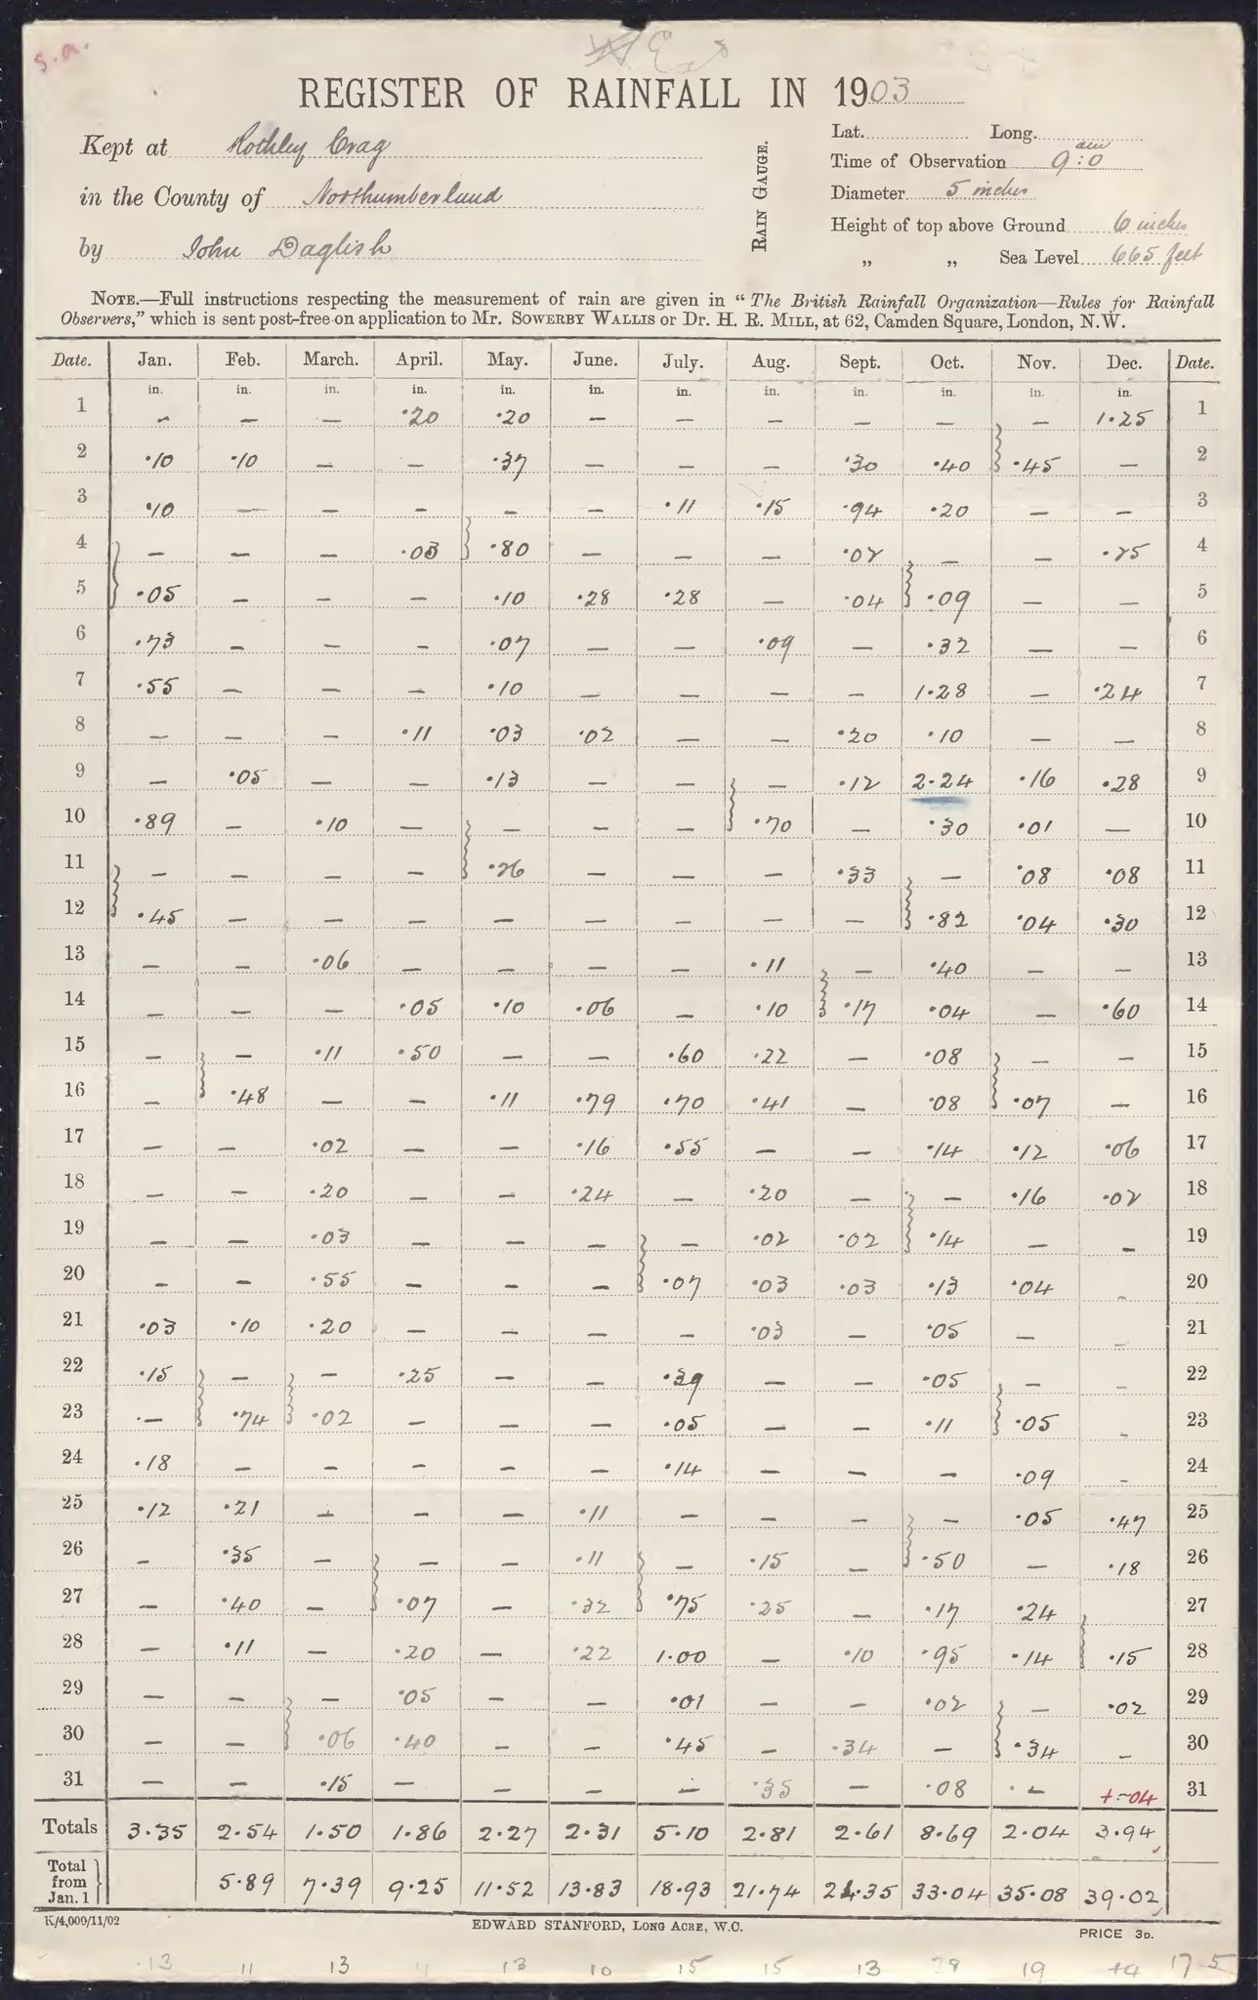
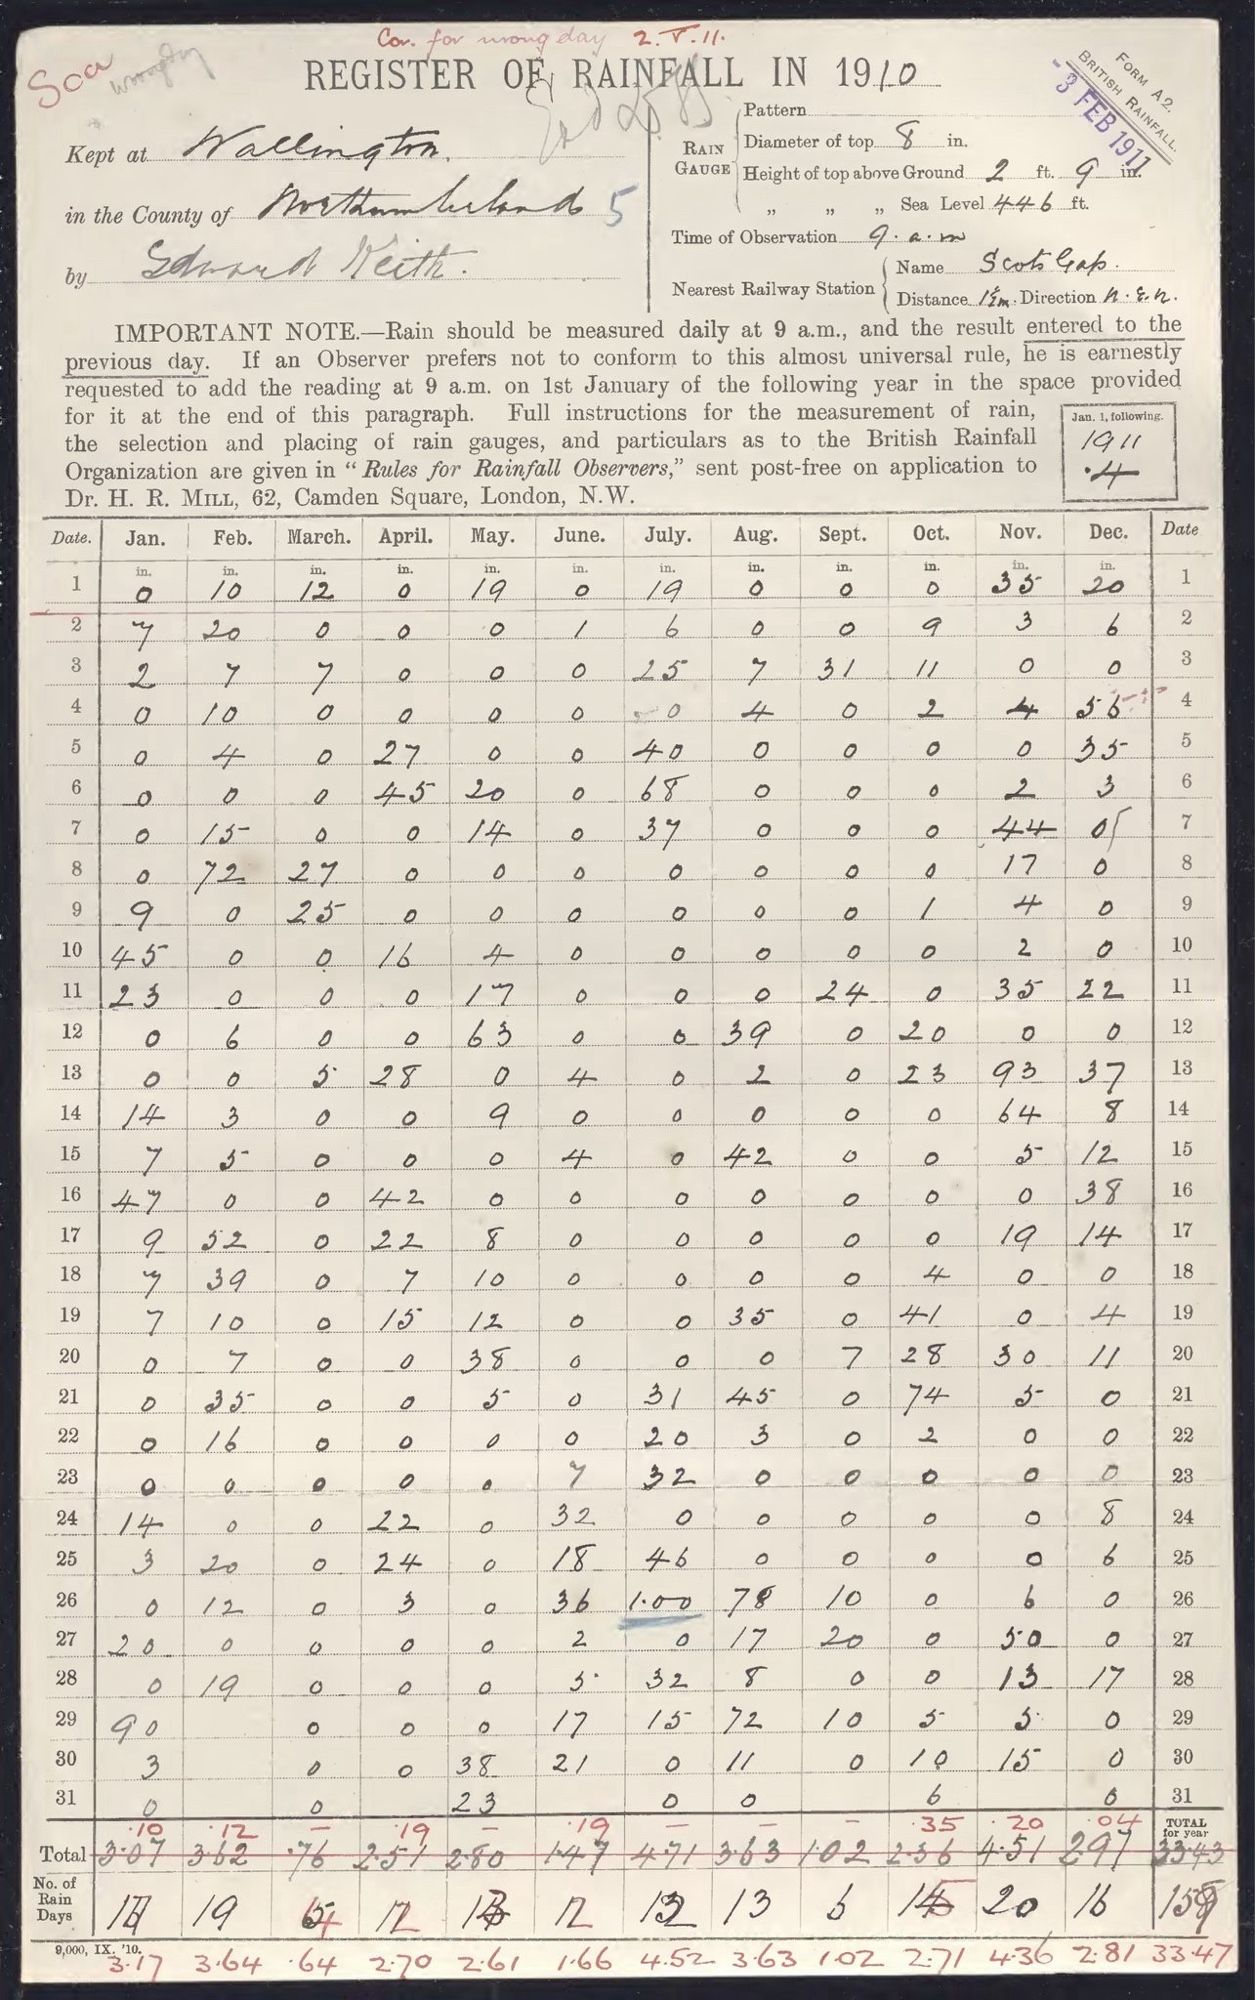
Wondering what UK rainfall intensity was before 1961? The data available shows an increase in rainfall intensity since 1891, but… The vast majority of the daily rainfall observations taken before 1961 are STILL ON PAPER. 100 million measurements. Undigitised. Though they have now been scanned.
This figure uses the UK Met Office gridded daily rainfall dataset. KMI might have something similar?
Today it is the UK's turn to experience serious flooding due to intense rainfall. A reminder that UK rainfall intensity has increased markedly over the past 60+ years. All consistent with the physics of a warming atmosphere which is now more humid.