
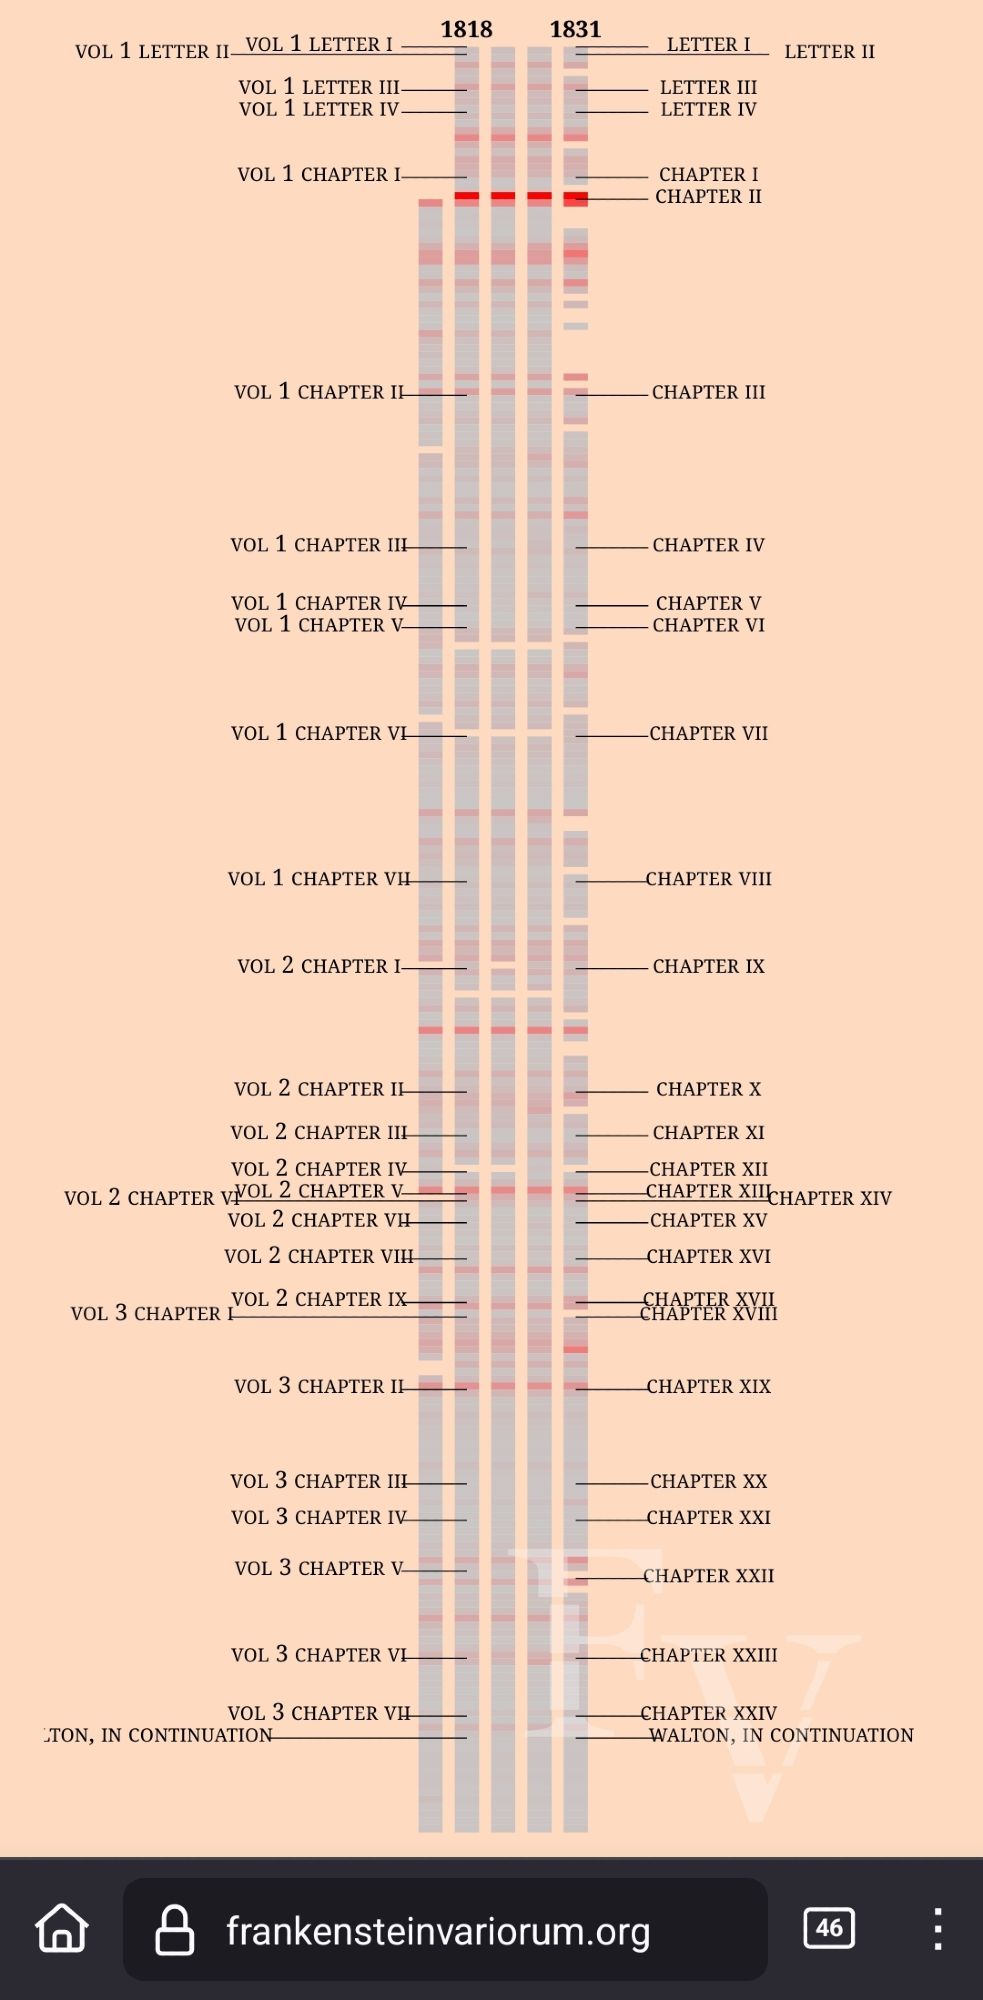
Hey, I forgot to promote this eight-years-to-complete project by @epyllia.bsky.social@raffazizzi.bsky.socialfrankensteinvariorum.org) lets you read and compare its five earliest editions.
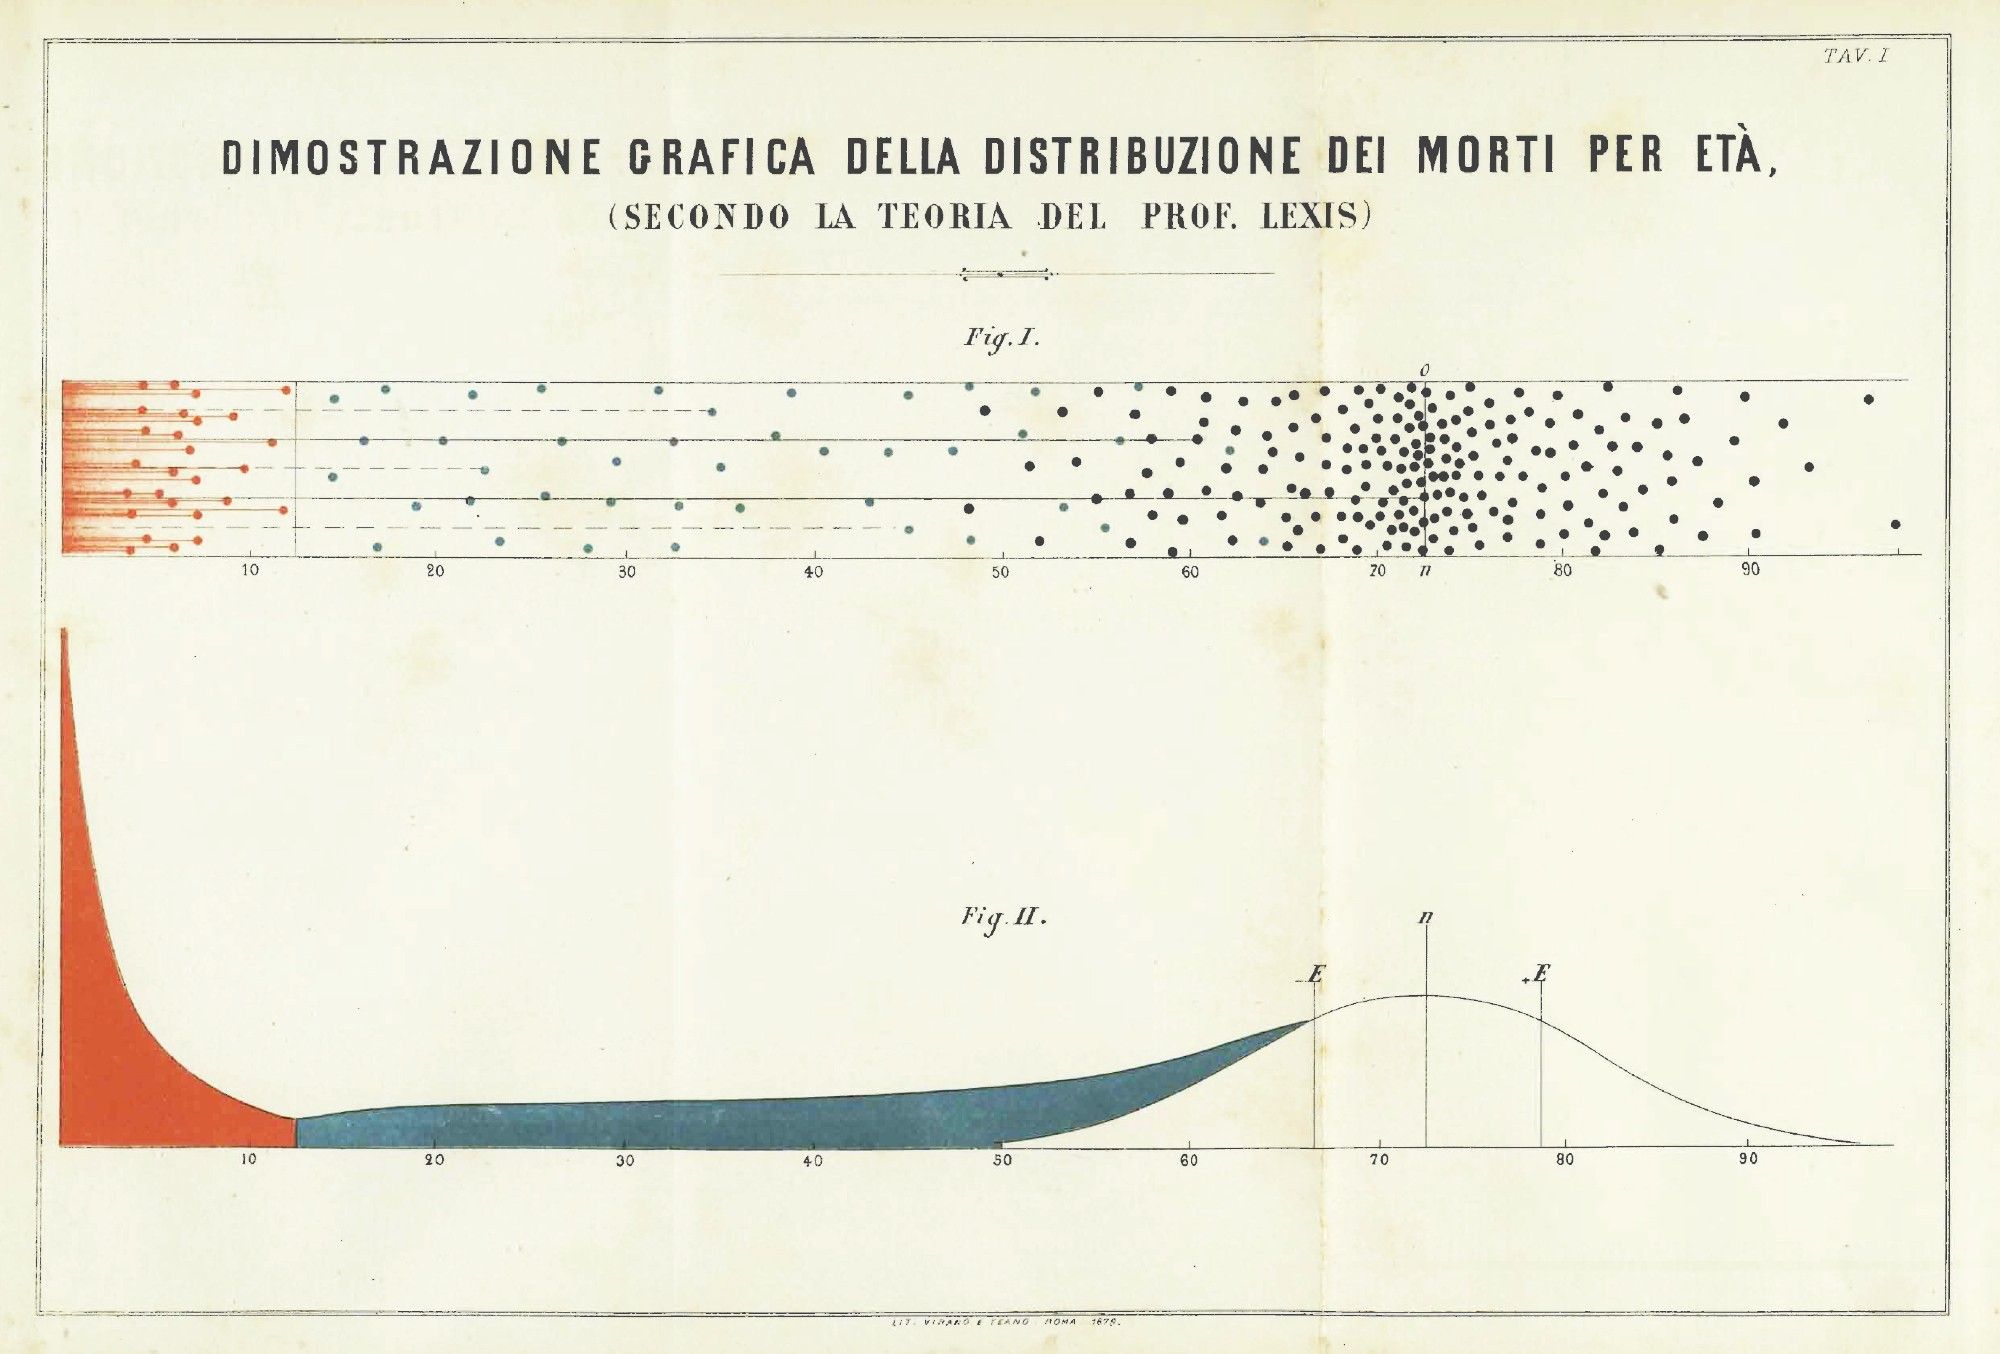
GRAPHICAL DEMONSTRATION OF THE DISTRIBUTION OF DEATHS BY AGE ACCORDING TO THE THEORY OF PROF. LEXIS—Annali di Statistica, 1879 (Stumbled into this flipping pages late last night—I'd never seen this before. How spectacular!)
"Singular value decomposition" (SVD) is the most useful linear algebra technique I know. But it's often not taught in classes! Here's a visual demo for the 2D case, which gives you all the intuition you need for higher dimensions: www.bewitched.com/demo/svd/
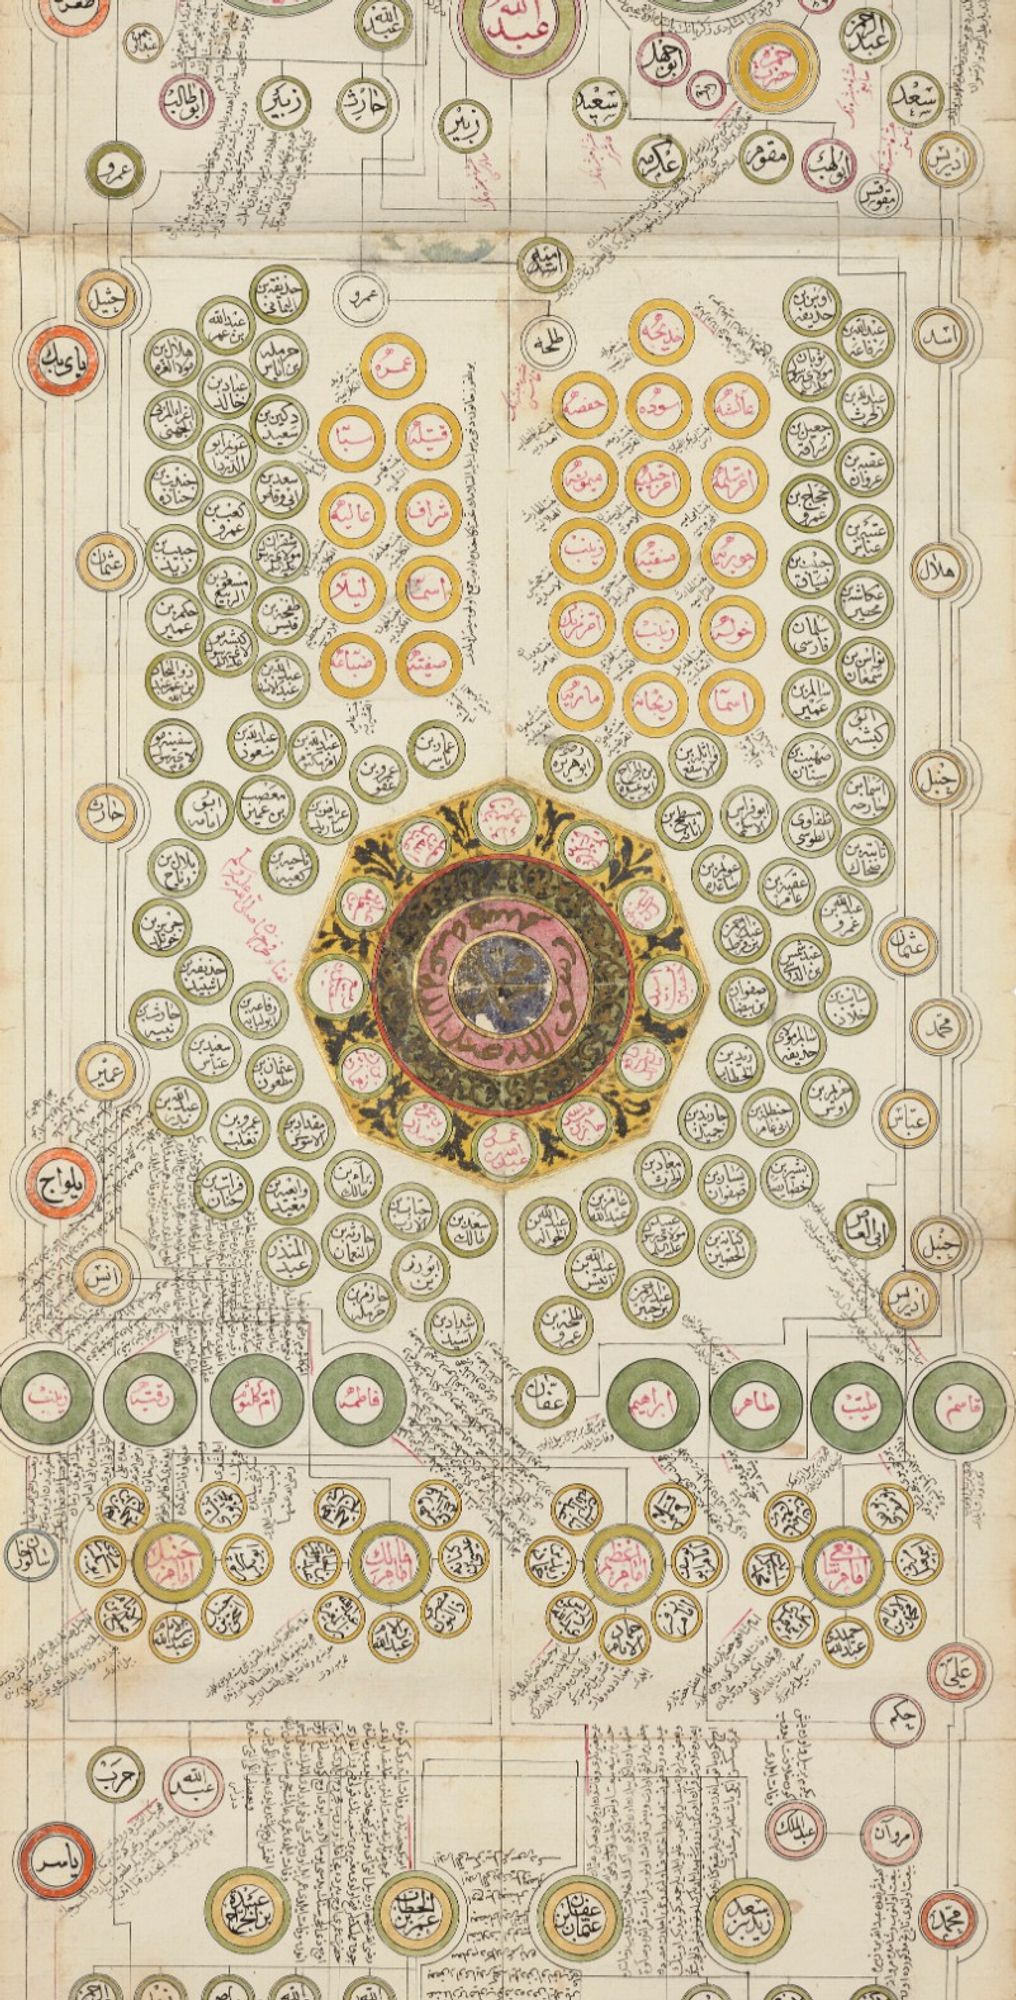
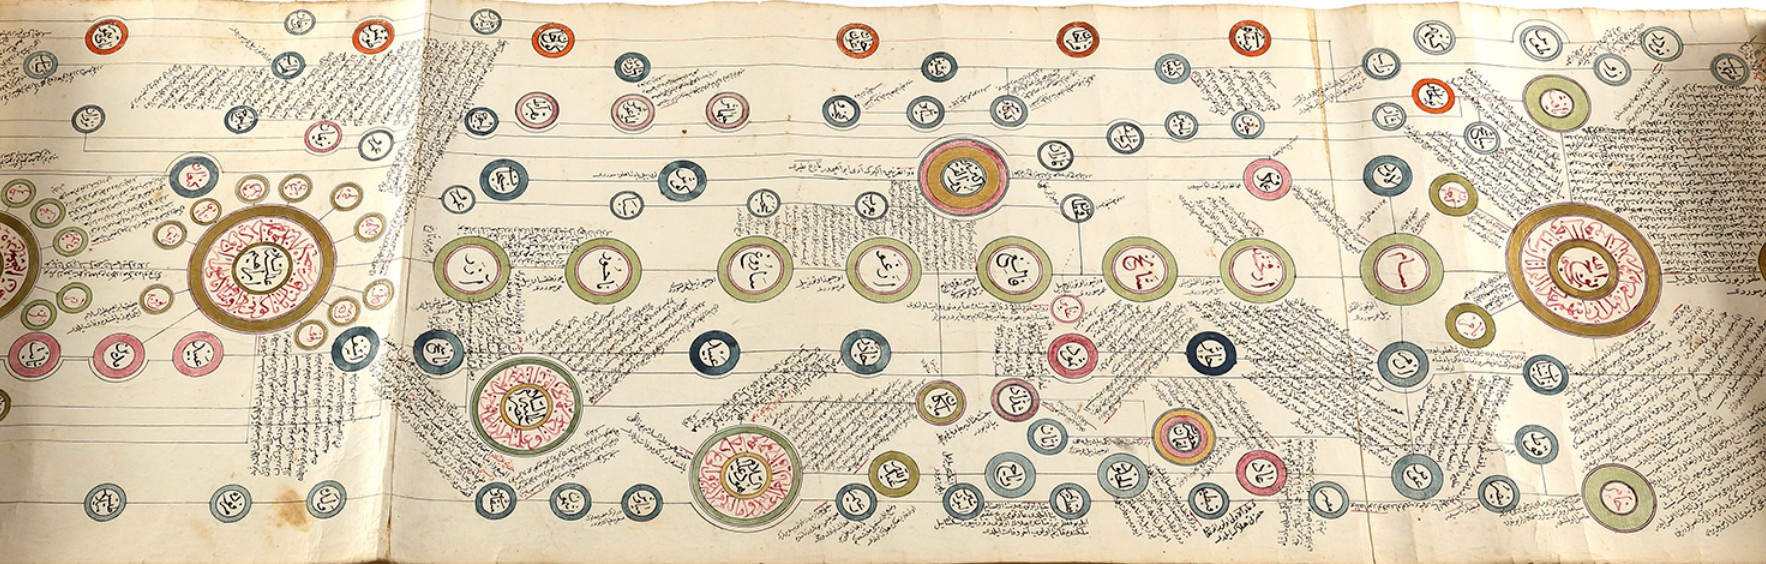
I've received a conference paper on Turkish diagrammatic fihrists (table of content) and I've ended up in the world of silsilenames, ie Ottoman genealogies. Mindblowing. @dencemond.bsky.social
That's amazing, I had no idea. Seems like good context to have, it changes the way I look at the book.
To put it another way: the chief virtue of good code is that it's predictable. So it's not a shock that a next-token predictor excels at coding.
My experience is that code from the best programmers in the world often seems completely standard and dull. It's easy to read and maintain. Meanwhile, beginner code is weird, creative, and baroque. Finding the right cliche requires human talent and long experience. But it comes naturally for LLMs!
I have no idea who she is
I love these plays; for me it's like having a postcard of a place I visited. But there's serious scholarship on speech networks too (e.g. Tara Menon). The idea of visualizing speech isn't original to me—this was just an experiment to see how much ChatGPT could help create a nontrivial visualization.
For instance, there's also a force-directed layout option, which I added by saying only this: "I'd also like a checkbox for "force-directed" which will give me a force-directed layout for each graph, rather than a circle layout."