Now published! We identify the key risks to World Cultural Heritage Sites under shared socioeconomic pathway (SSP) scenarios from the Coupled Model Intercomparison Project (CMIP6), the most up-to-date global climate model available. Open Access: www.sciencedirect.com/science/arti...
Rapidly advancing anthropogenic climate change is a severe threat to cultural heritage worldwide. World cultural heritage sites (WCHS) are recognized …
Pre-proof out led now by my student Haisheng Hu. In depth data-led analysis of the future impacts of climate change on World Cultural Heritage Sites under CMIP6 model shared socioeconomic pathways. Congratulations Hu! www.sciencedirect.com/science/arti...
Rapidly advancing anthropogenic climate change is a severe threat to cultural heritage worldwide. World cultural heritage sites (WCHS) are recognized …
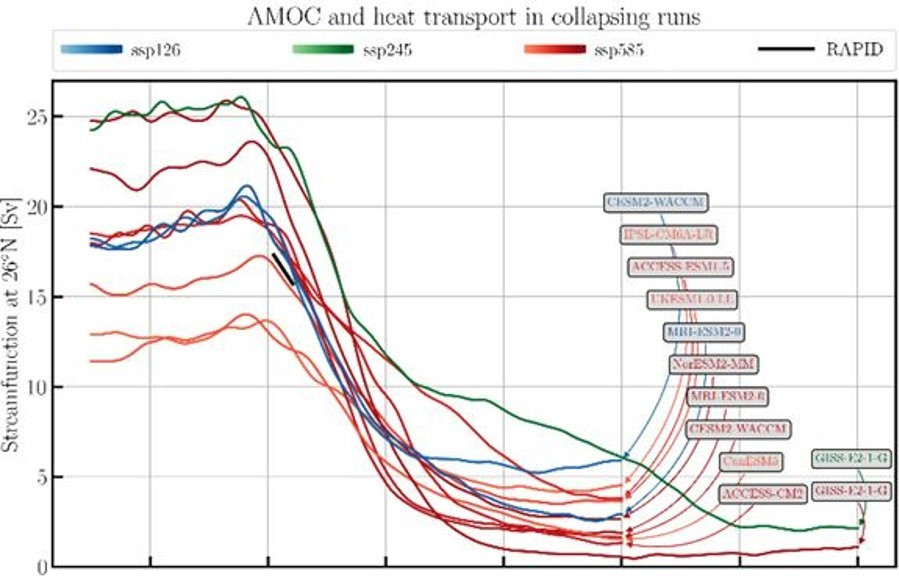
The AMOC in 9 CMIP6 models under the fossil-fueled development scenario (SSP-585) eventually collapses after 2100 according to an under-review study 🌊🧪 www.researchsquare.com/article/rs-5...
New paper, led by Yingfei Fang during her visit to the University of Exeter: ENSO teleconnections to the South Pacific are underestimated in CMIP6 models, and are generally too far west although the position improves with increased ocean resolution. agupubs.onlinelibrary.wiley.com/doi/10.1029/...
Highlights: (1) While observed trends are never _outside_ the full range of CMIP6 model runs, multidecadal decreases in rainfall, like we saw in the 1980s-2000s, are systematically too rare in CMIP6 models compared to observations, just like they were in CMIP5 models.
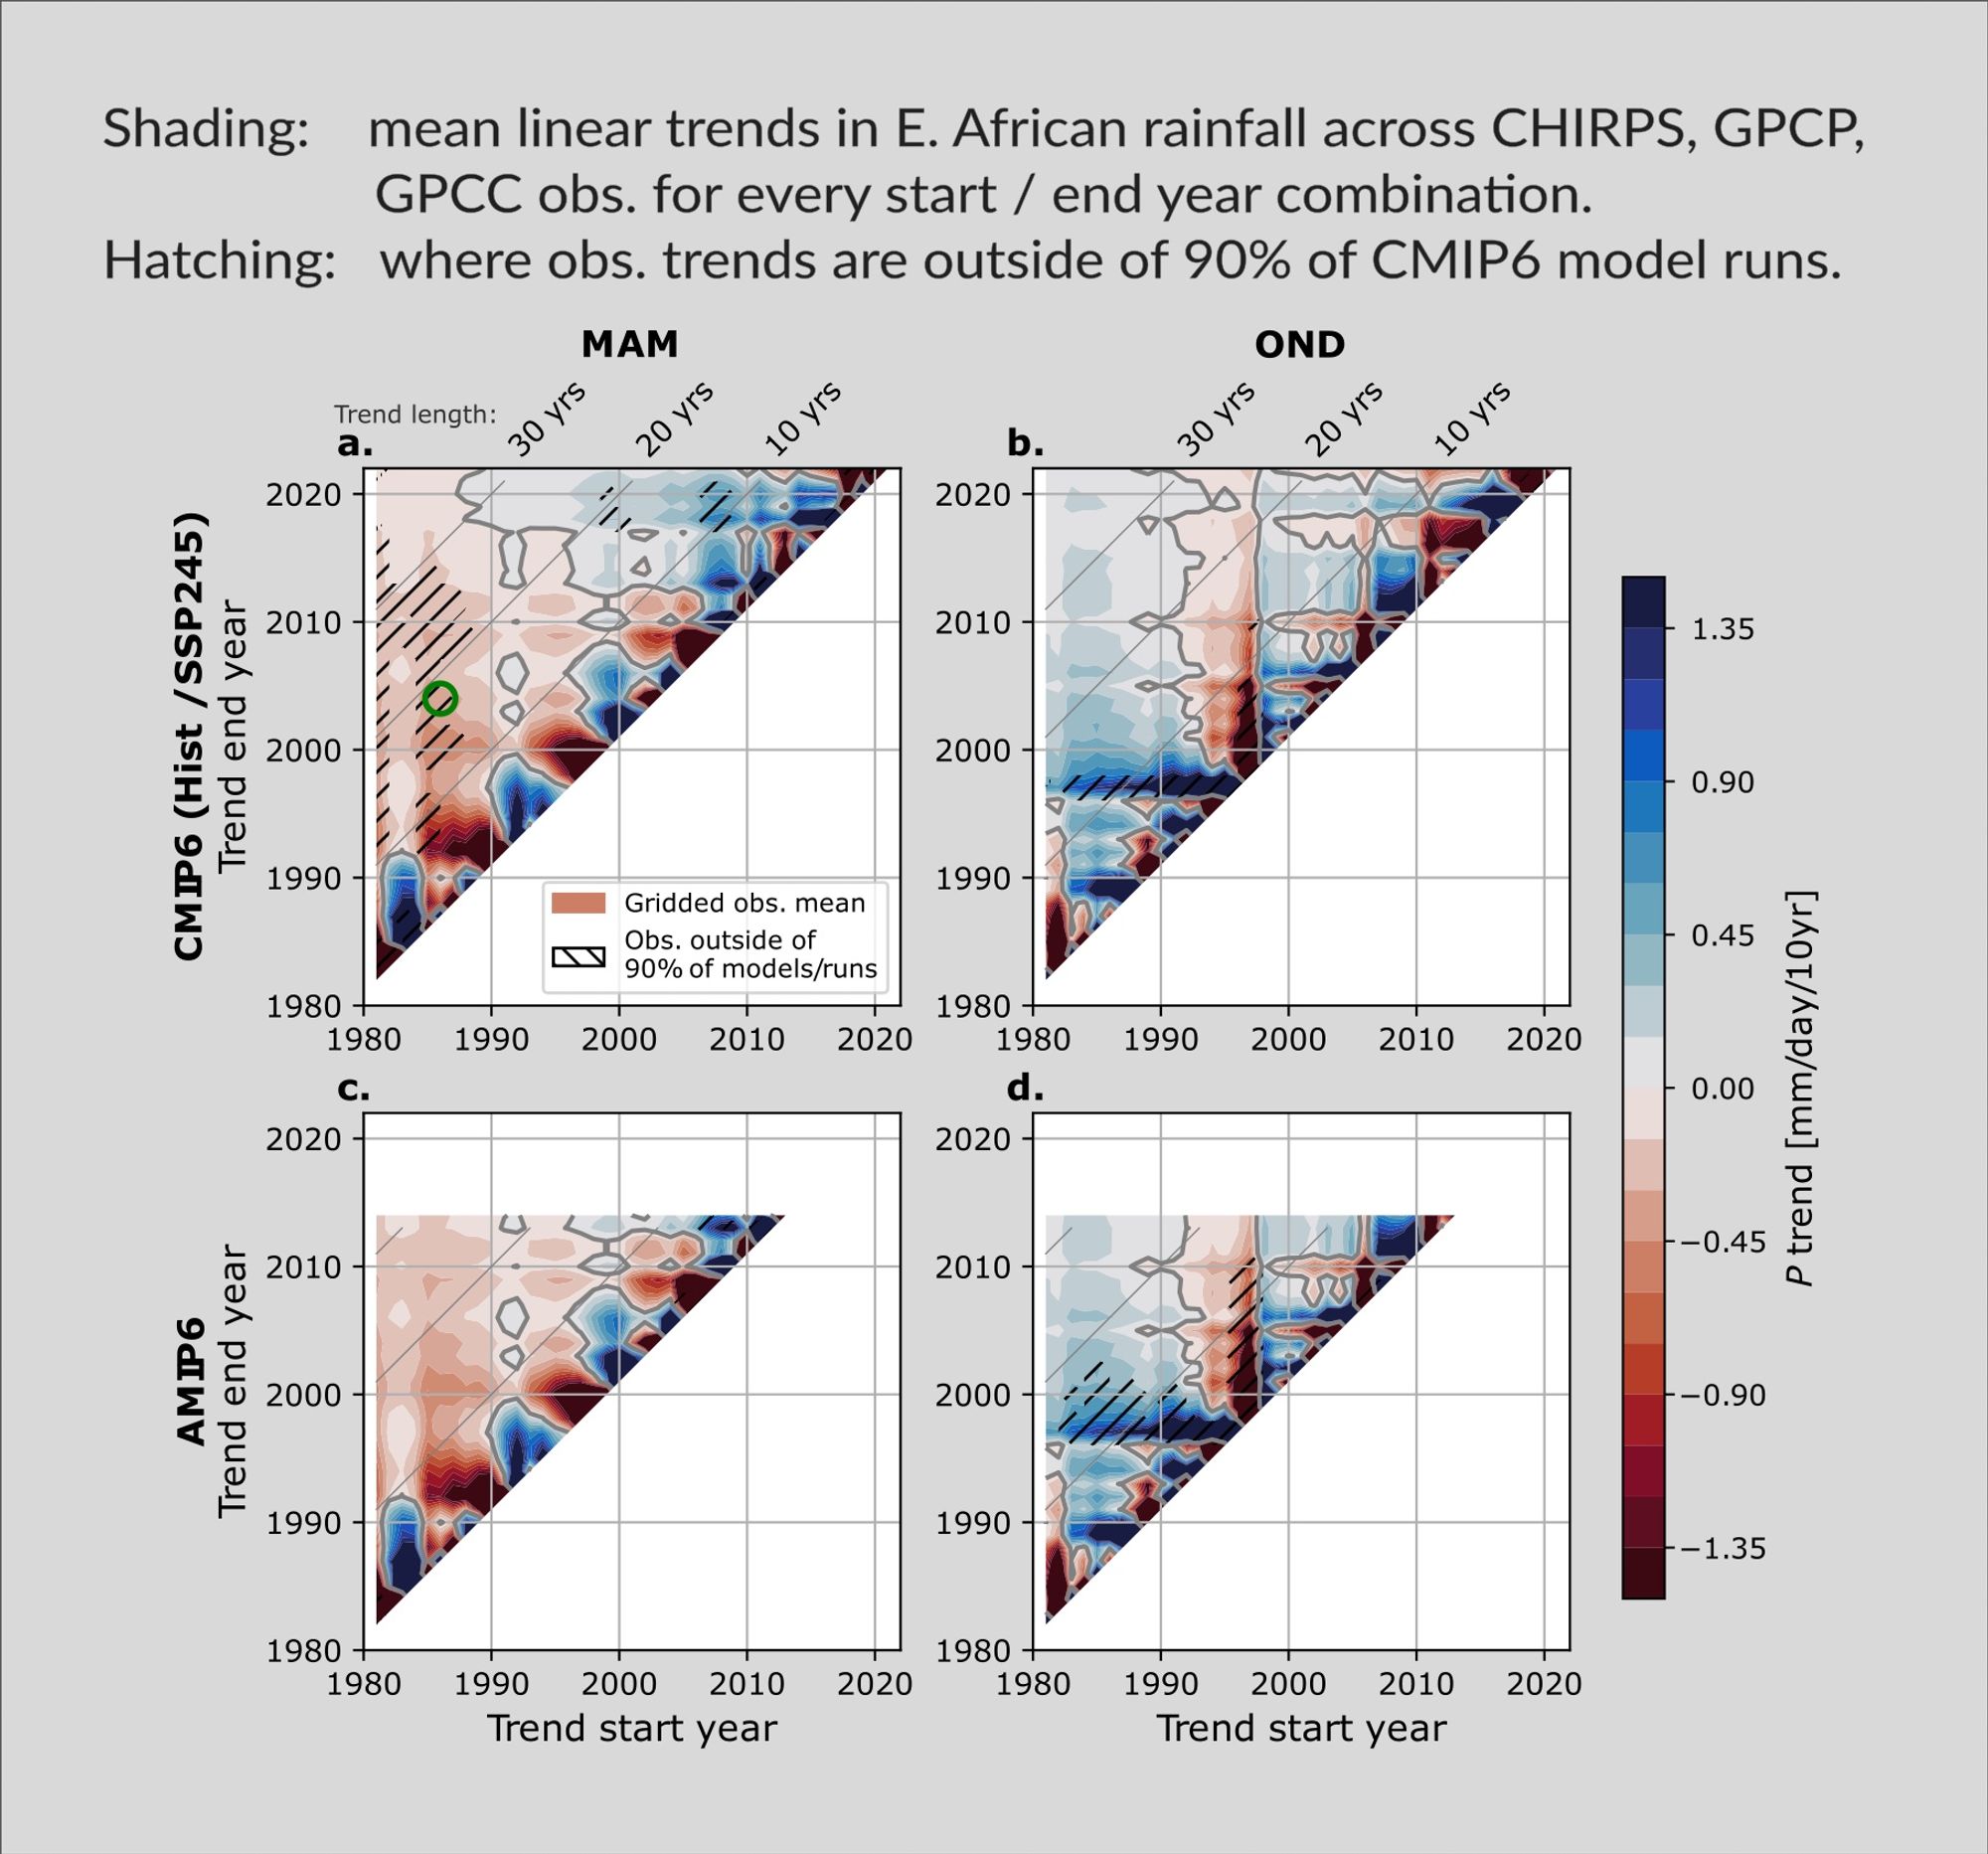
Since the first papers on the Paradox, we have new GCMs (CMIP6) with Large Ensembles that better sample internal variability, another decade of obs, and a much better understanding of model biases in the region and beyond. So, it’s high time to update our understanding!
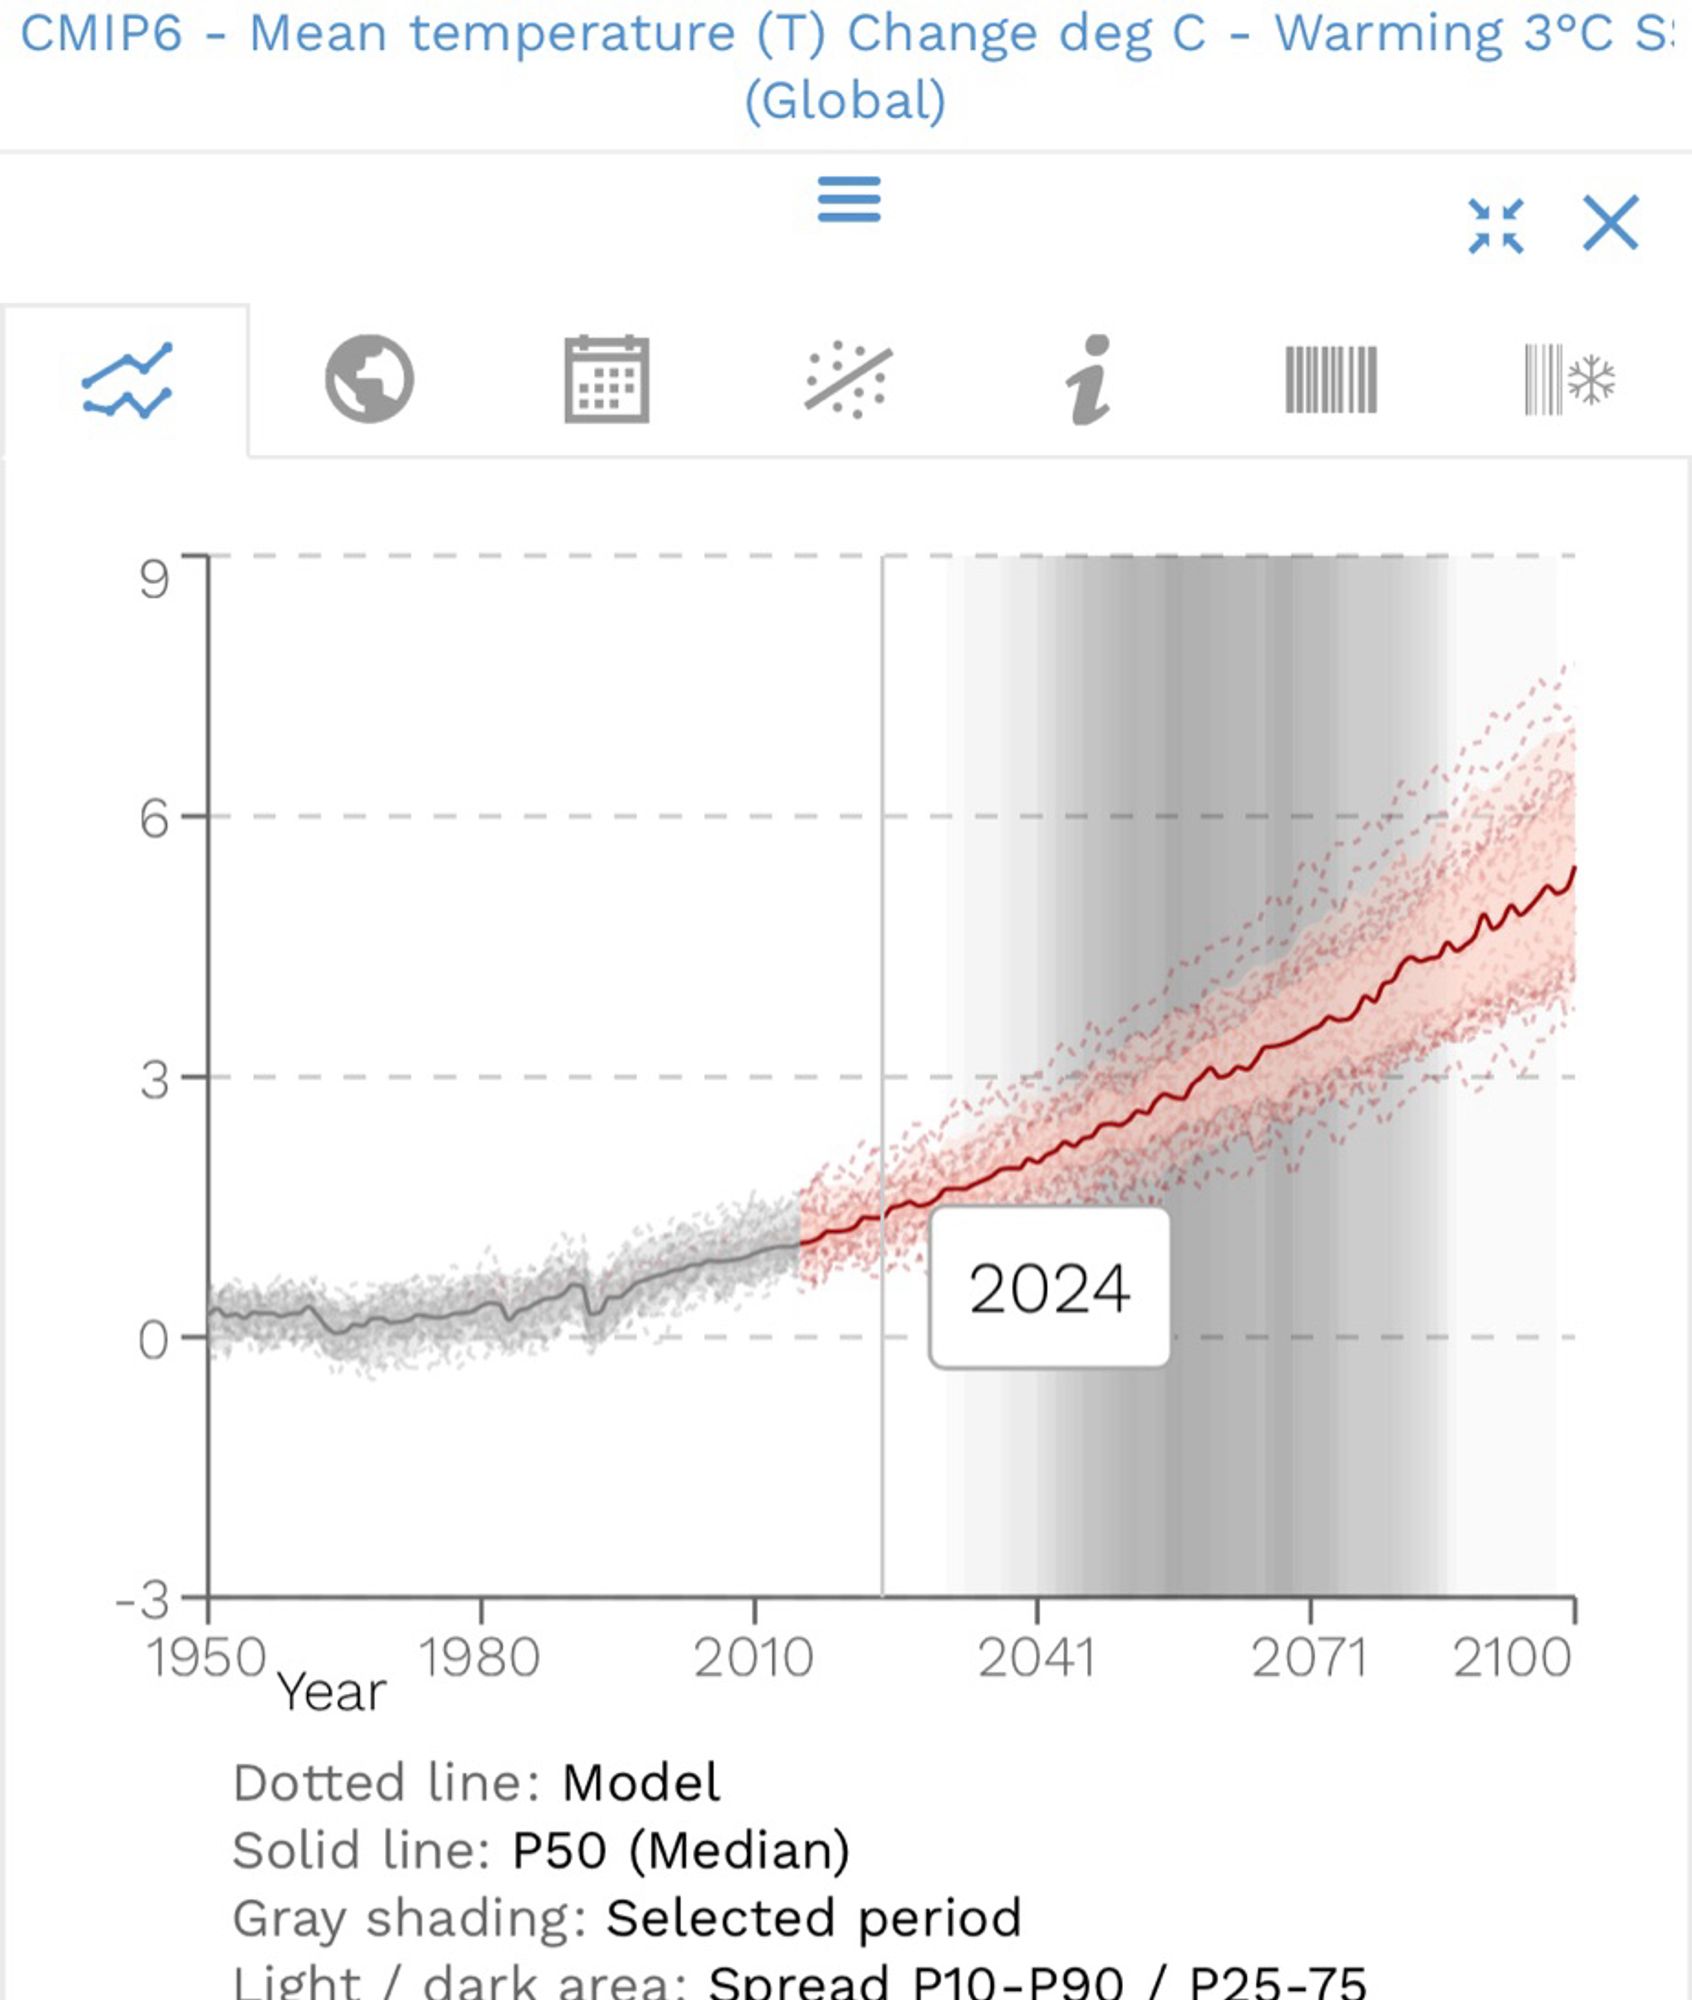
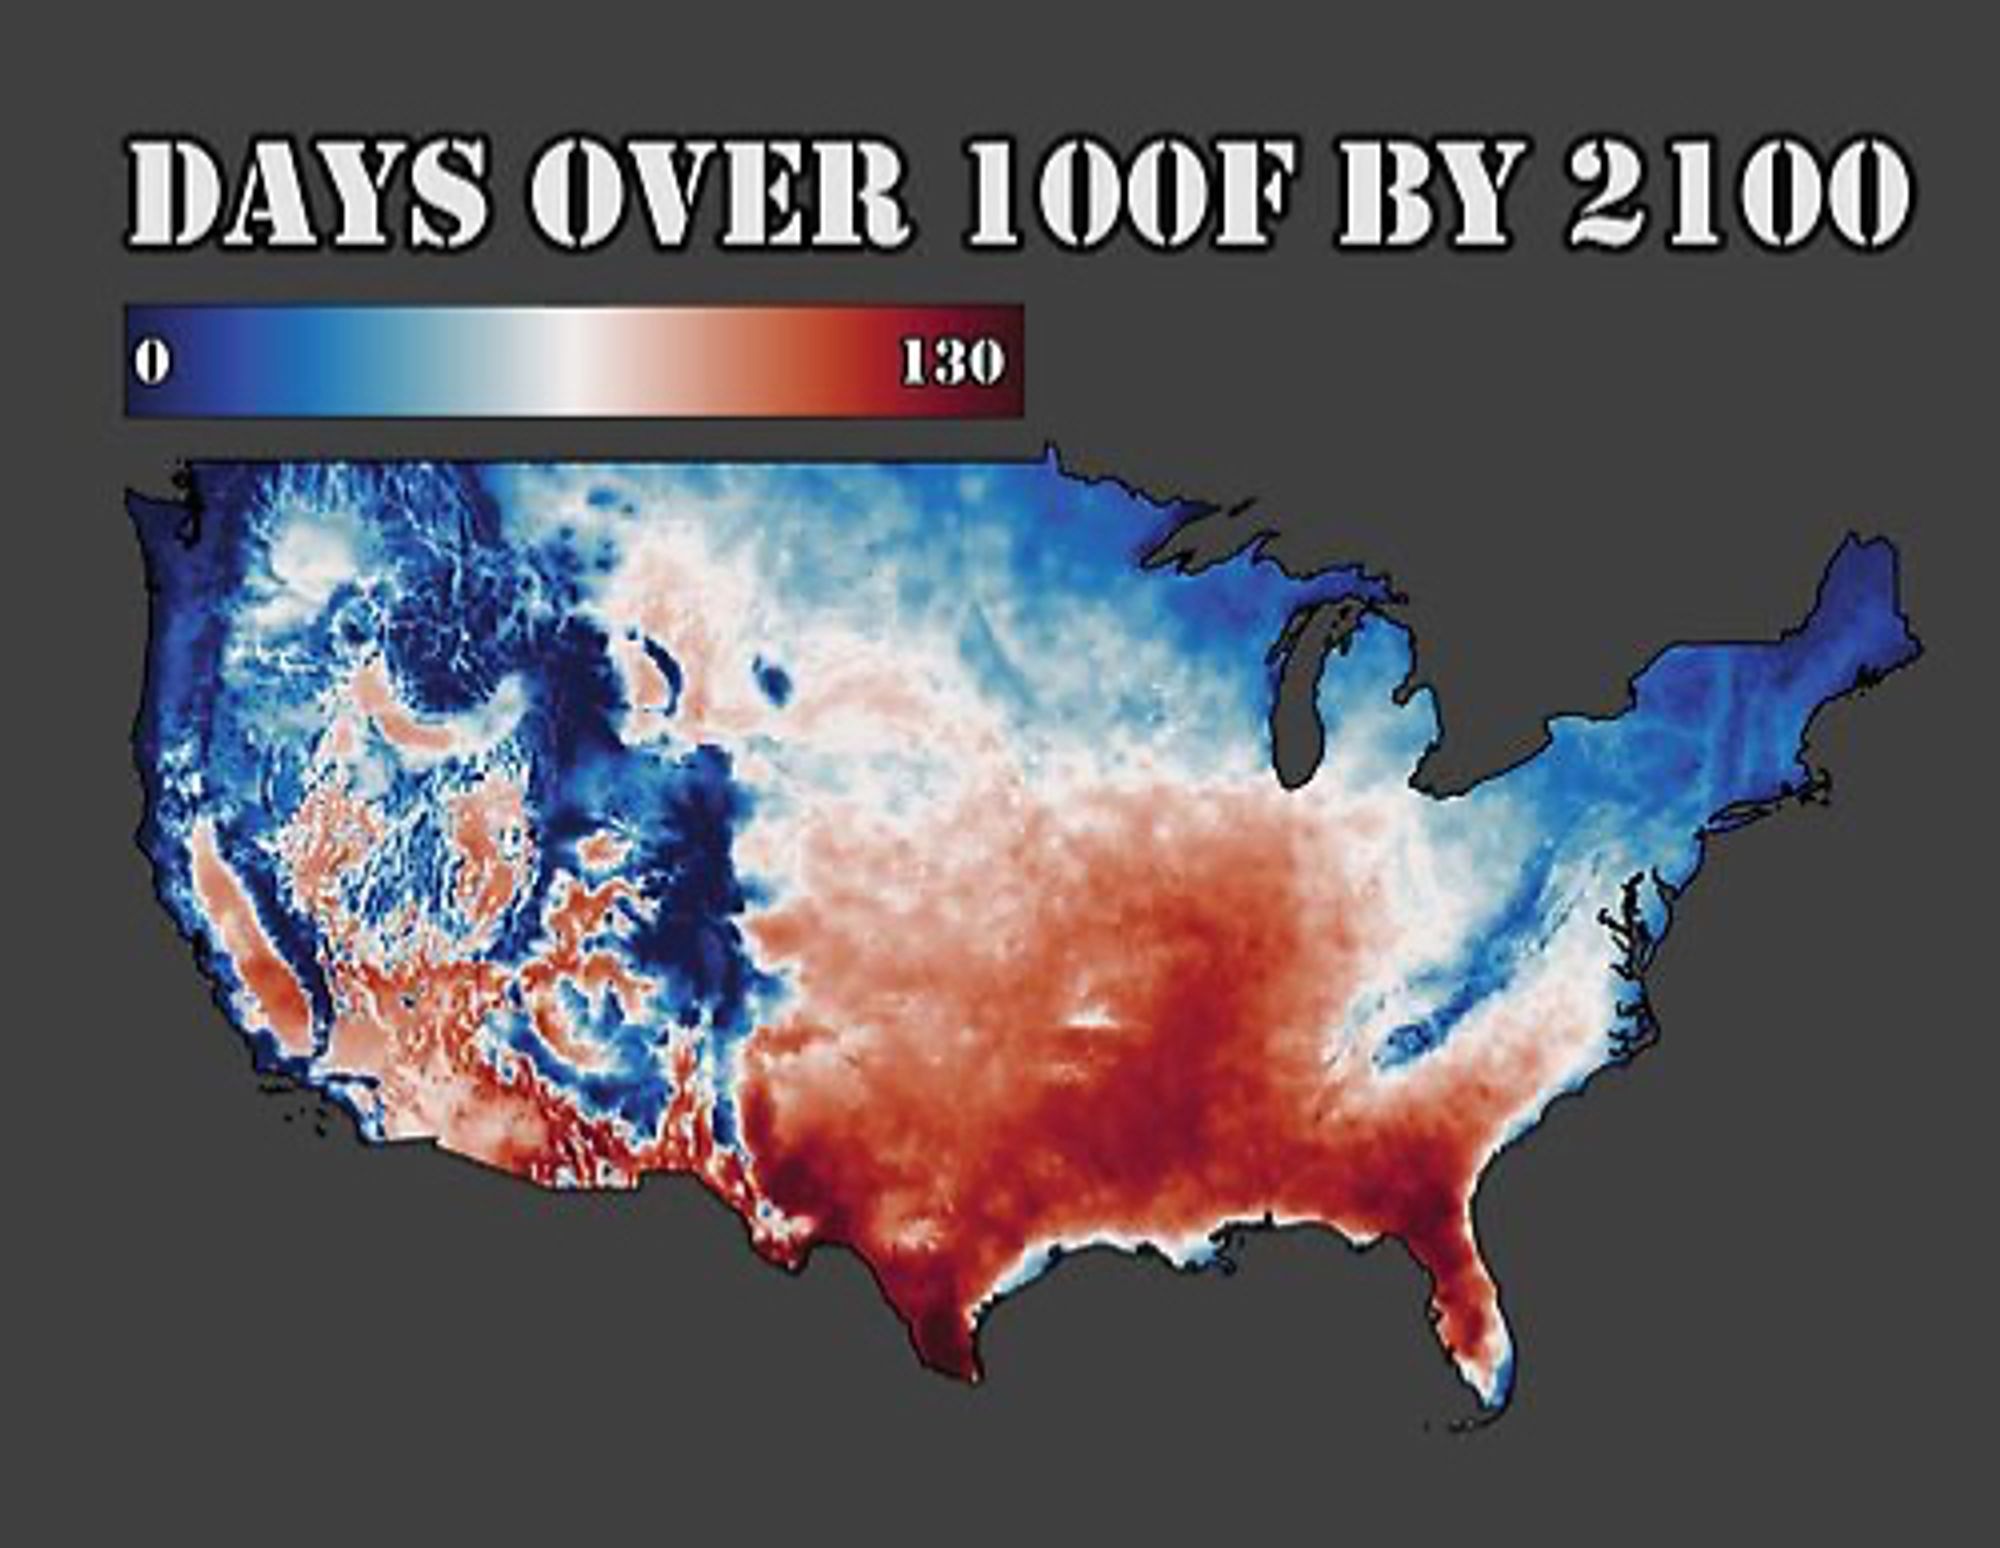
Replotted modeled climate (CMIP6) data from GlobalChange.gov to show the expected number of days with temperatures exceeding 100 F in 2100. 🧪
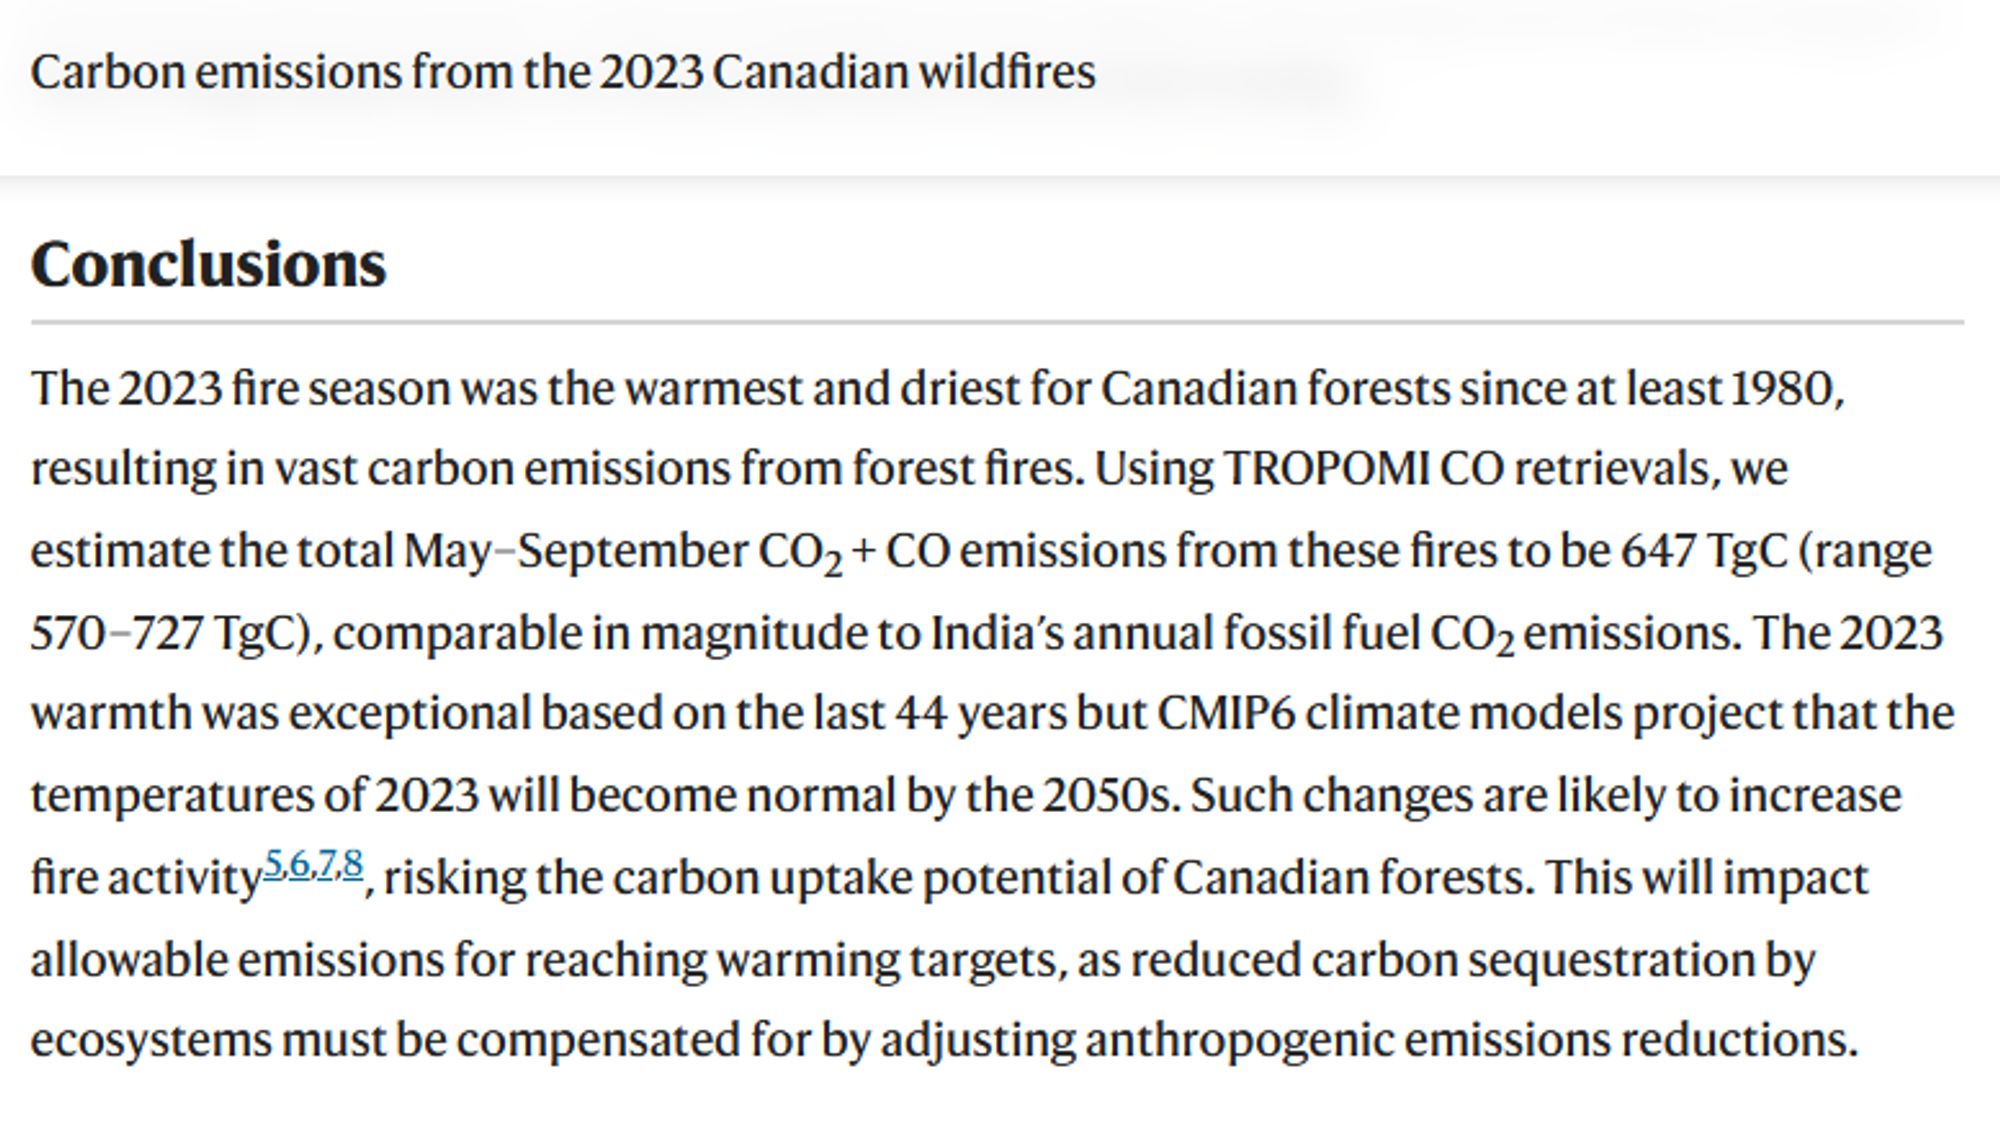
The conclusions from this study about carbon emissions from the 2023 Canadian wildfires are quite chilling Cannot even begin to fathom the hellscape that gets compared with the ANNUAL fossil fuel CO2 emissions of IndiaThe conclusions from this study about carbon emissions from the 2023 Canadian wildfires are quite chilling Cannot even begin to fathom the hellscape that gets compared with the ANNUAL fossil fuel CO2 emissions of India
Projecting changes in the drivers of compound flooding in Europe using CMIP6 models "Tim Hermans for the CMIP Seminar held on 28 August 2024 titled 'Projecting changes in the drivers of compound flooding in Europe using CMIP6 models'."Projecting changes in the drivers of compound flooding in Europe using CMIP6 models "Tim Hermans for the CMIP Seminar held on 28 August 2024 titled 'Projecting changes in the drivers of compound flooding in Europe using CMIP6 models'."
YouTube video by CMIP ─ Coupled Model Intercomparison Project