Women's wage gains mark a change in hiring dynamics, as women approach an equal share of the earnings power of all new hires. The latest from the New Hires Quality Index. 📉📈 #NHQI

Hershbein's latest analysis and links to the New Hires Quality Index are here. #NHQI 📈📉

The new hire wage numbers show “the labor market was slowing for a lot longer than commonly thought,” Brad Hershbein tells @usatoday.com#Econsky#NHQI

Pay for newly hired workers is dropping after adjusting for inflation. As the Fed weighs rate cuts this week, it's a sign of a weakening job market
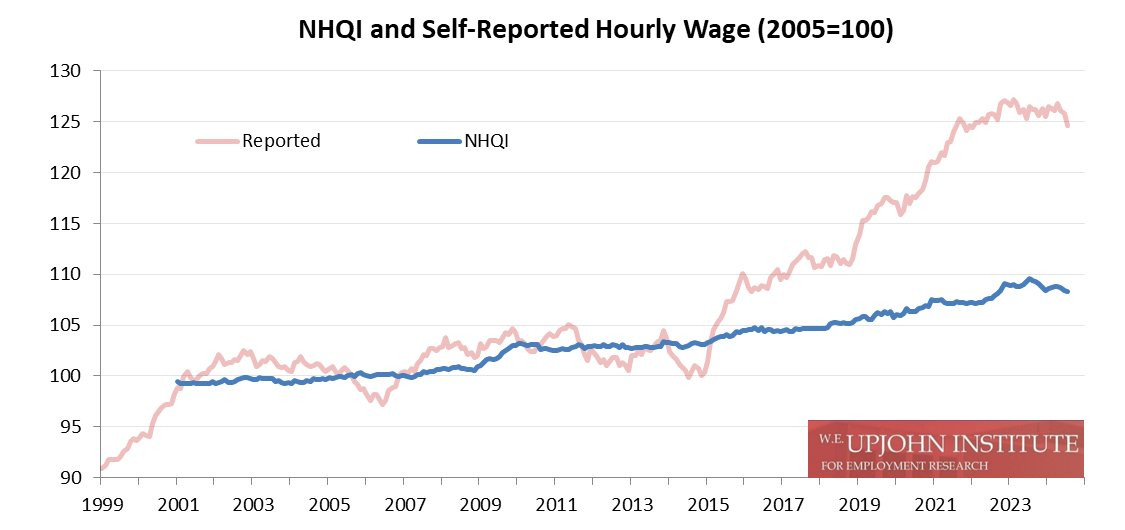
Since 2005, real, self-reported hourly wages of new hires have grown 24.7 percent. Netting out the 8.3 percent growth in the NHQI, composition-adjusted real wages of new hires grew 16.4 percent, about 0.8 percent per year. (7/13)
From July 2022 through July 2024, the actual real wages of new hires fell 0.9 percent, while the NHQI wage index rose 0.7 percent. The difference implies that average real wage growth of new hires, controlling for changes in their occupations and demographics, fell 1.6 percent. (5/13)
The recent pattern is a strong indicator of a steadily weakening—but not yet weak—labor market. The NHQI release last year (see link) documented warning signs. (3/13)

The current average real wage of new hires, $23.51, is actually slightly less than it was two years ago but 7.6 percent above February 2020. This stagnation over the past 30ish months follows a blistering 23 percent inflation-adjusted increase between January 2015 and January 2022. (2/13)
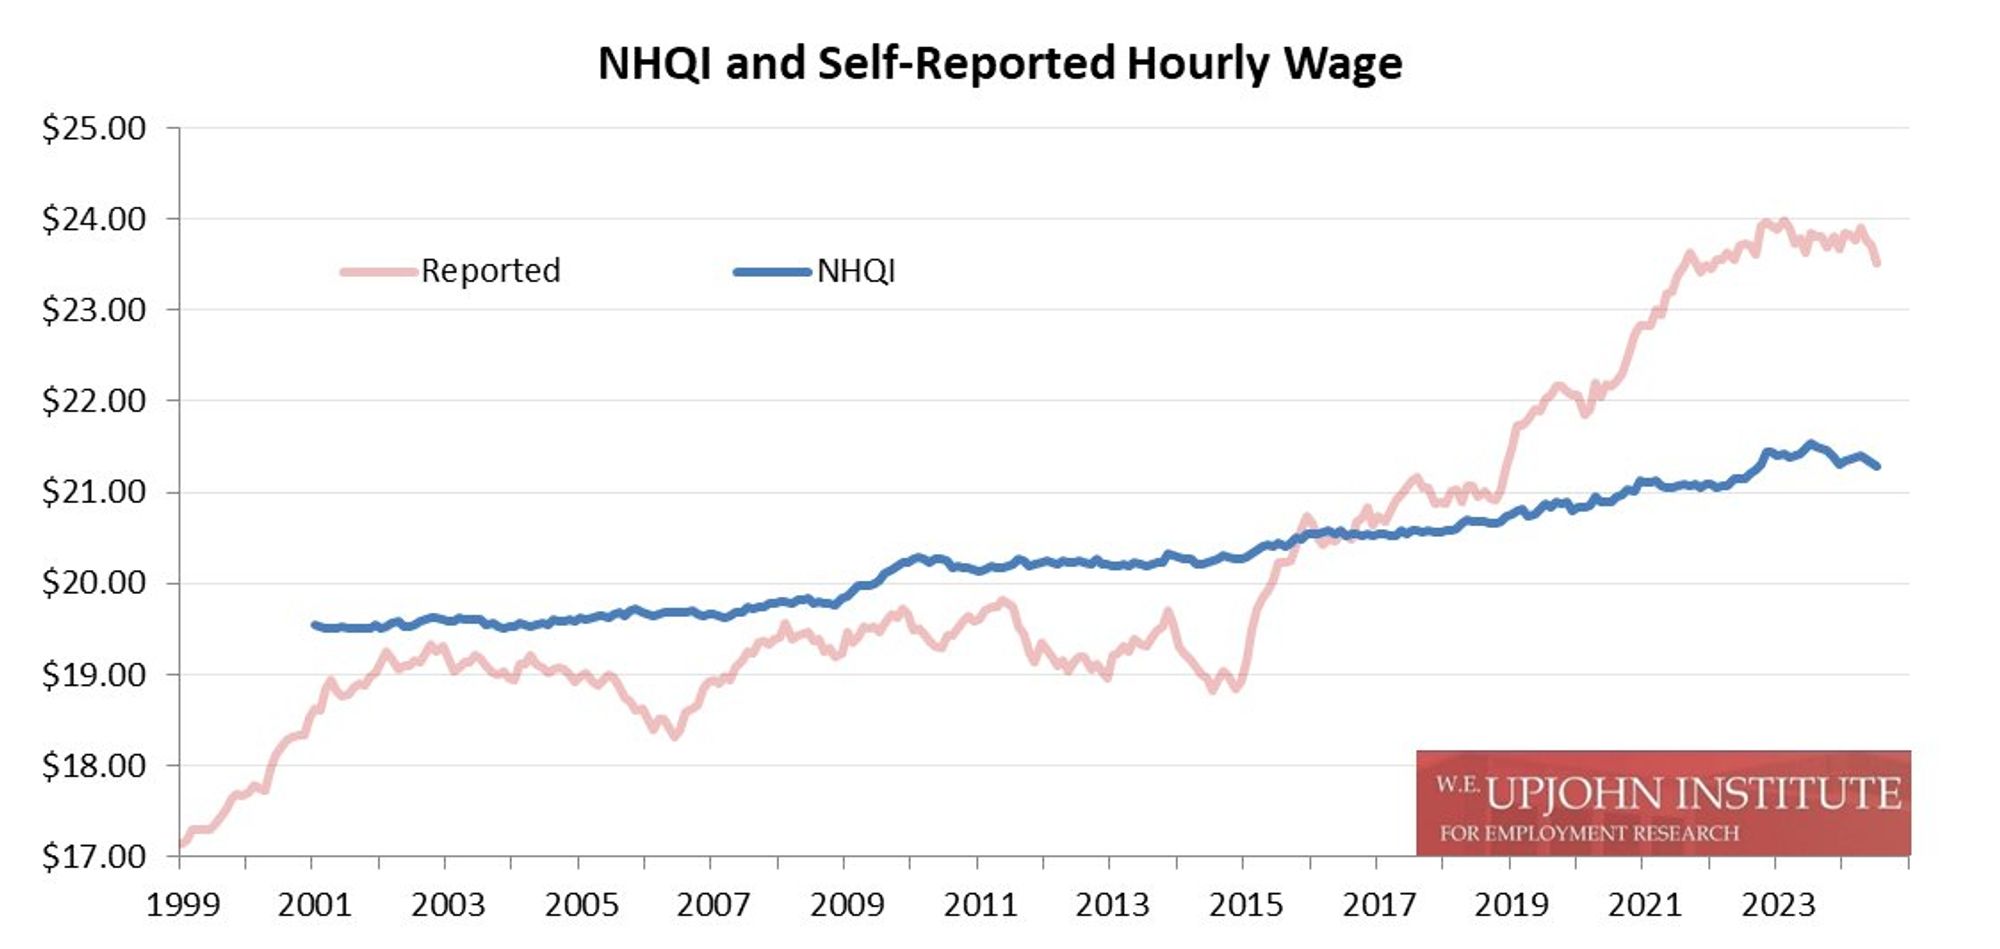
Actual, inflation-adjusted wage growth of newly hired workers surged at an annualized rate of 3.5 percent between July 2020 and July 2022, slowed sharply to 0.5 percent between July 2022 and July 2023, and has turned negative over the last 12 months, *losing* 1.5 percent. (1/13)
As a Labor Day treat, the New Hires Quality Index examines *actual* reported wage growth of newly hired workers. (NHQI typically captures “earnings power” from occupational wages, not self-reported wages.) There’s a lot going on with wages, so index creator Brad Hershbein has this thread. #Econsky

The share of the total earnings power among all new hires accruing to the goods sector has declined over many years and now sits at 17.5 percent, near a series low. The latest from the New Hires Quality Index. #NHQI#EconSky