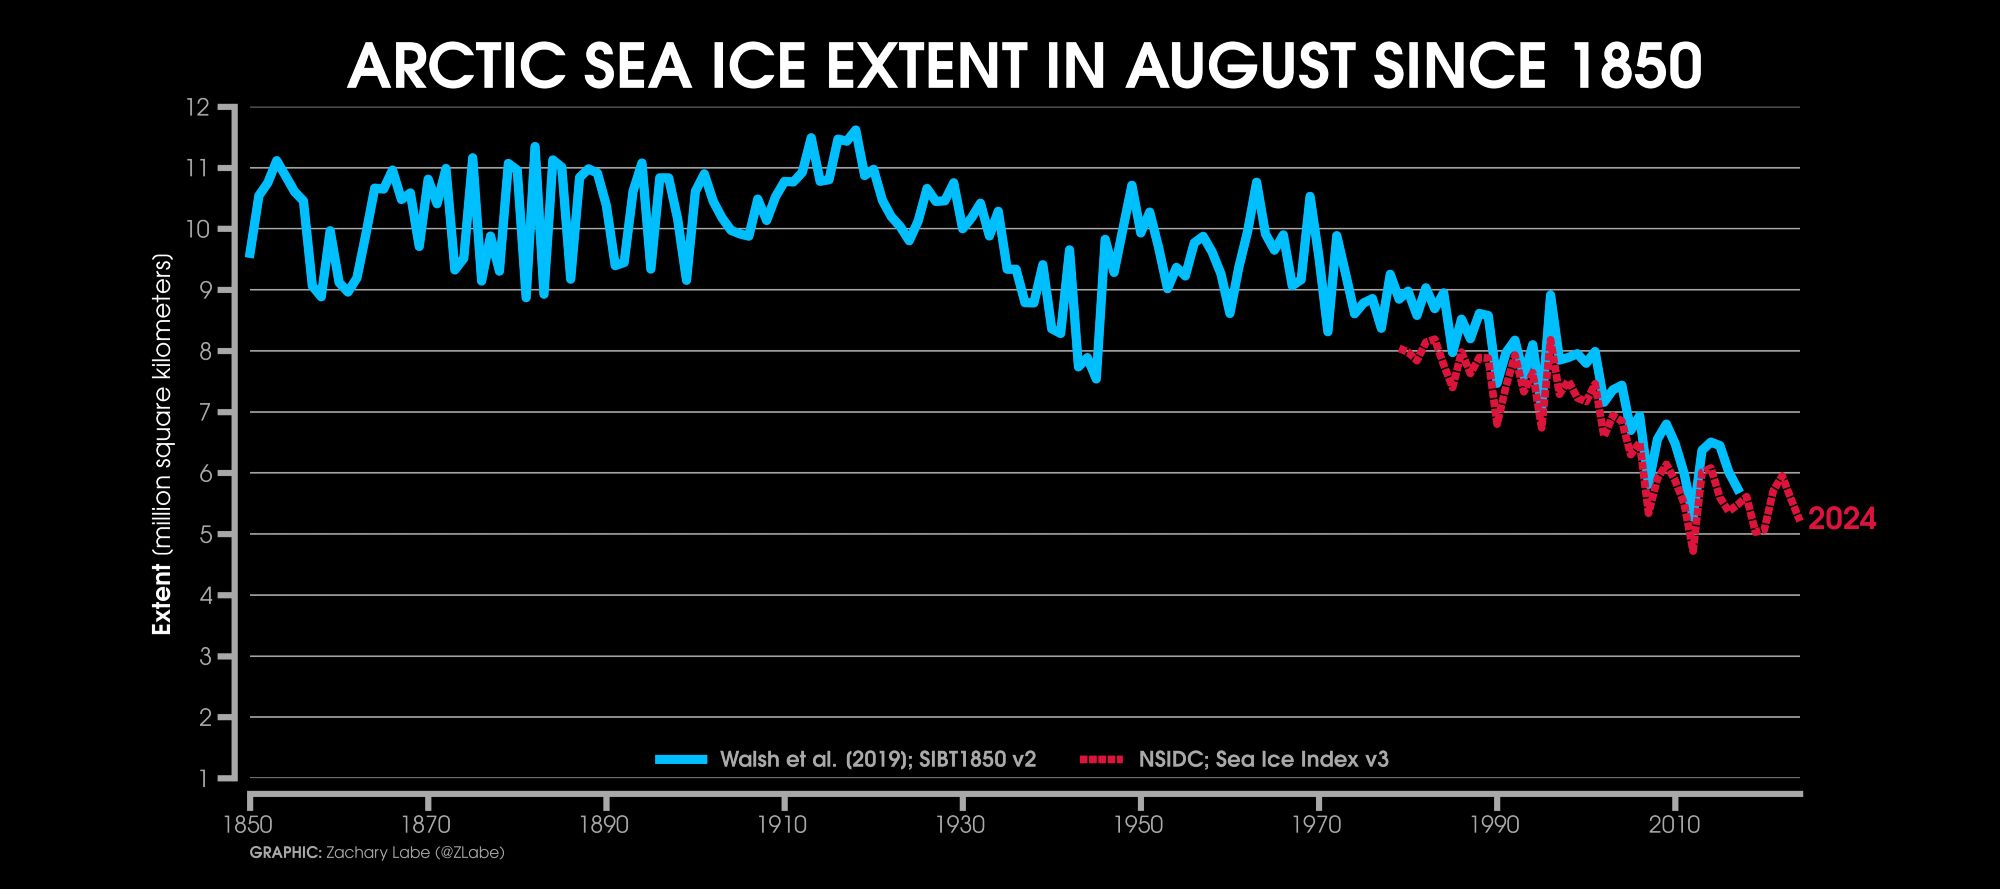
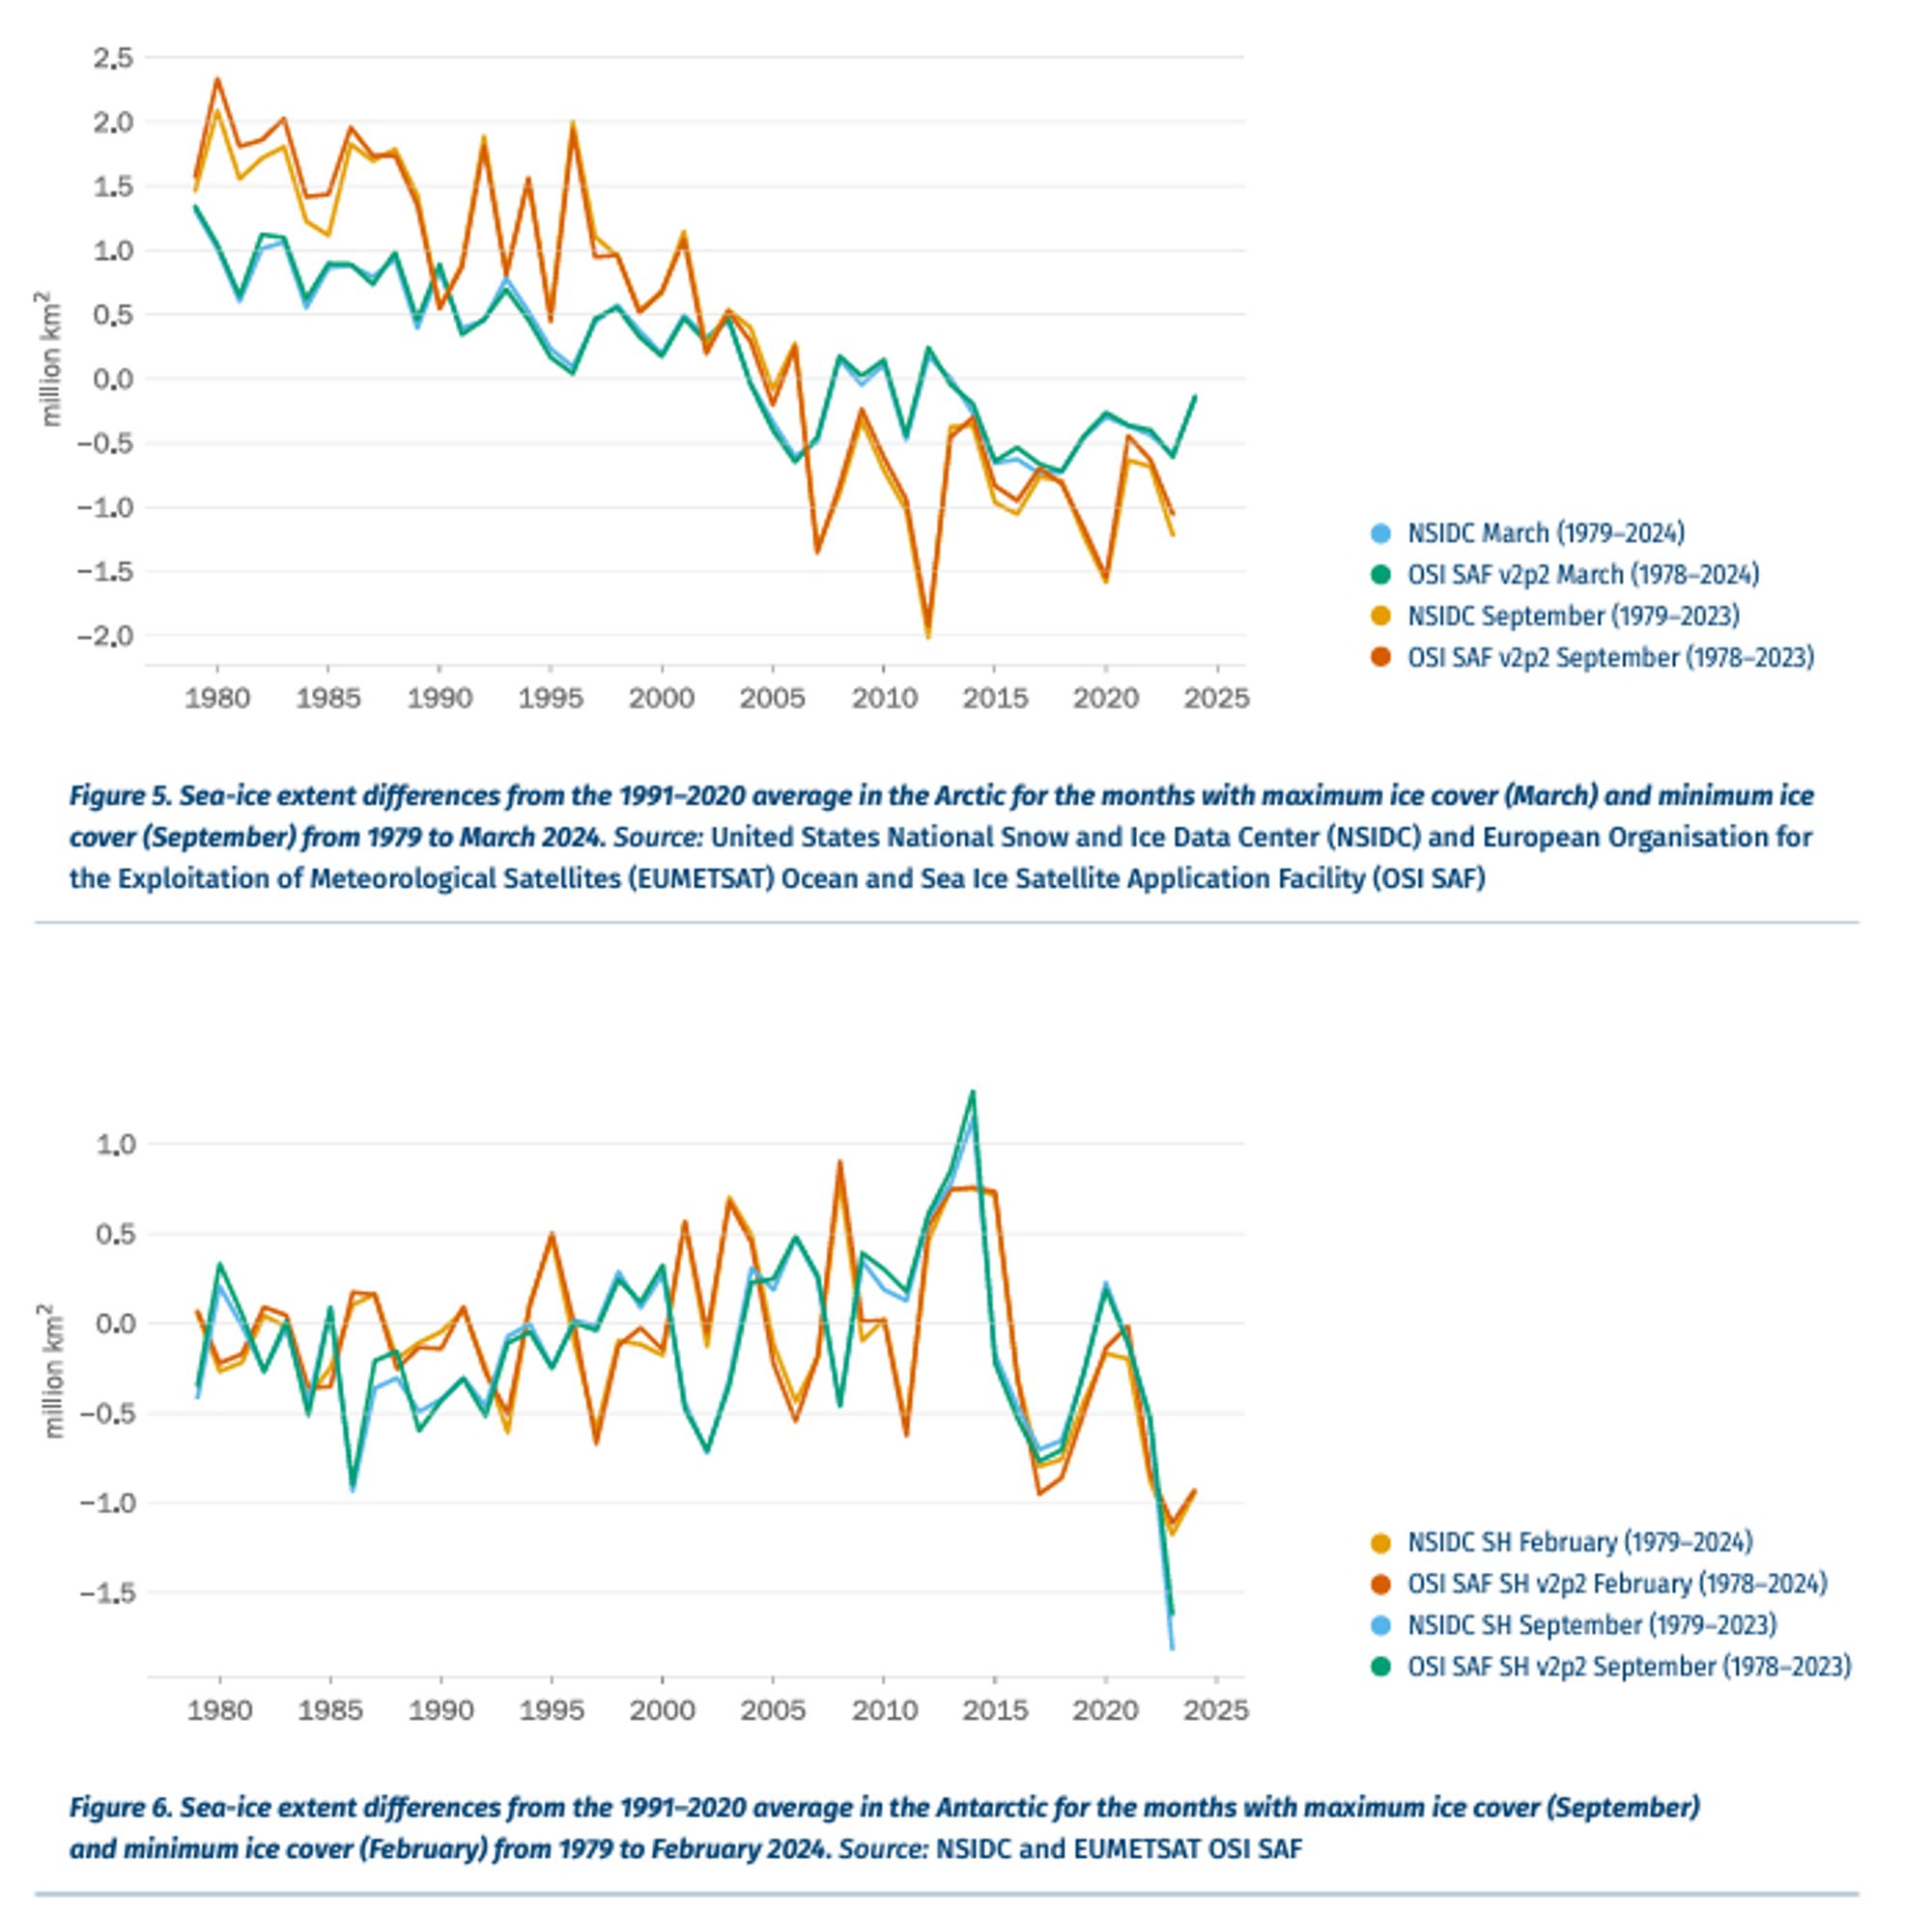
Arctic sea ice retreated to near-historic lows in the Northern Hemisphere this summer, likely melting to its minimum extent for the year on Sept.11, 2024, according to researchers at NASA and the National Snow and Ice Data Center (NSIDC). cerebral-overload.com/?p=117543
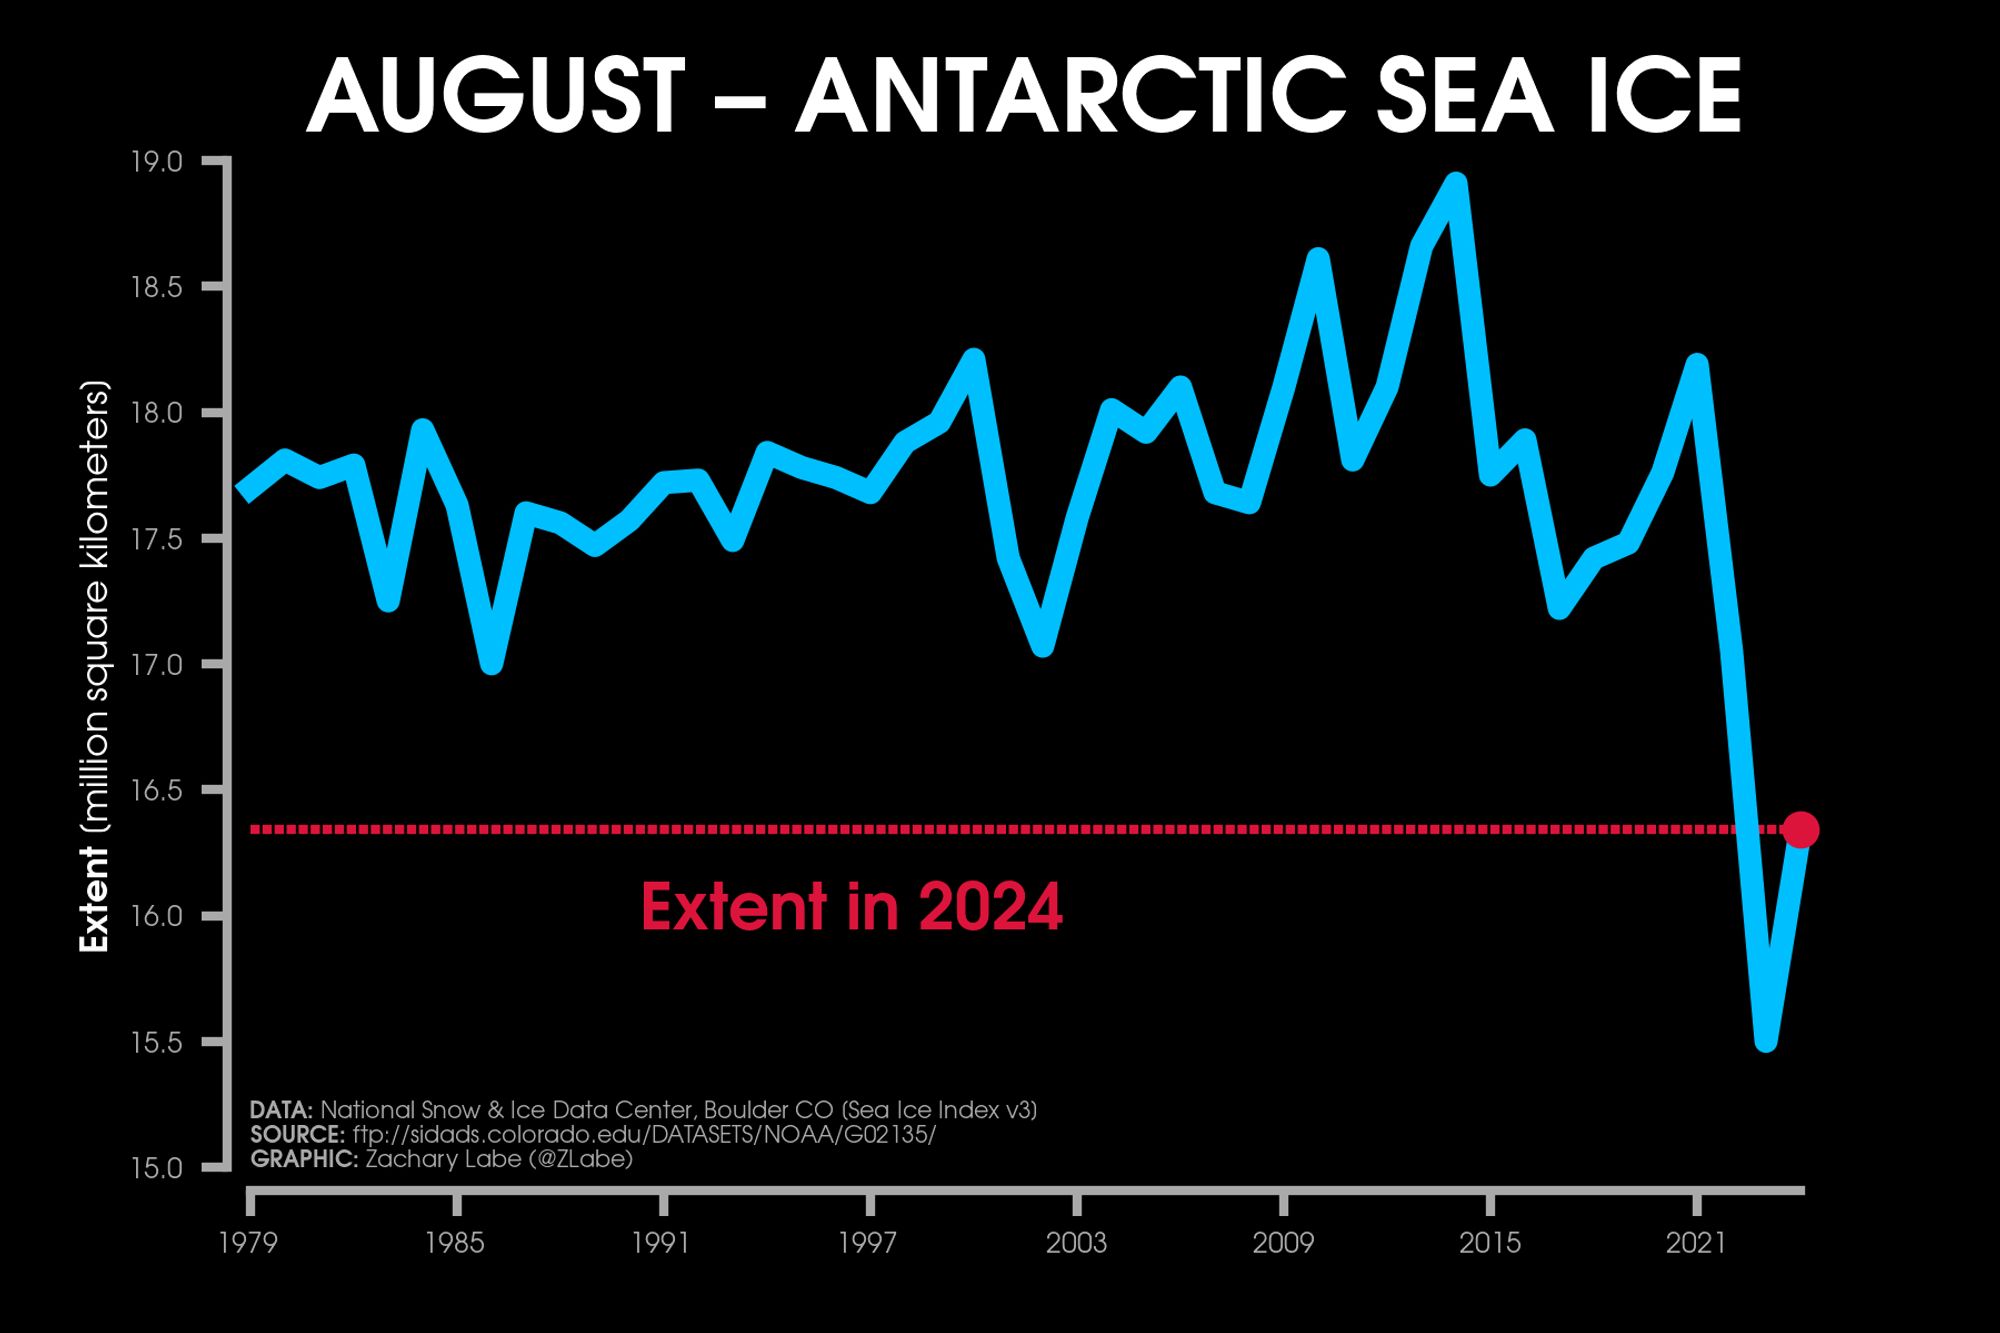
Arctic Sea Ice Near Historic Low; Antarctic Ice Continues Decline - NASA Goddard #Antarctic#SeaIce#Arctic#Cryosphere#NSIDC#NASA
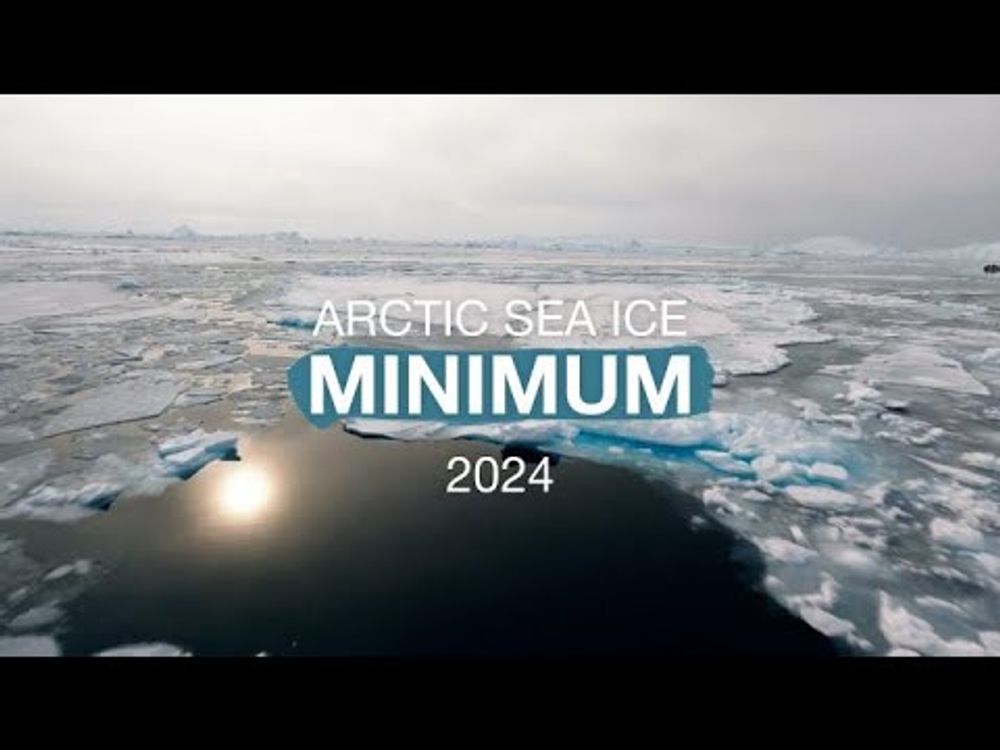
YouTube video by NASA Goddard
The NSIDC announced the 2024 Arctic sea ice minimum extent today: greatwhitecon.info/2024/09/the-...#Arctic alter ego descended into the heart of darkness...
*Note that there is currently an SSMIS outage, and my other plots using NSIDC data will therefore not be able to update at this time.
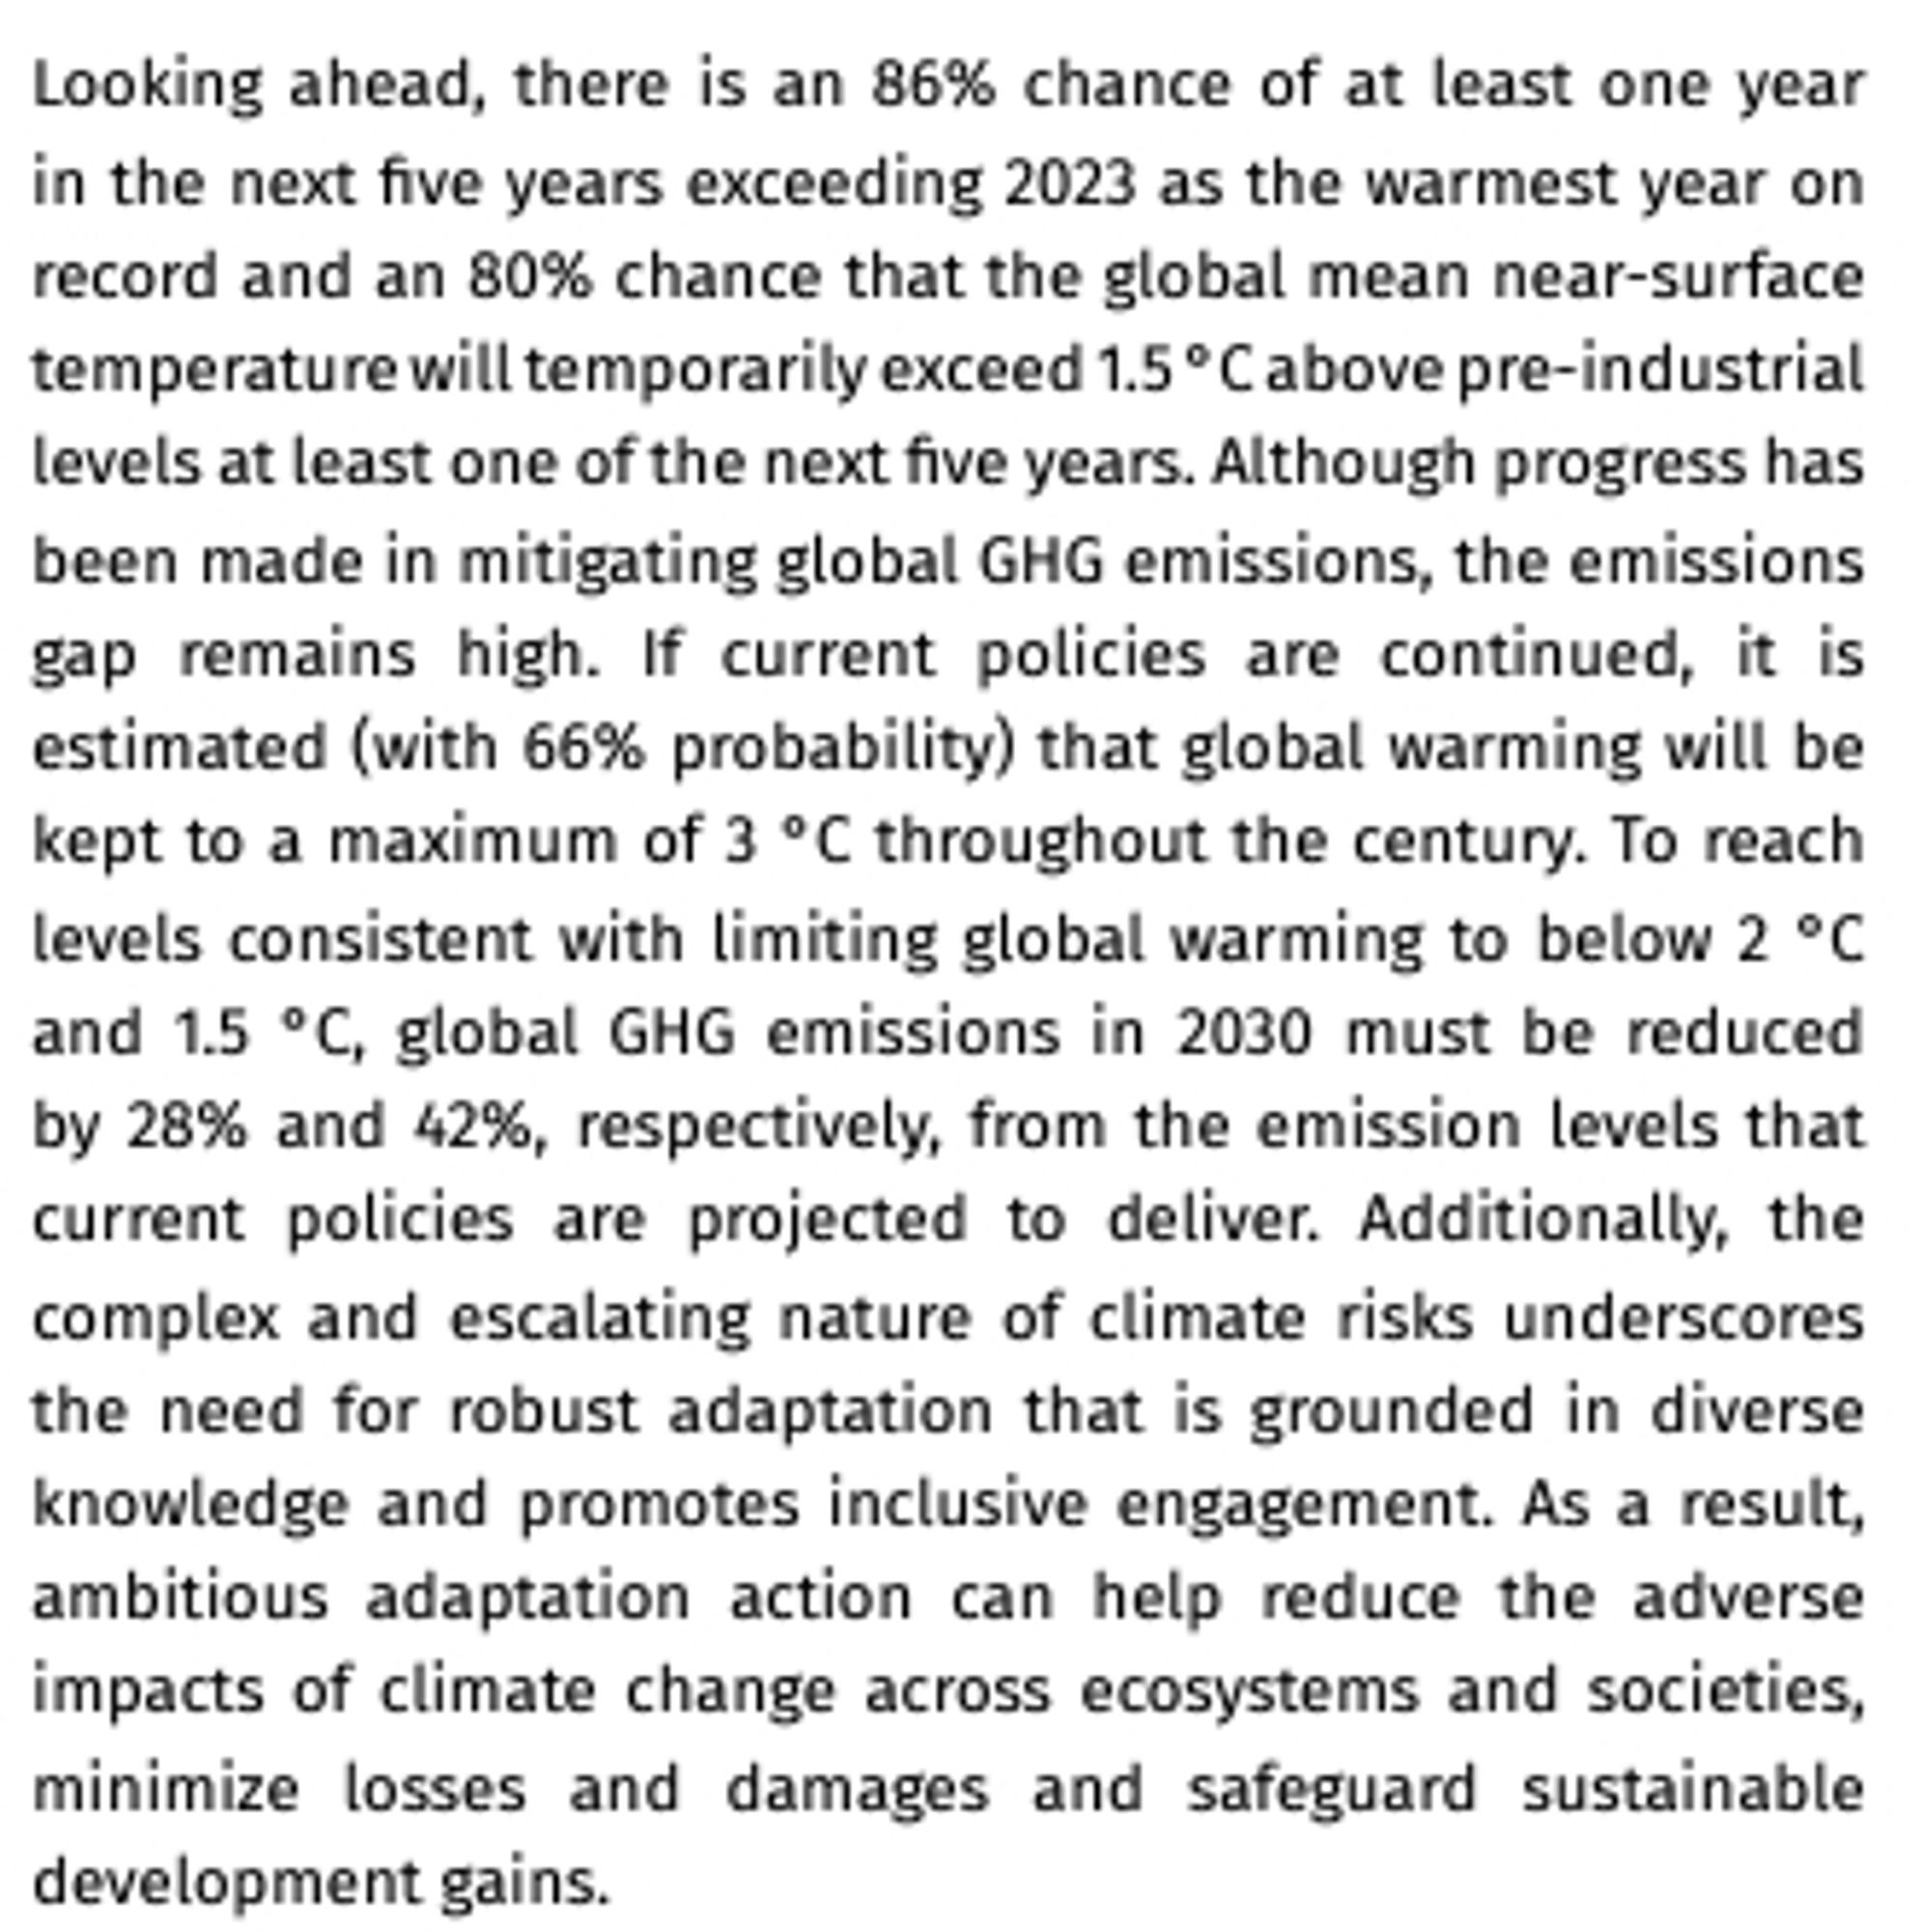
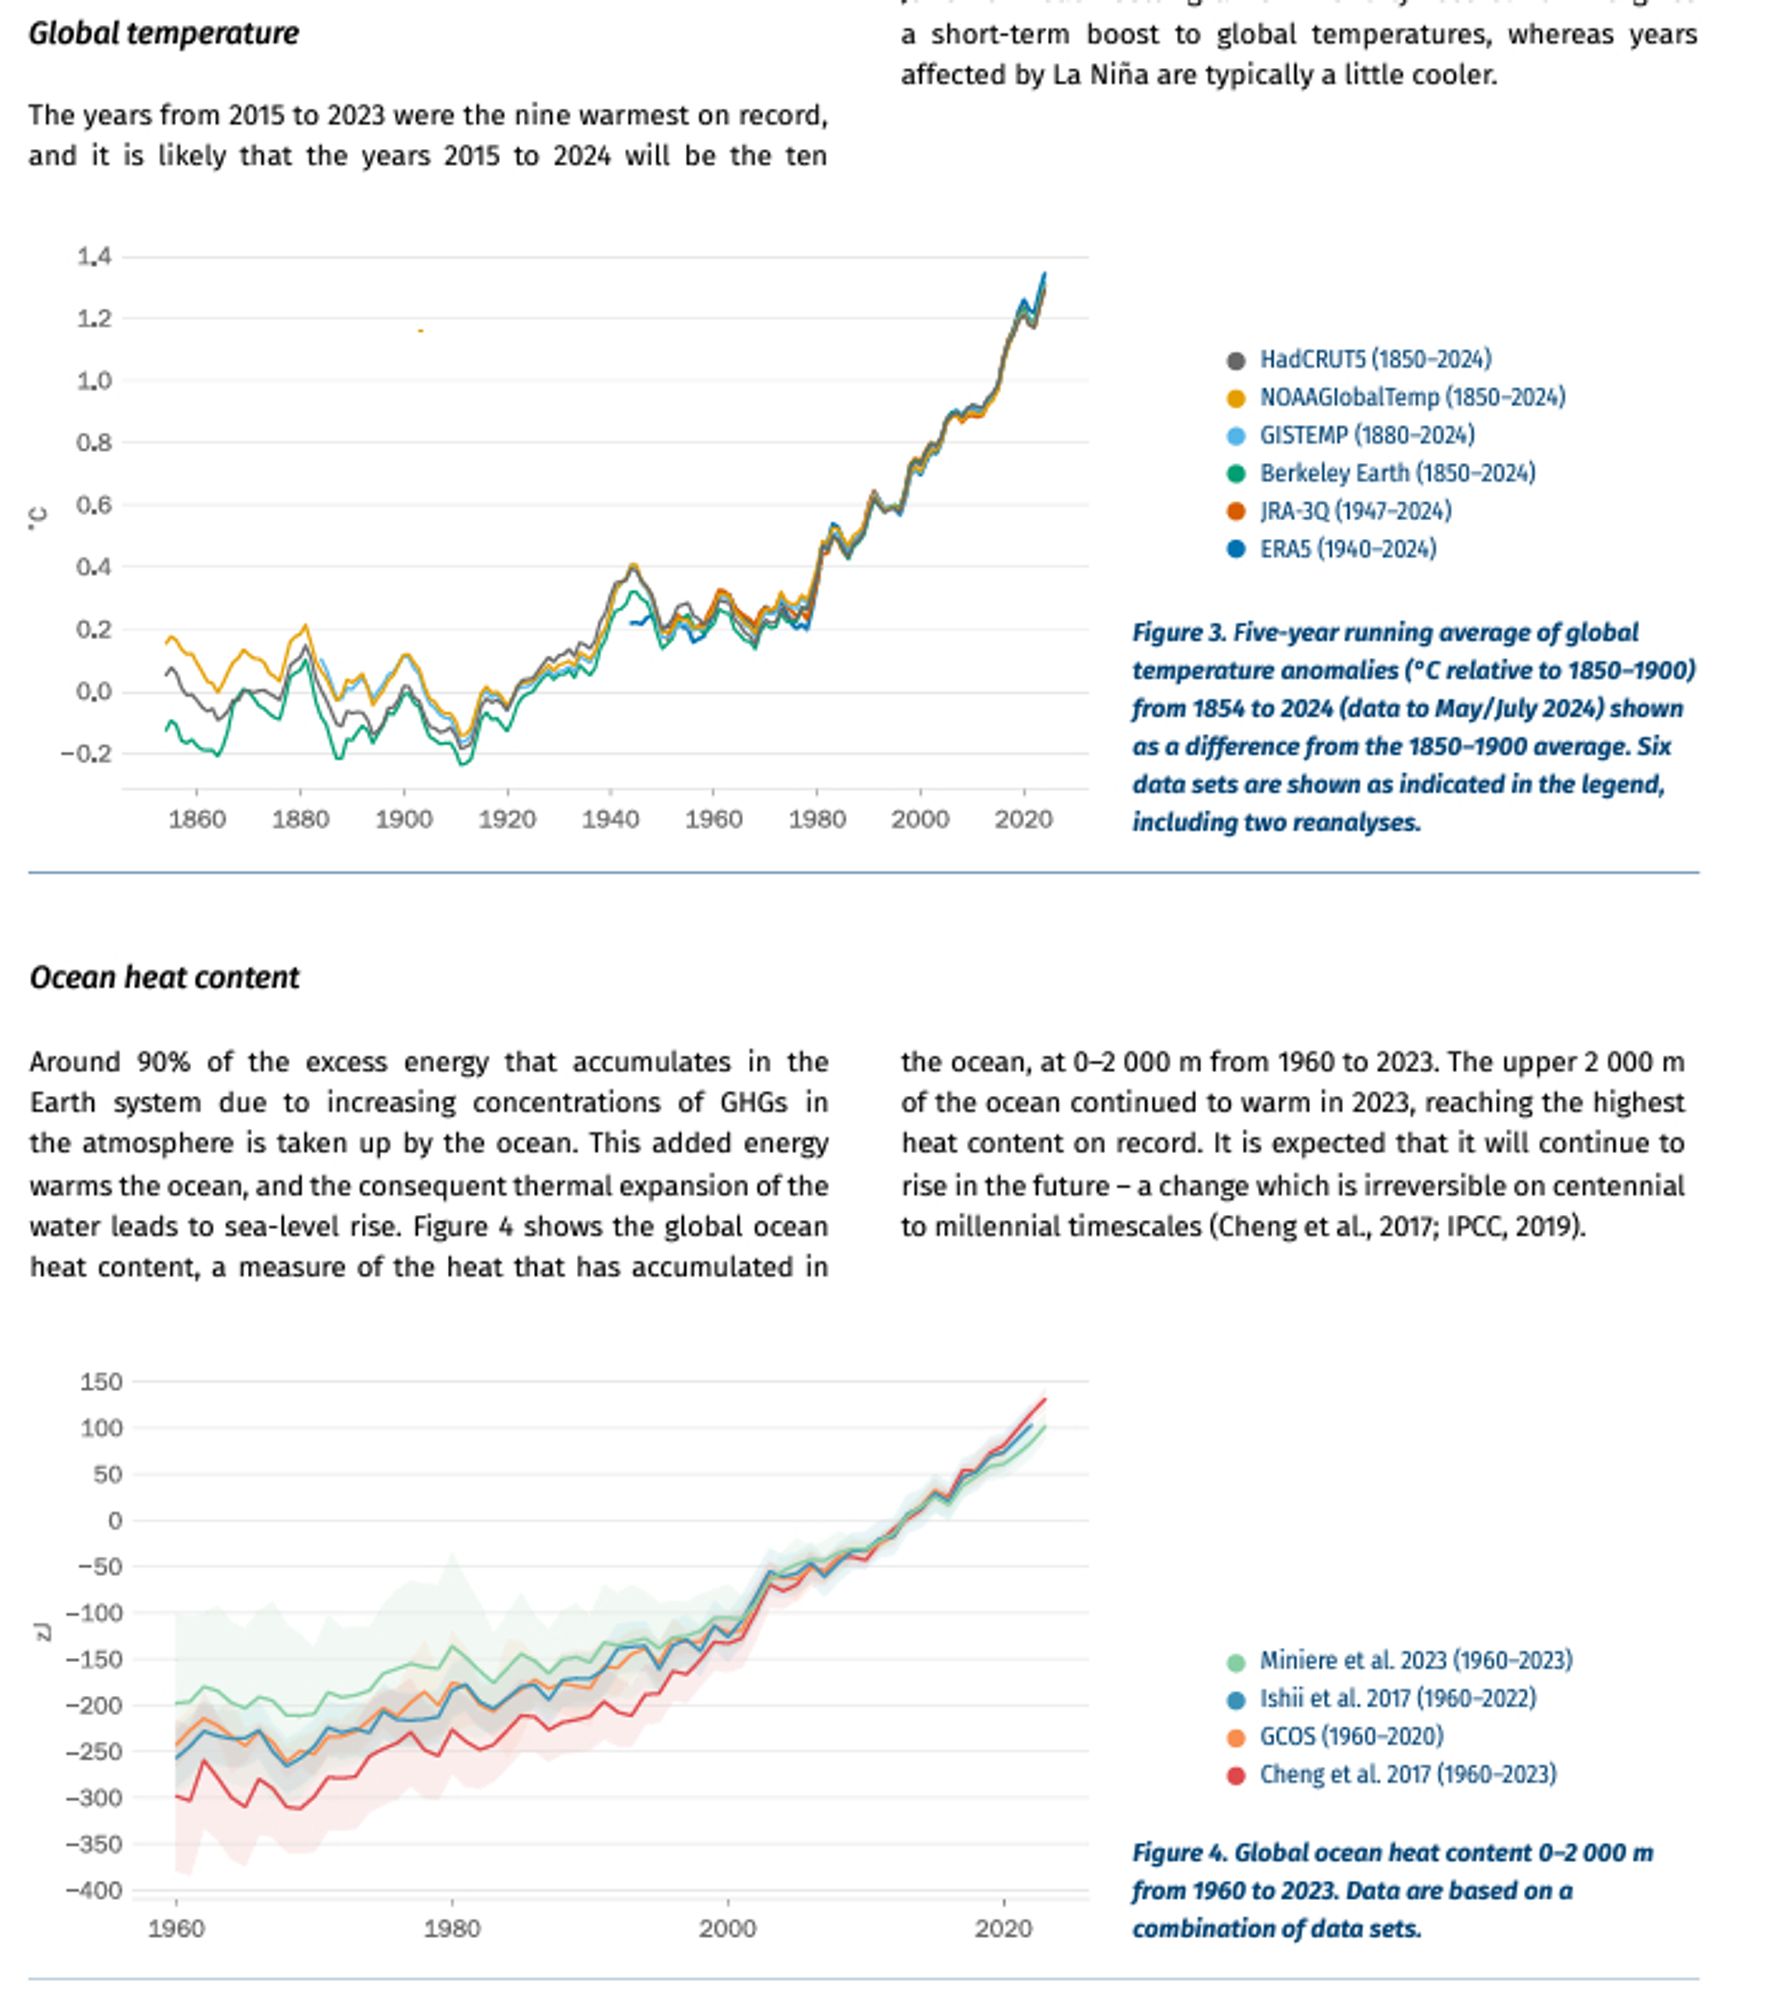
Pra quem não leu o ultimo relatorio da World Meteorological Organization (WMO), em parceria com as Nações Unidas, segue aqui um resumo: It's over in ways we are not even aware of
:( The National Snow and Ice Center's near real time sea ice data has been down for the past few days. Climate data records are a long term project that take continual effort to maintain. I'm grateful to NSIDC for their work. Here's hoping the issue is minor and easily addressed