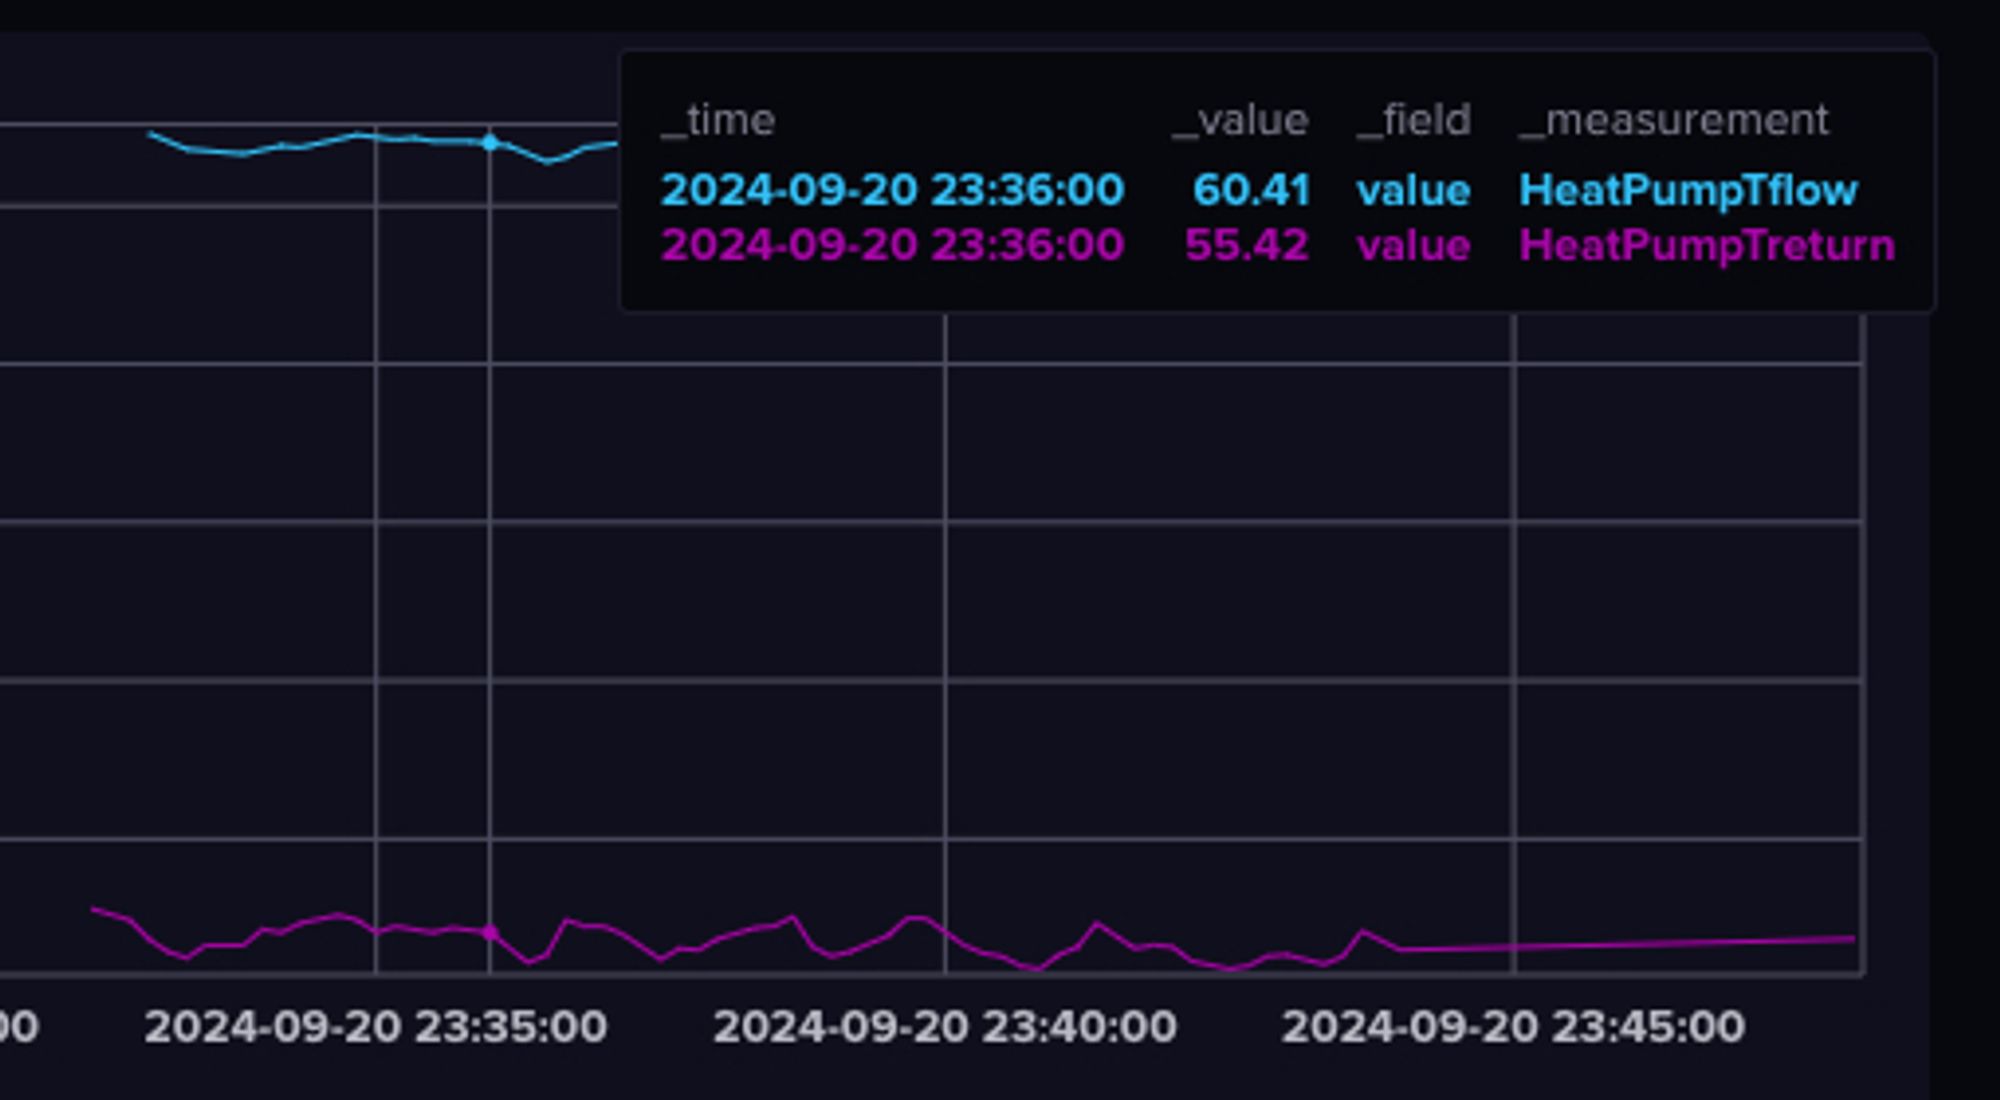
done der PI ist eingerichtet mit einem ubuntu, docker compose läuft auch nun mit NodeRed, InfluxDB und Grafana. Die wichtigsten Daten werden nun abgespeichert, Grafana kann warten
Erste Versuche mit MODBUS TCP, über NodeRed Daten in eine InfluxDB schreiben, klappt überraschend einfach. #Wärmepumpe
how to send a #newsletter#RSSgithub.com/brunoamaral/...#NodeREDbrunoamaral.eu/story/weekly...#staticsitegenerator#python#code

A python script to read an RSS feed and send the last post as a newsletter using Mailgun - brunoamaral/newsletter-from-rss
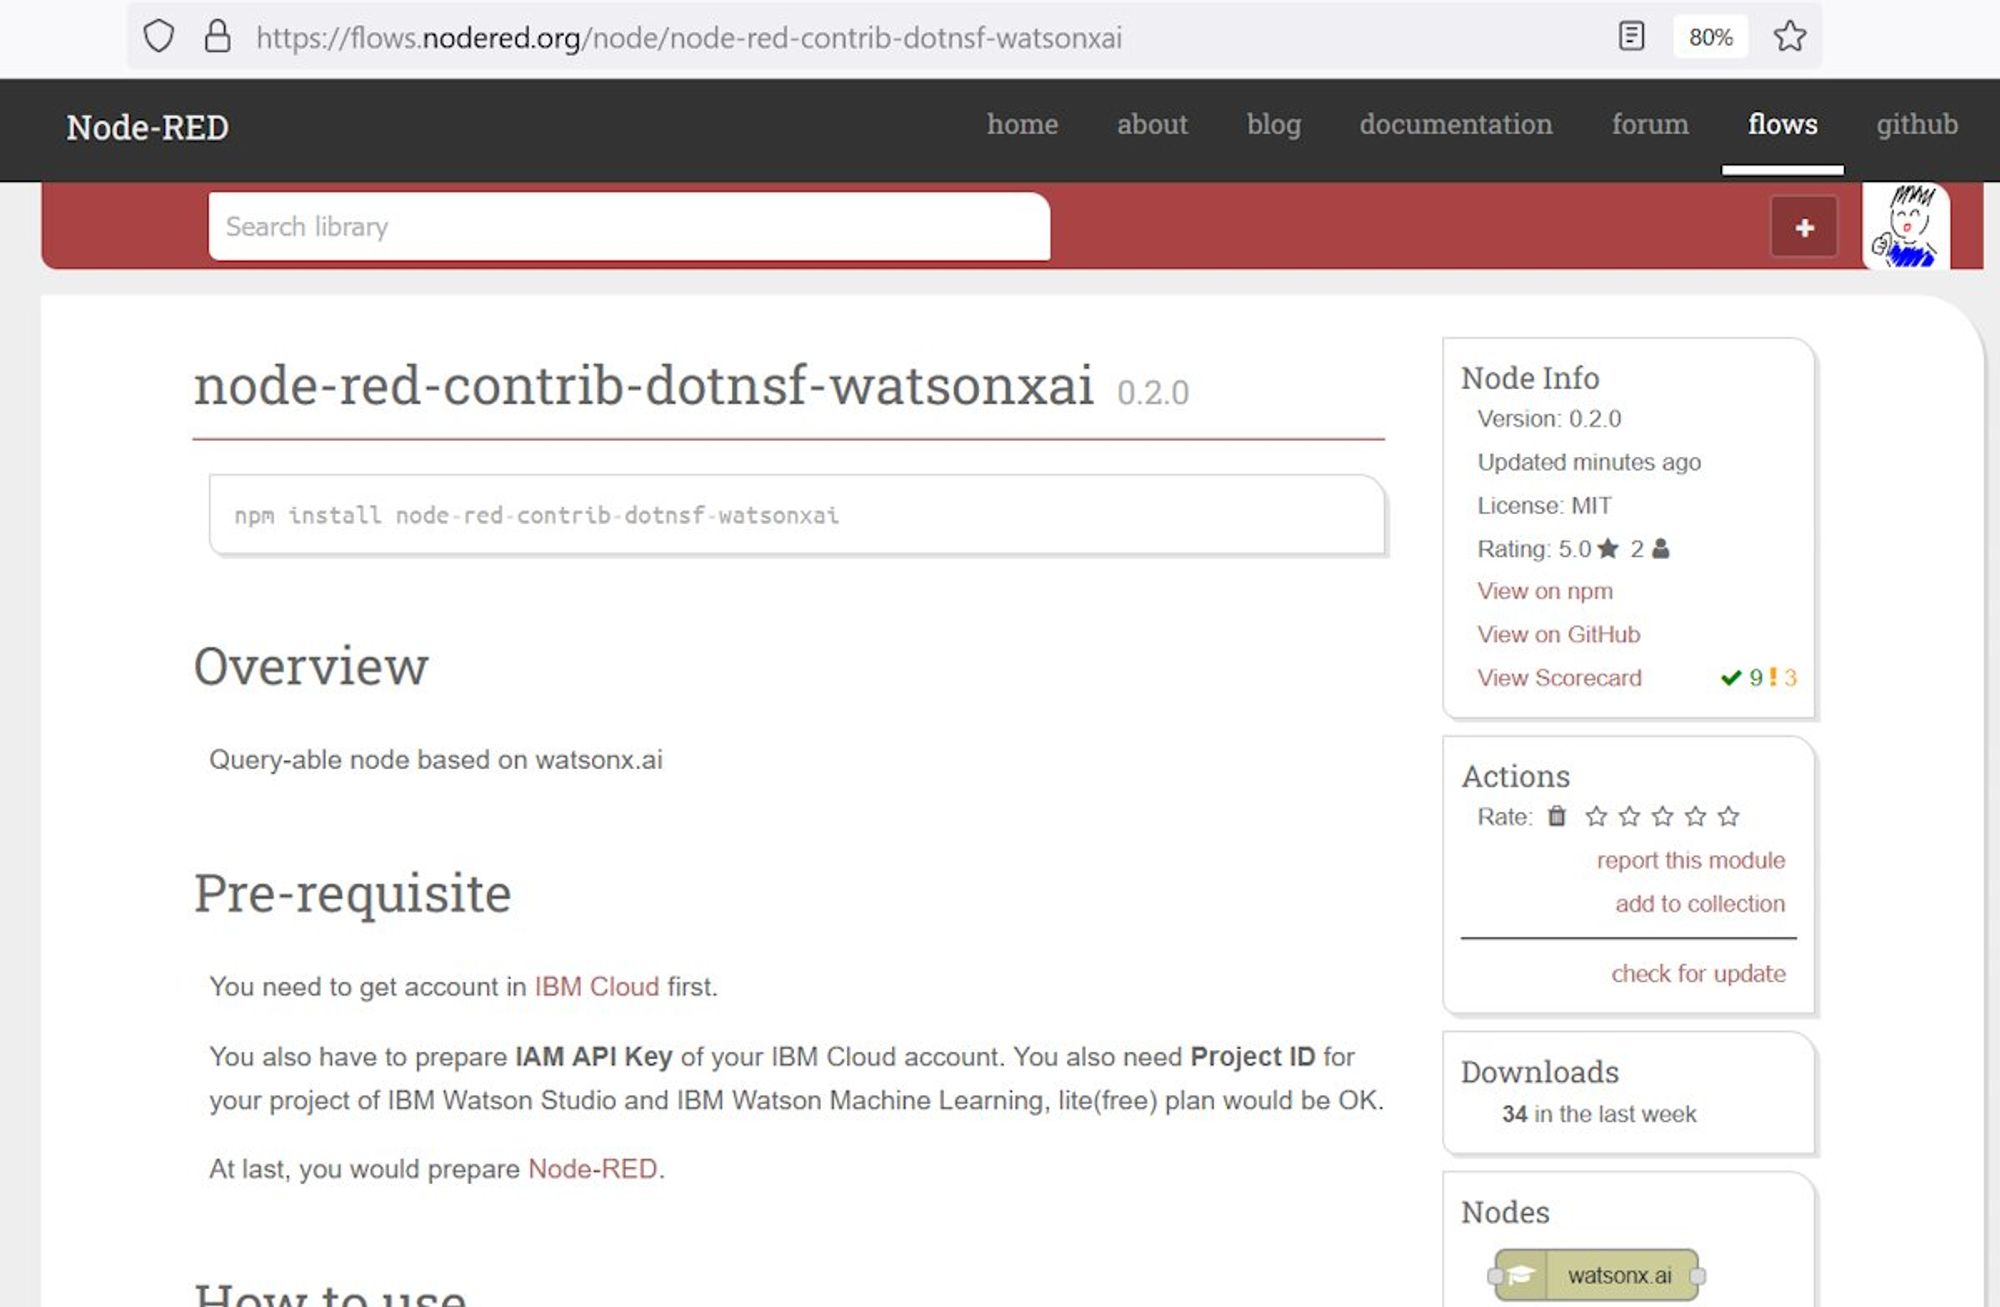
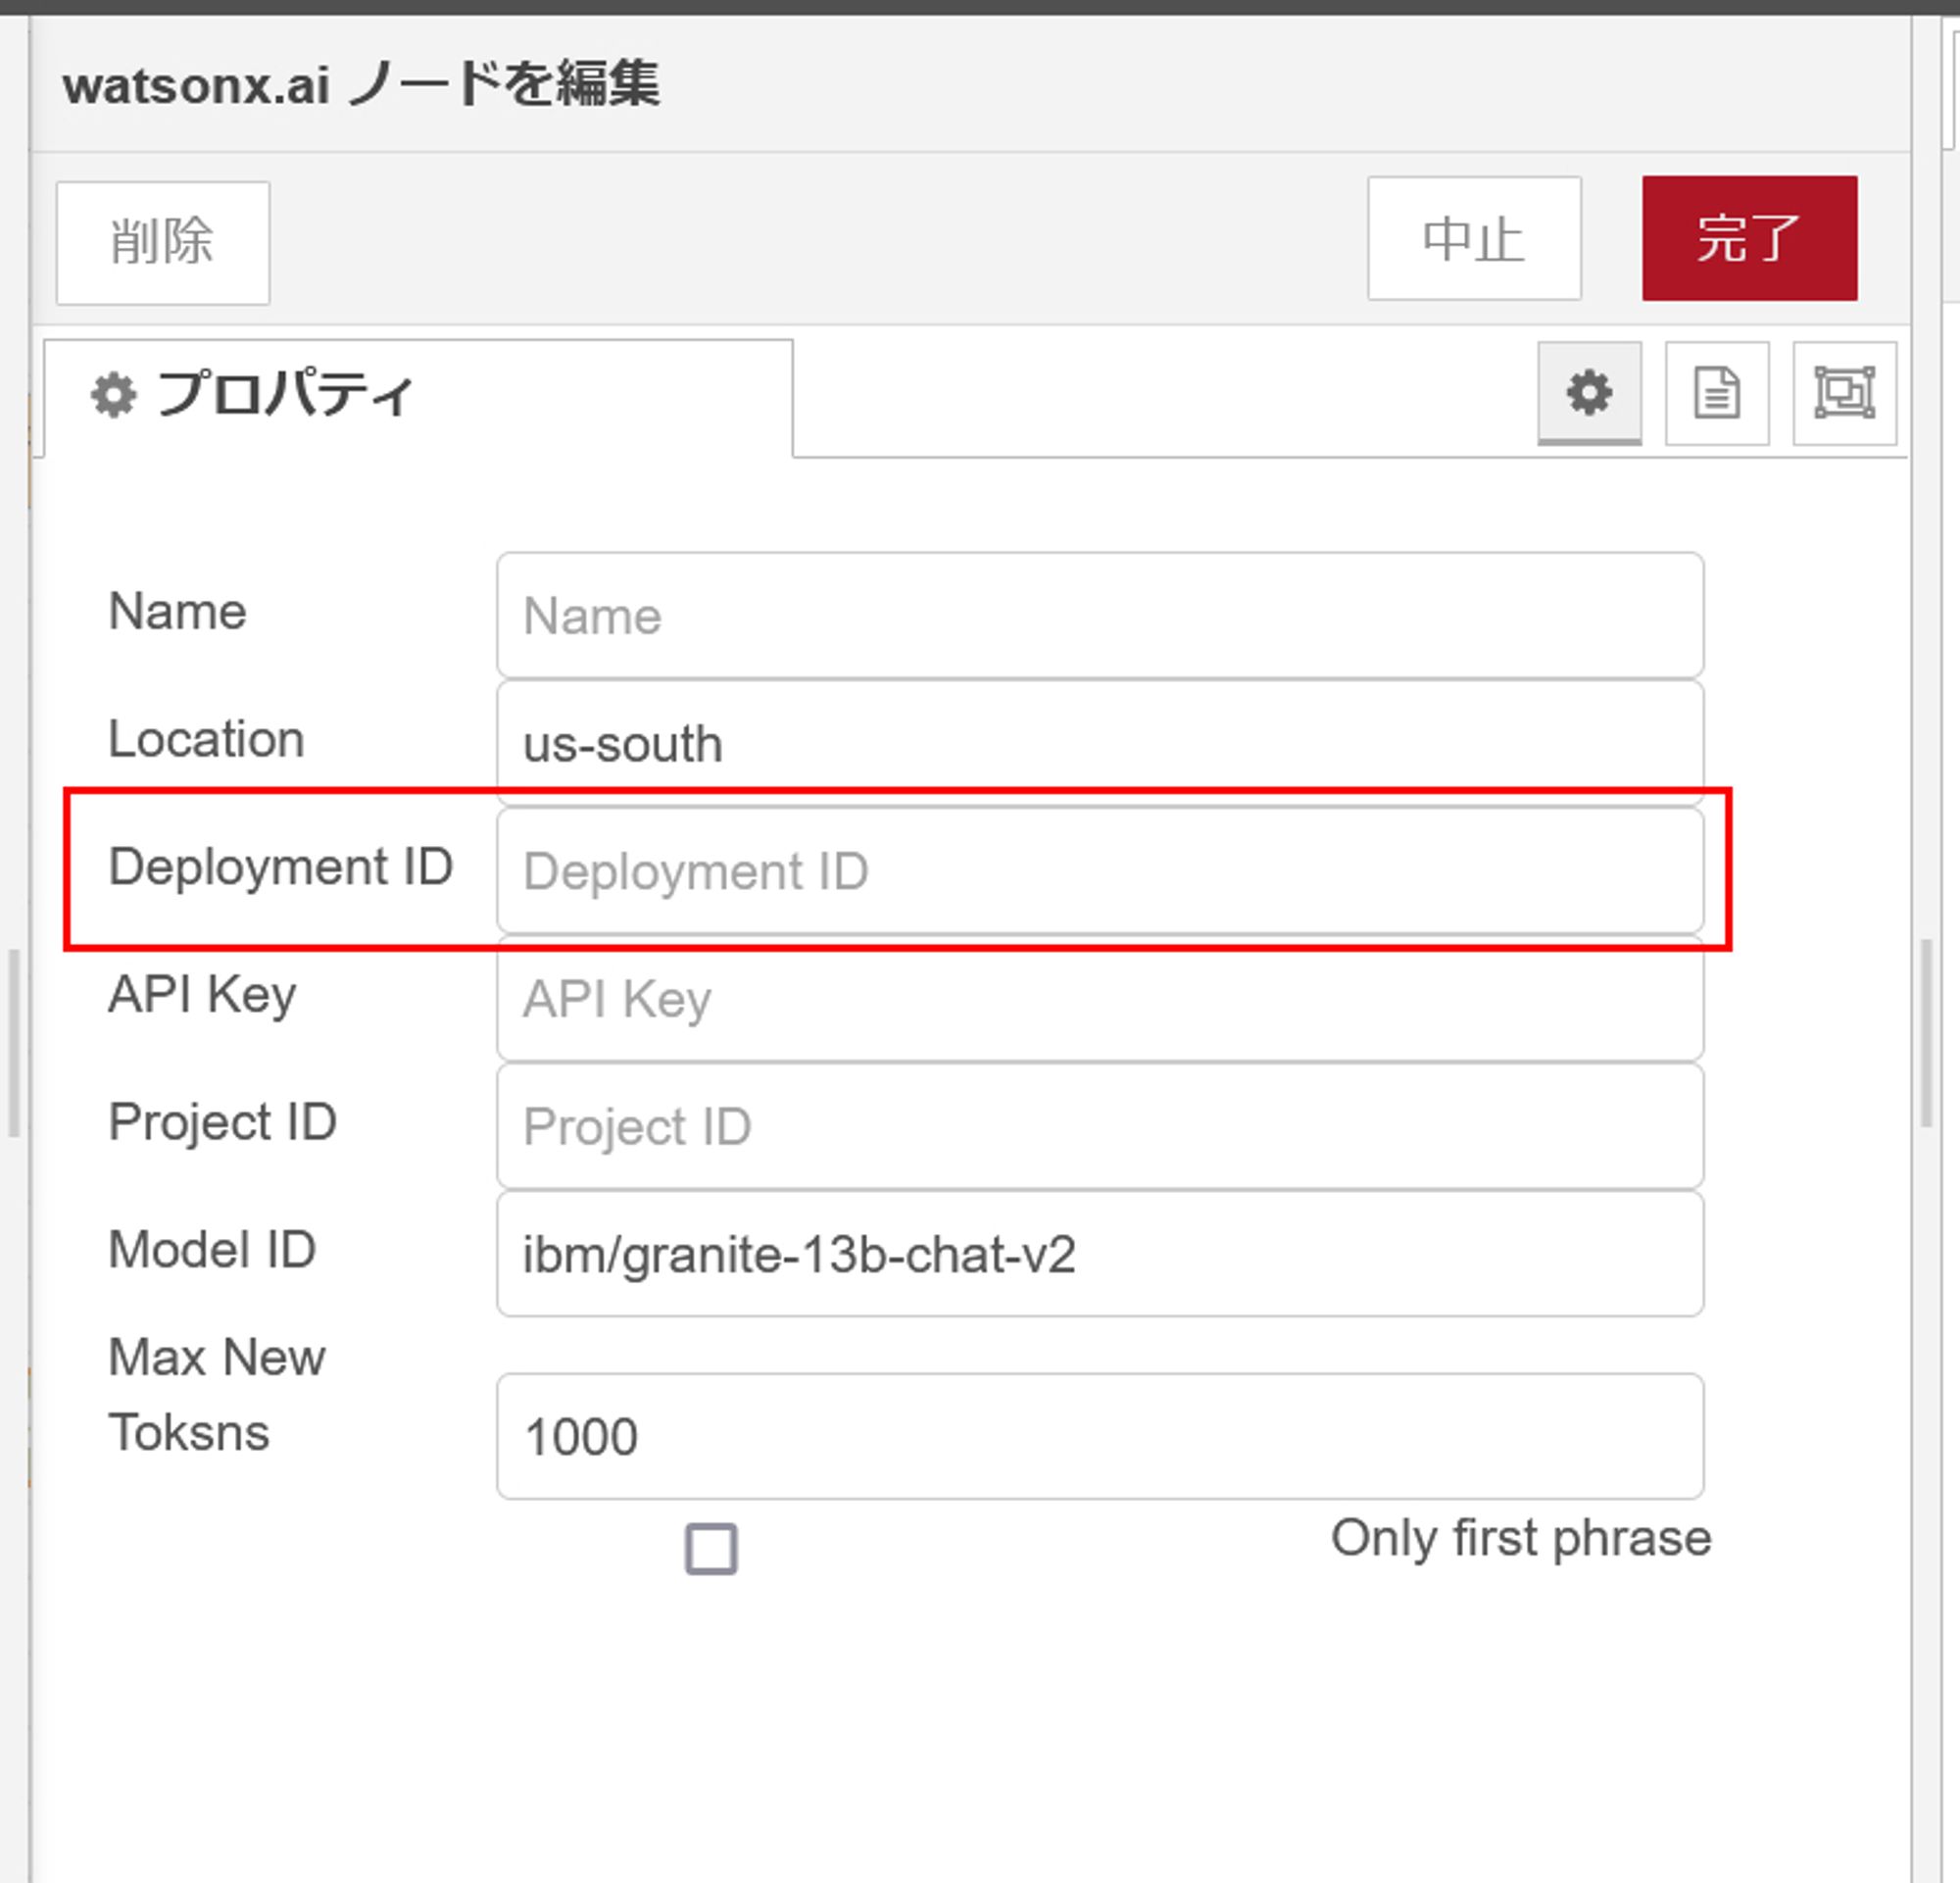
拙作の #NodeREDwatsonx.aiflows.nodered.org/node/node-re... このバージョンから LLM のチューニングに対応して、チューニング済み LLM のデプロイメント ID を指定することで Node-RED からも利用できるようにしています
Eu odeio NodeRed e esse demônio voltou pra me assombrar de novo
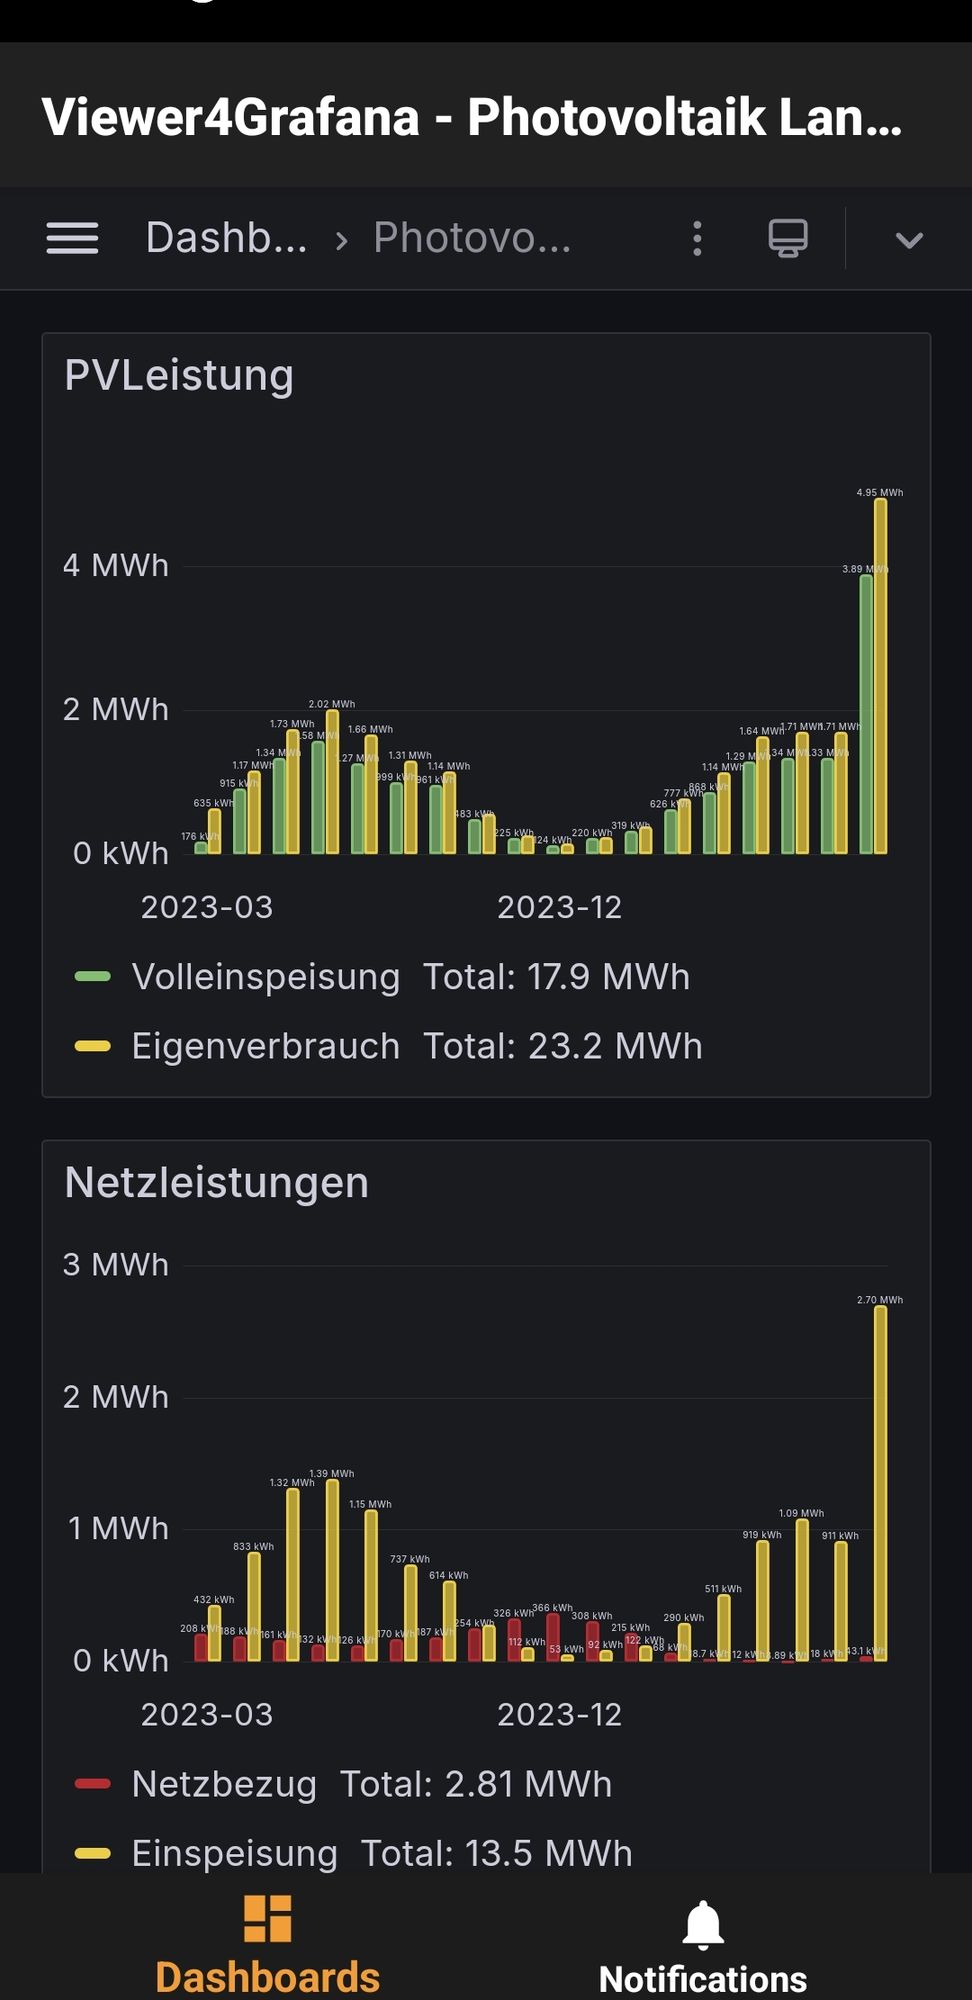
#pvbuddiea Wie man sieht passt meine Monatliche Auswertung immer noch nicht. Irgendwo im NodeRed muss noch ein Fehler sein... Zum kotzen, diesmal die simple SMA Auswertung
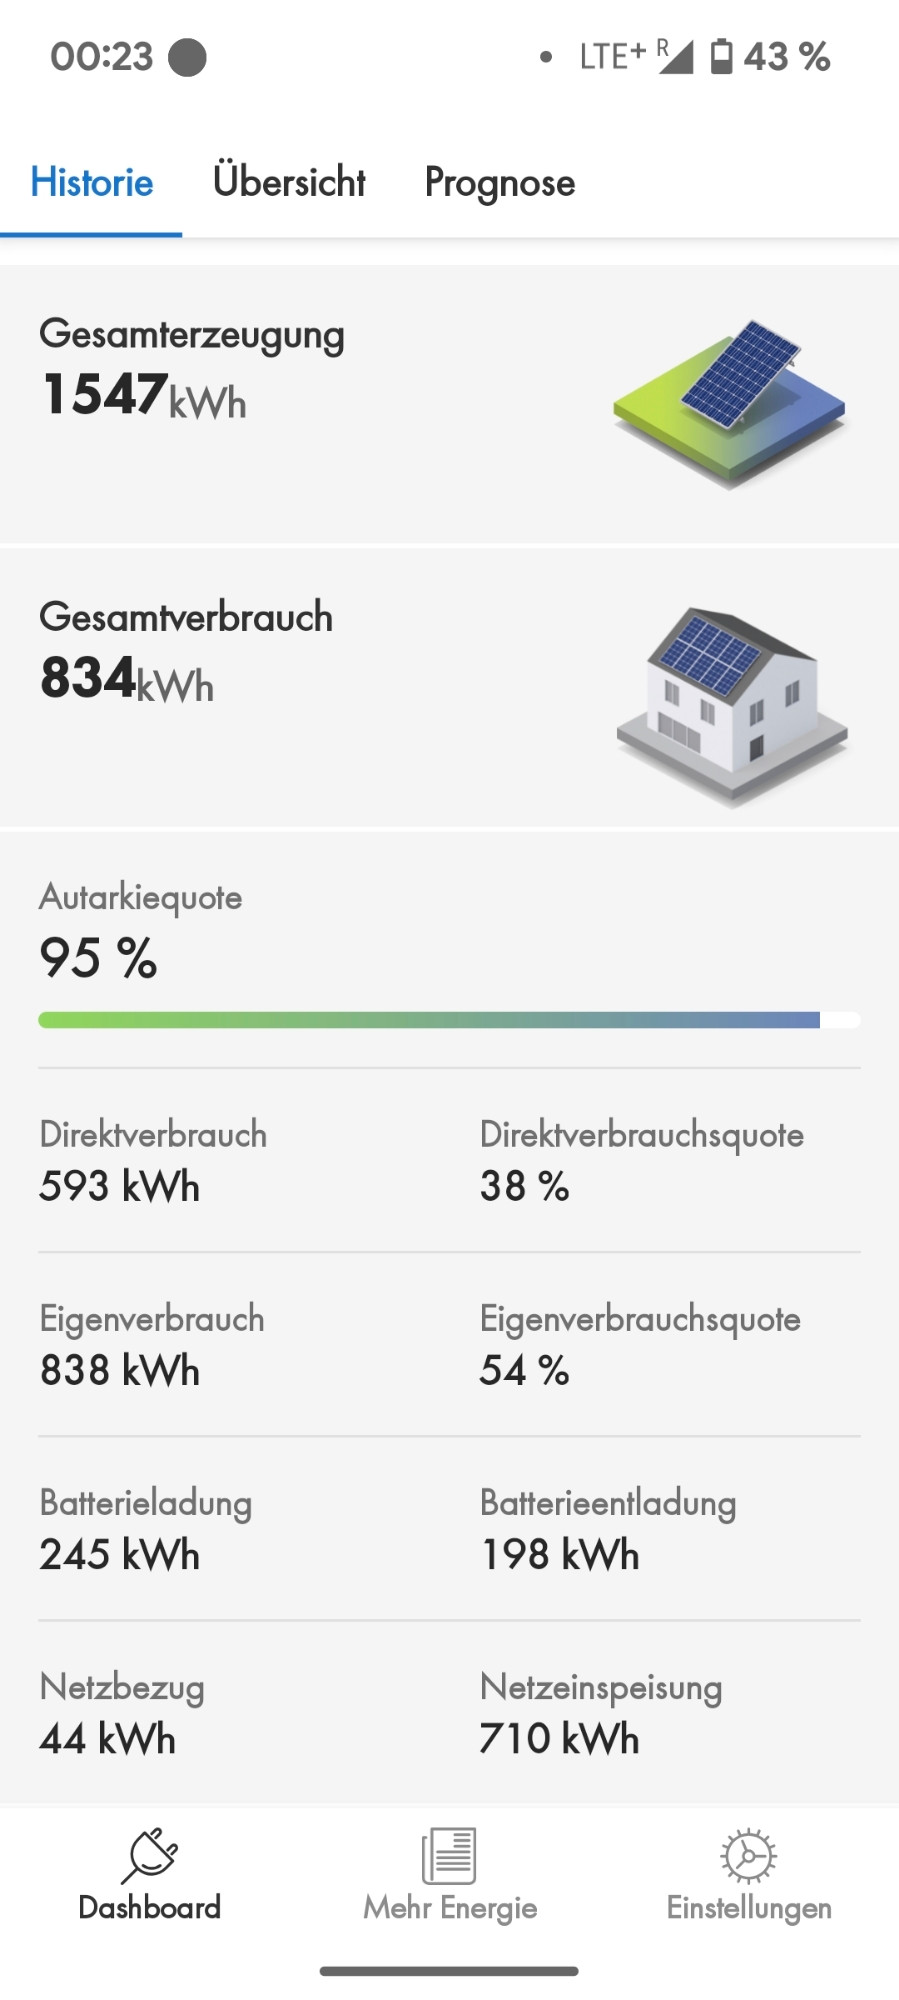
Mit MQTT, ModBusTCP oder per API nutze ich da wo #Smarthome vorhanden ist die Daten. Sieht man, wenn man den Stand der Zählerverteilung für PV begutachtet. Bei mir (Victron&Kaco) nutze ich MQTT und ModBusTCP um die Daten zu visualisieren (Edomi). RasPI m NodeRed/Grafana/oVPN/etc läuft parallel
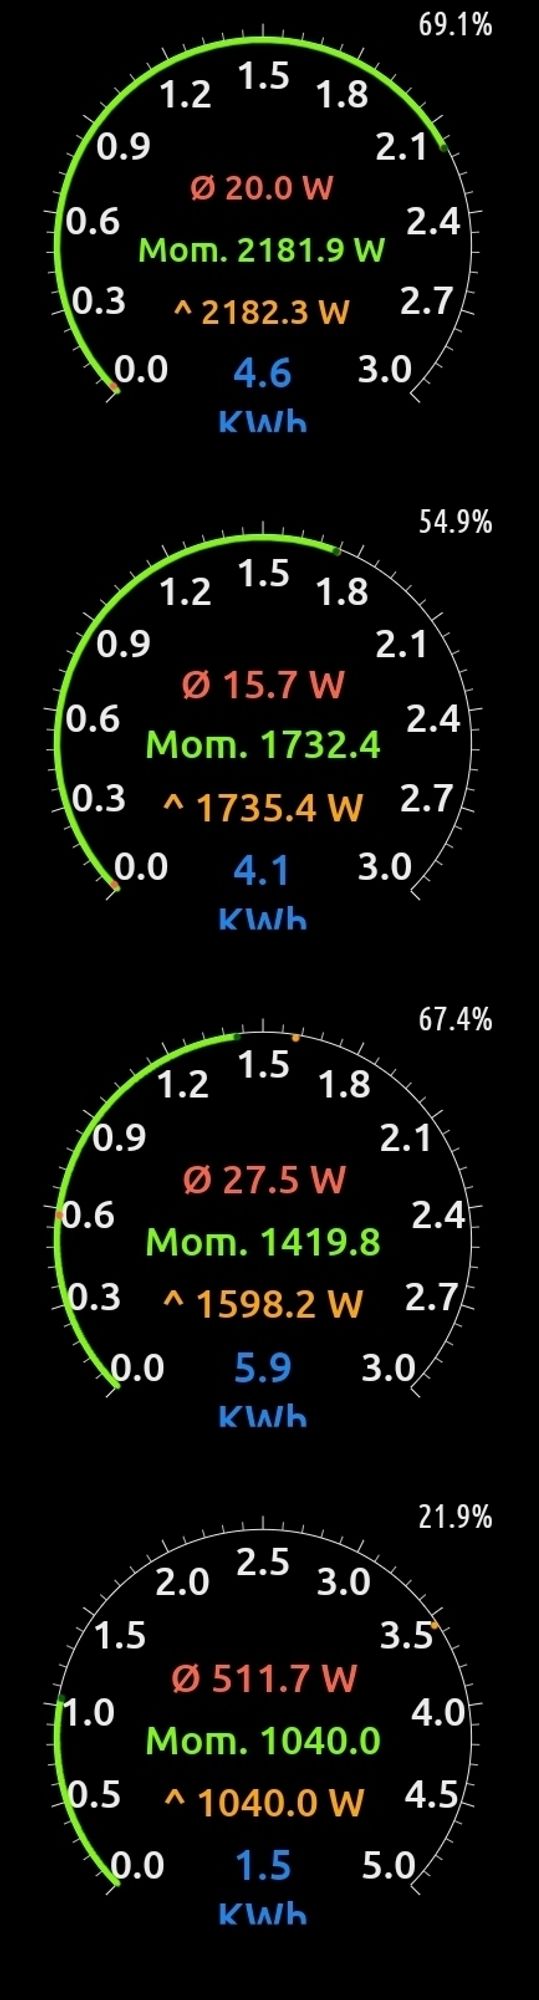
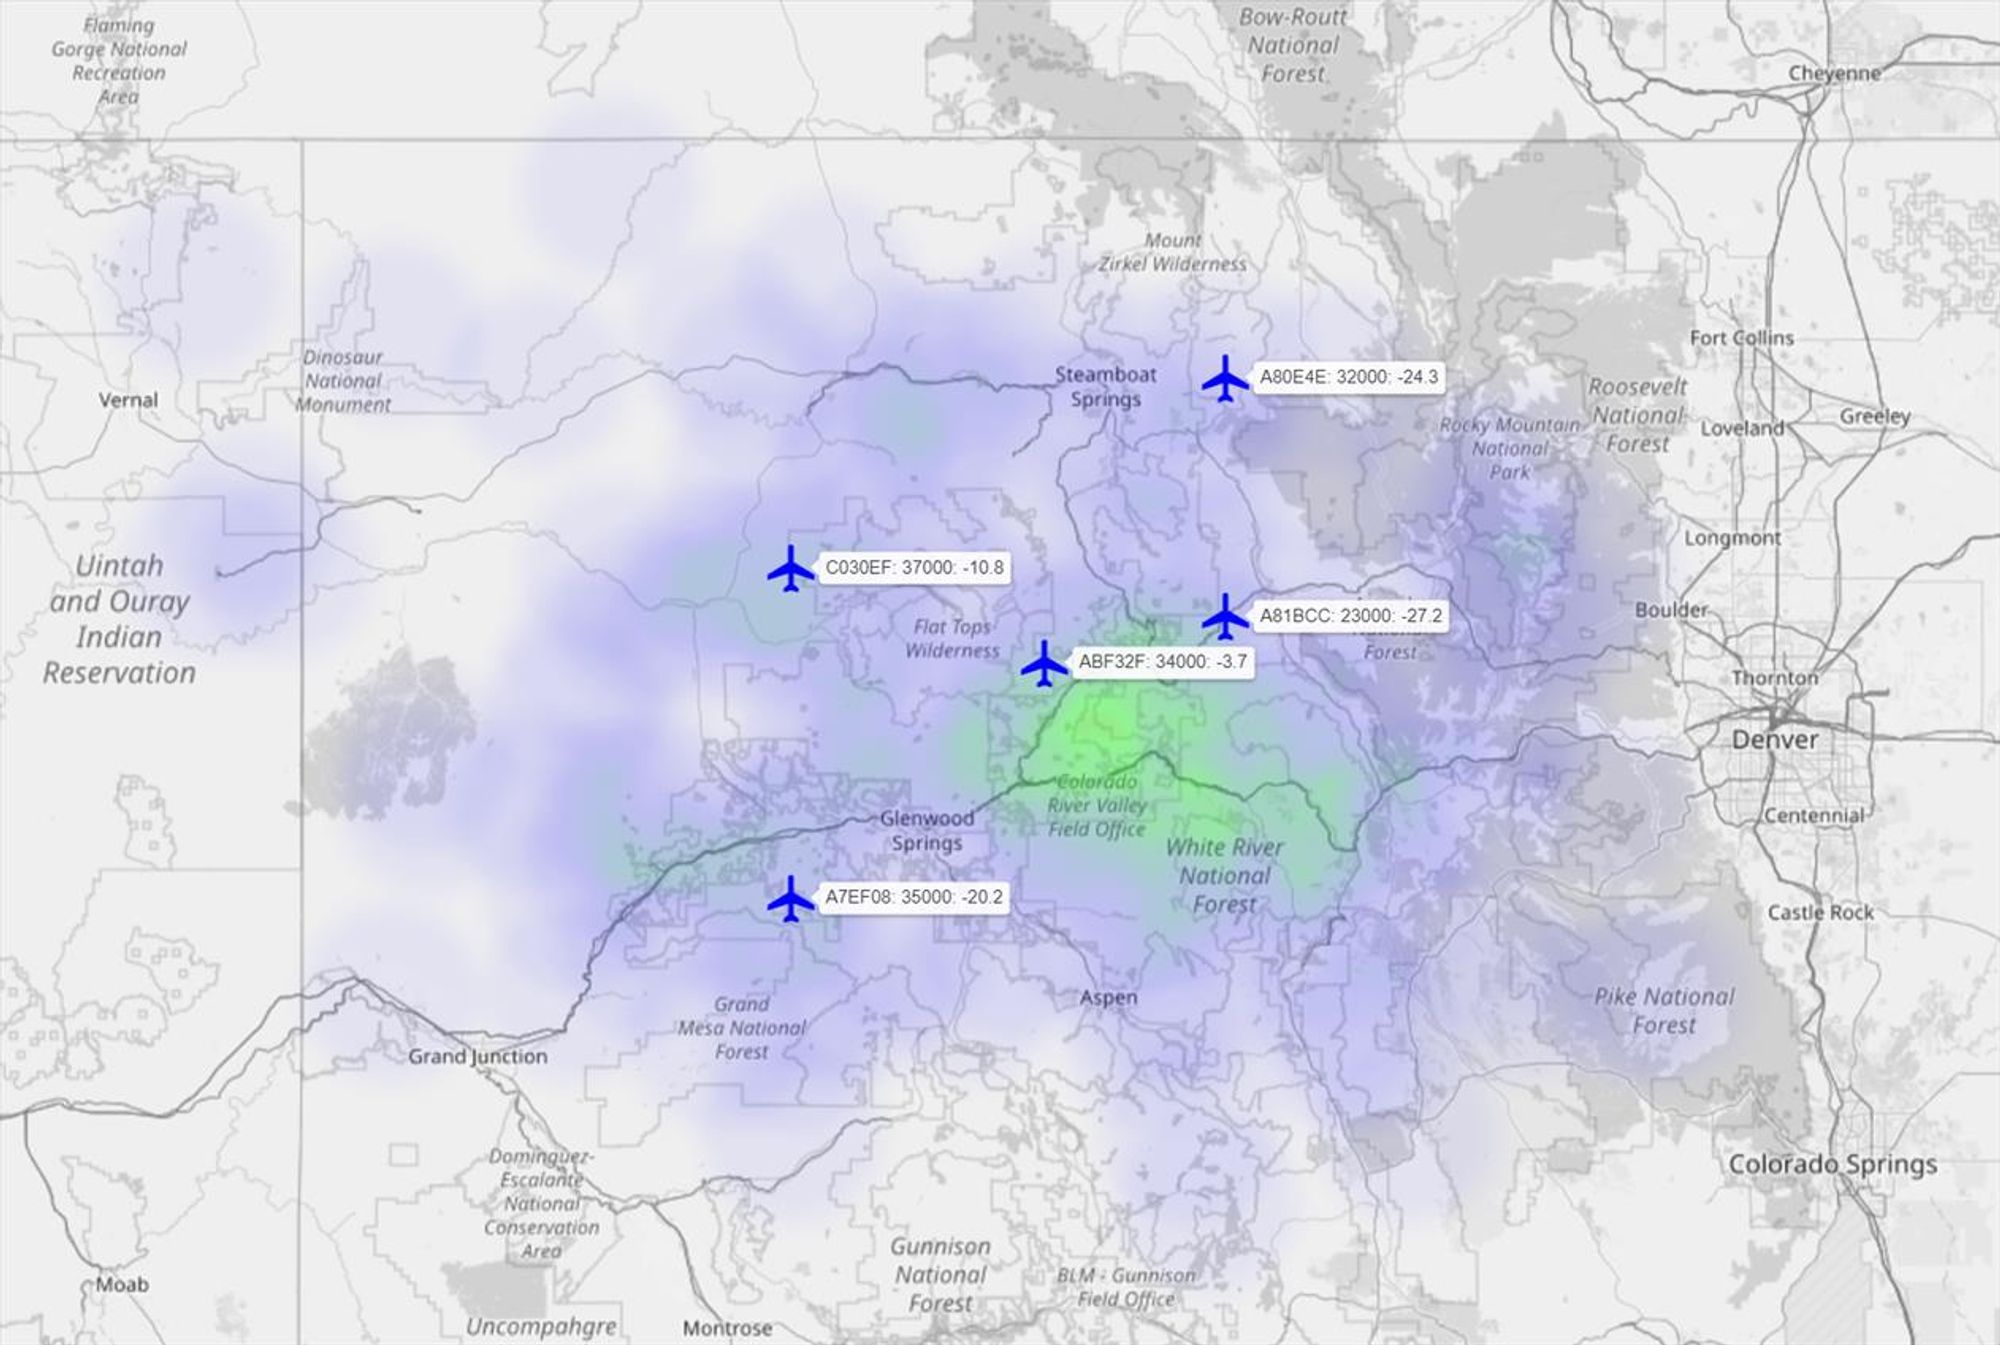
Looks cool. What are you using? Self programmed? Framework? For these graphs I am using NodeRed, much easier to handle in the end.