Been playing around w/ @observablehq for some spatial viz. I can’t quite figure out how to pass a bounding box to the domain argument of a projection. Goal is to select a county and have the county fill the entire viewport of the chart. Anyone got a solution? #rstats#quartopub#ObservablePlot
I played around with @observablehq 's #ObservableFramework#ObservablePlotyoutu.be/mg8pNBnMOcI

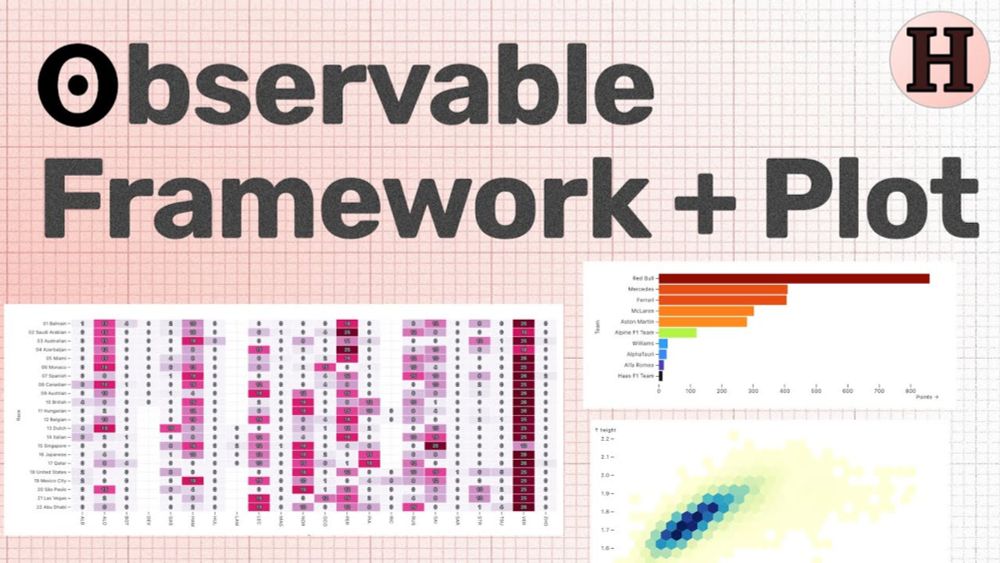
Building a F1 dashboard with Observable Framework and Observable Plot
SvelteKit Playlist: https://www.youtube.com/watch?v=iO4VUbQ6ua4&list=PLIyDDWd5rhaYwAiXQyonufcZgc_xOMtIdCode: https://github.com/phartenfeller/observable-fram...
Allison even wrote a post with code comparisons of #ggplot2#ObservablePlotobservablehq.com/@observableh...