The Trillium was told by the Ministry of Health that “no responsive records were located.” She’s responsive to someone but it ain’t you #ElectionsMatter#ONpoli#SavePublicHealthcarewww.thetrillium.ca/news/health/...
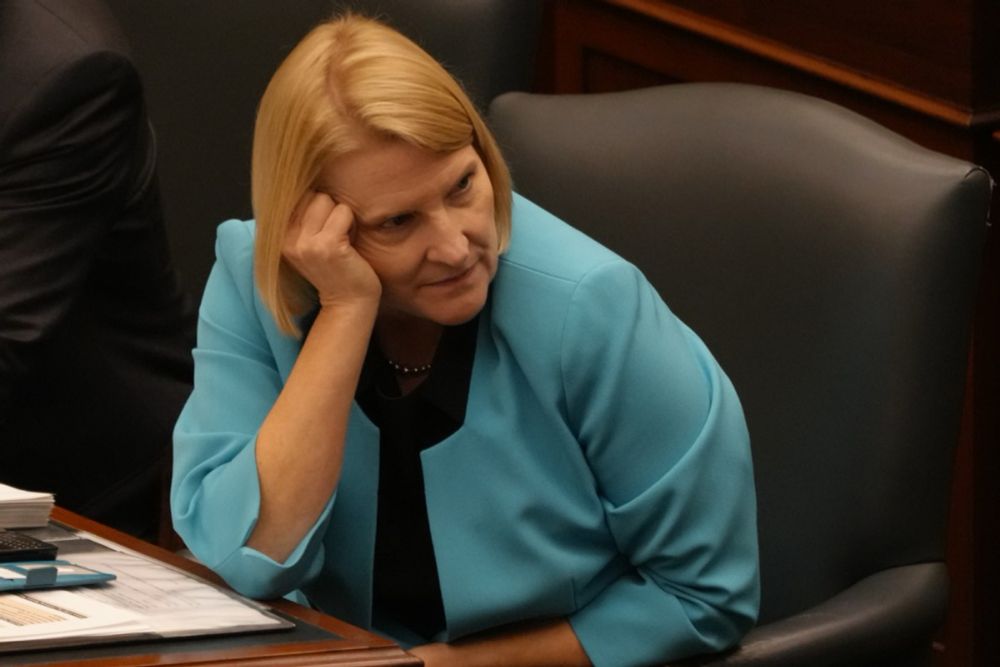
Minister Sylvia Jones said her staff 'are implementing' the repository for submissions from third parties that could influence government policy
Strange, that. "Six months after Premier Doug Ford’s cabinet members’ offices were told to use a system to track lobbyists’ potentially influential submissions, Ontario’s health minister’s staff had yet to add a single document to it, according to the ministry." #OnHealth#OnPoli

Minister Sylvia Jones said her staff 'are implementing' the repository for submissions from third parties that could influence government policy
This sounds exactly like 6 years of Rob Ford in Ontario. #onpoli
You did ask for it ... Over the past 15 years, North Carolina lawmakers have rejected limits on construction (...); weakened protections for wetlands; and slowed the adoption of updated building codes"
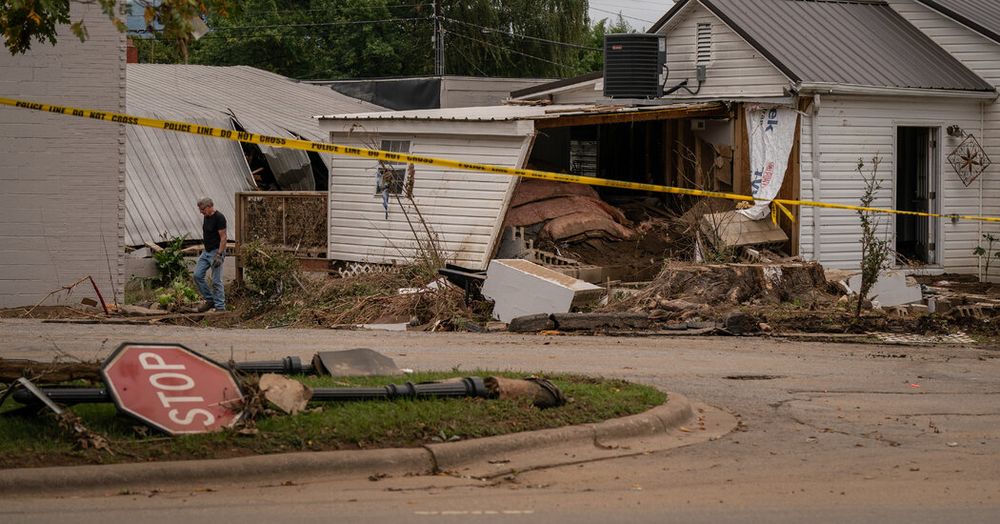
Under pressure to control housing costs, Republican lawmakers rejected standards meant to protect against disasters, experts say.
Thanks Councillors Colle & McKelvie for this motion calling on Doug Ford to support high speed rail instead of wasting billions on tunnelling the 401. However, we need another motion to oppose Ford's anti bike lane proposal. #BikeTO#TOpoli#ONpolisecure.toronto.ca/council/agen...


Imagine making Doug Ford look like a sane Conservative. 🤯 #ONpoli
Can't imagine Doug Ford's government just making up attendance numbers to justify pillaging Ontario Place to give it away to a big spa company. #onpoliwww.cbc.ca/news/canada/...
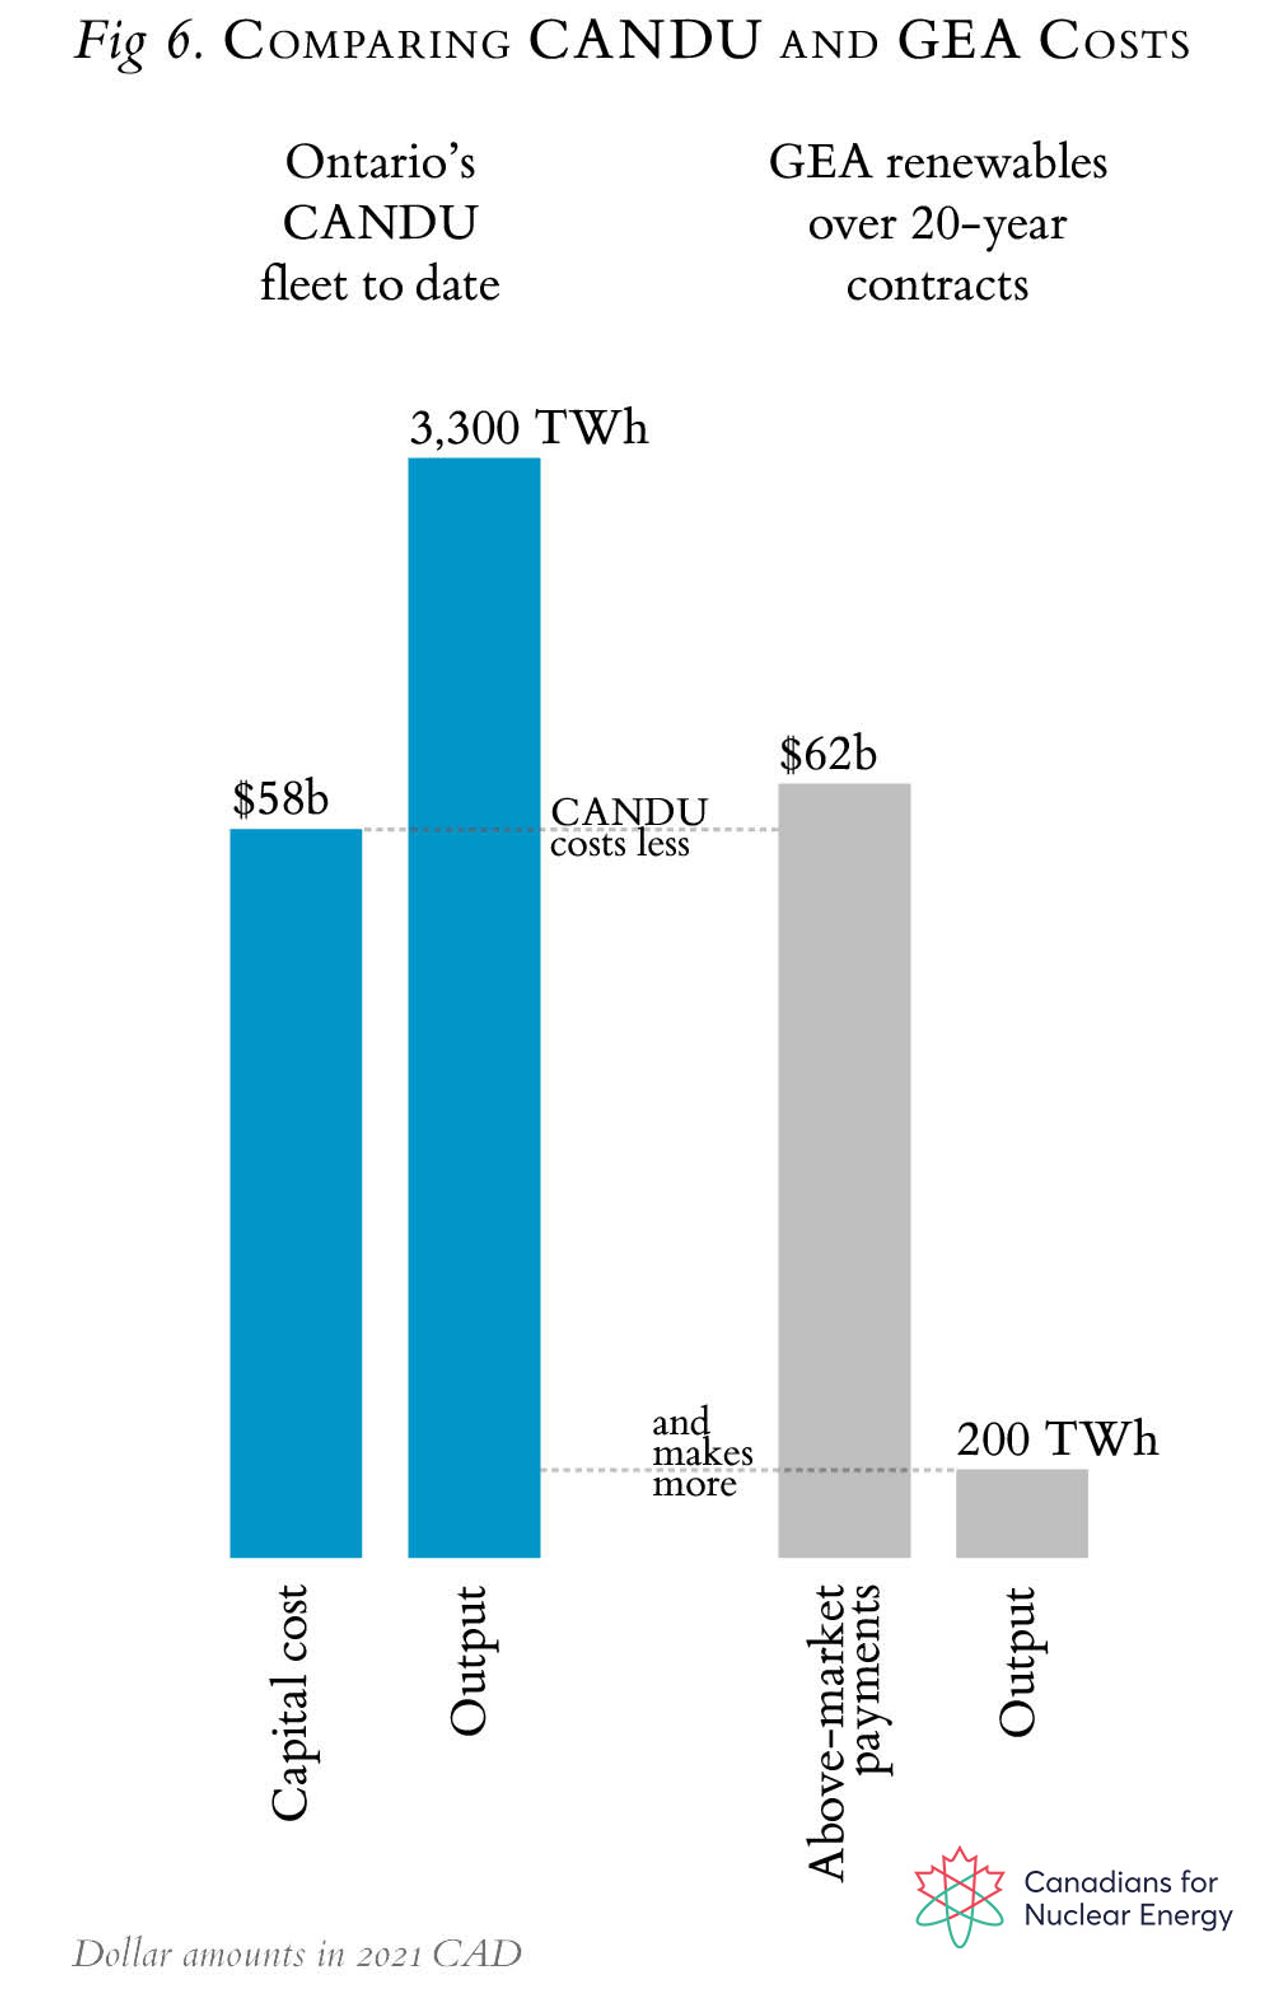
💡 Ontario’s CANDU nuclear fleet has generated 3,300 TWh of clean power for $58B, while GEA renewables will cost $62B for just 200 TWh. 🤯 CANDU = more power for less cost 🔋⚡️ Time to rethink energy priorities! #NuclearEnergy#CleanEnergy#CANDU#EnergyPolicy#ONPoli