
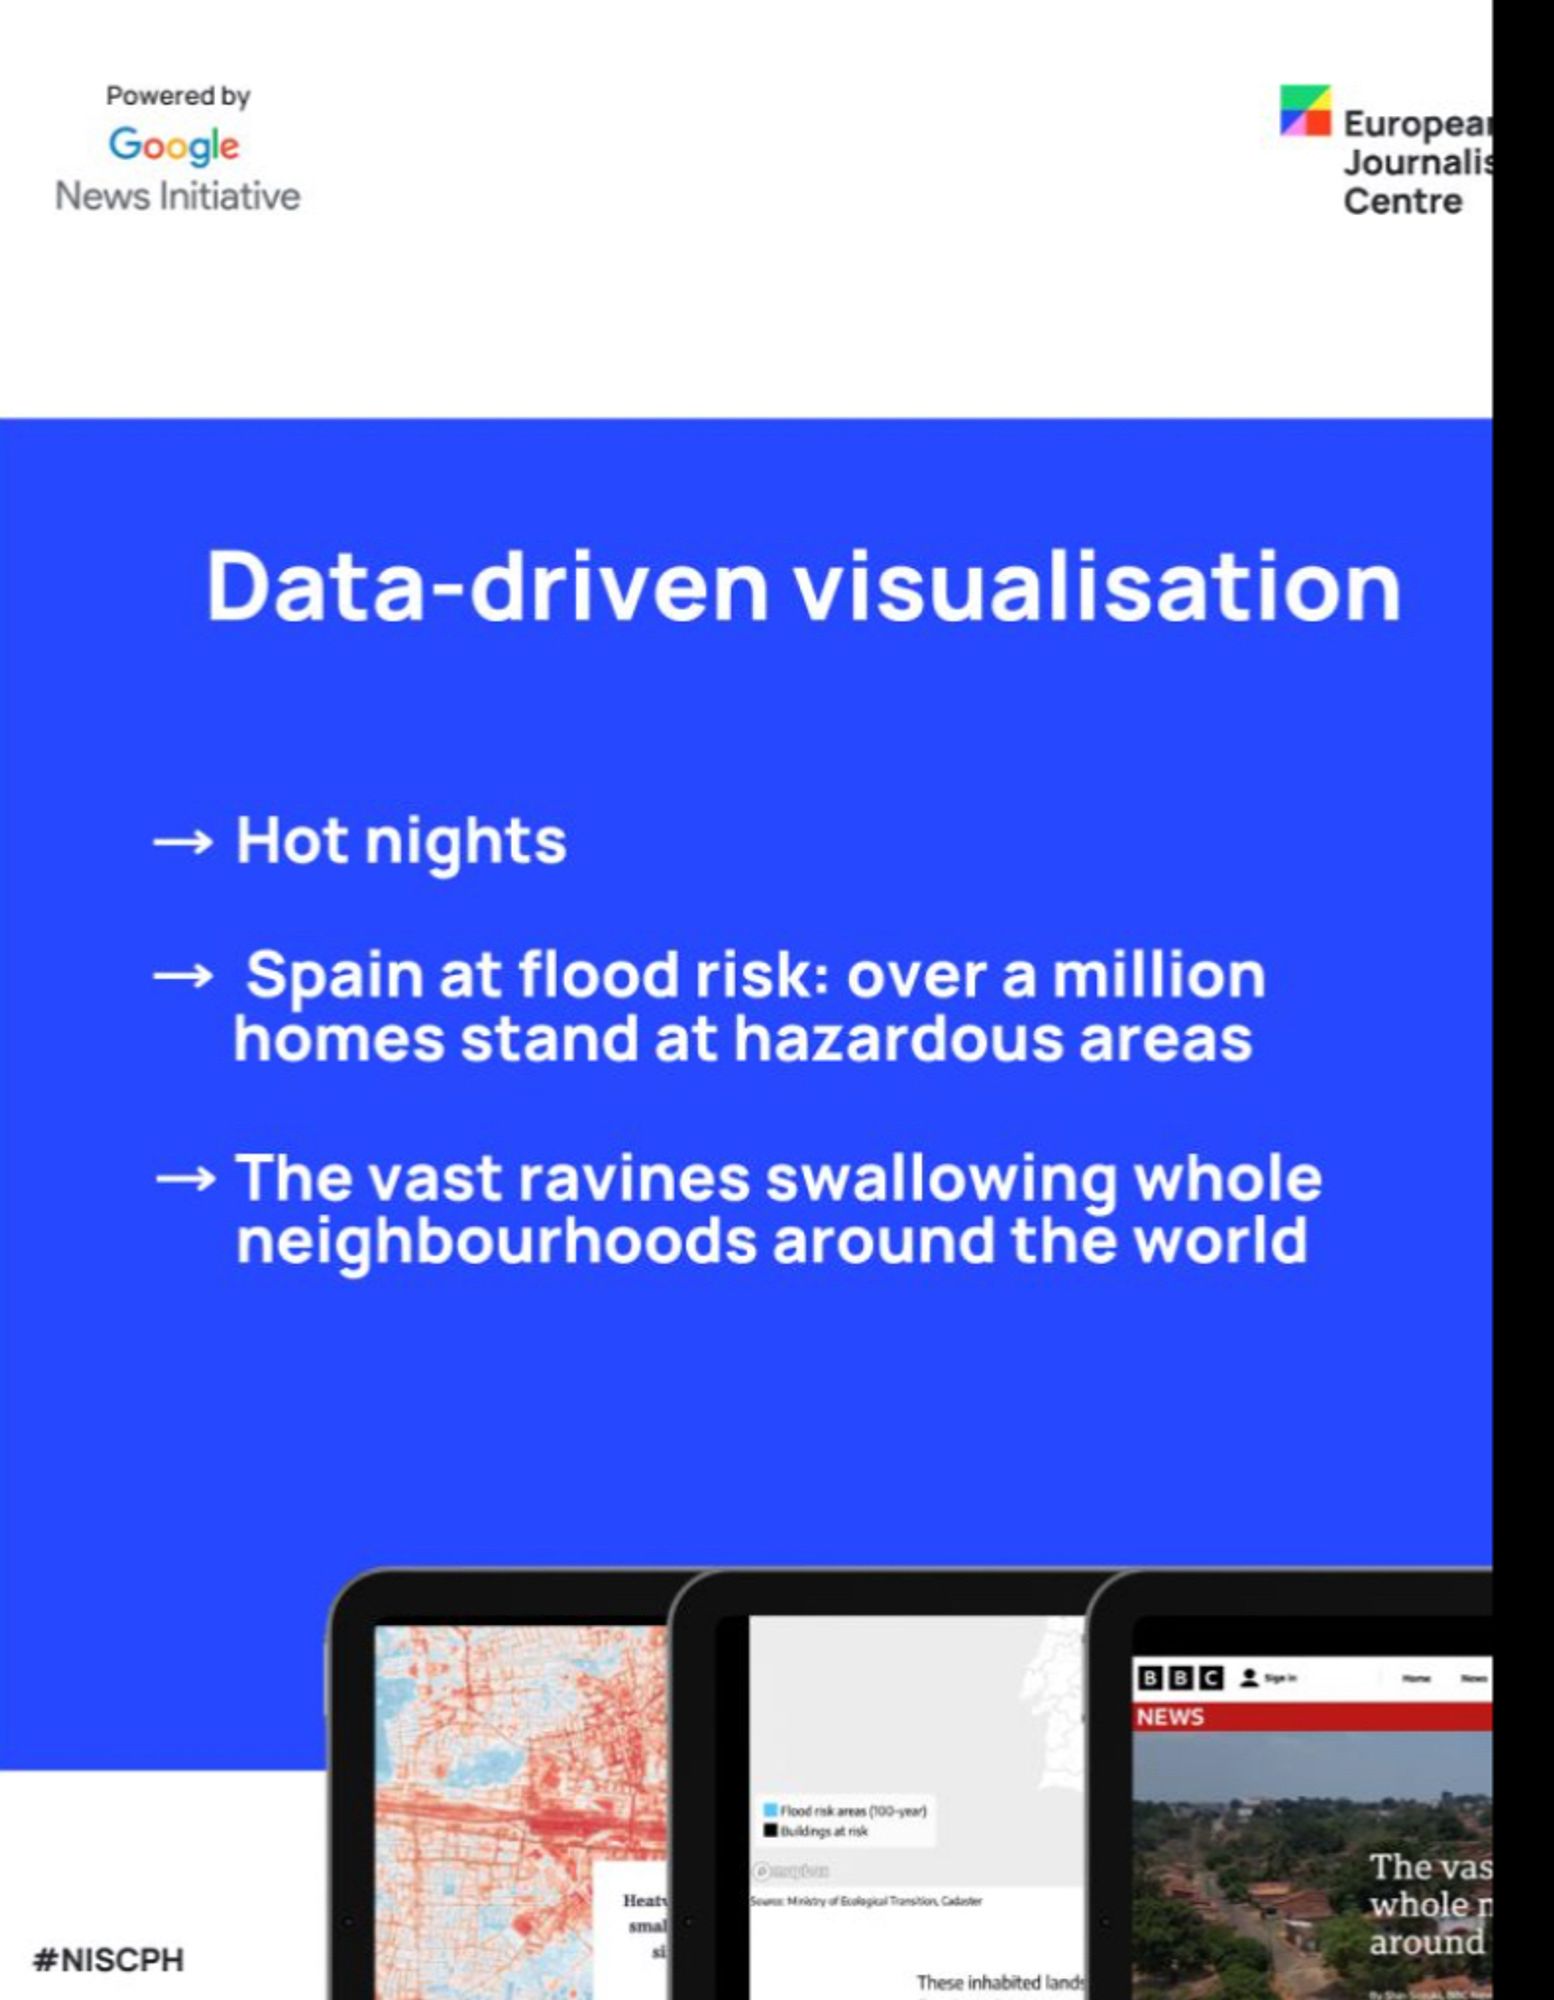
Muito orgulhoso de ver o projeto das voçorocas como um dos selecionados do Climate Award do European Journalism Centre na categoria data-driven visualization! Grande mérito de Carol Olona, Caroline Souza e Daniel Arce-Lopez

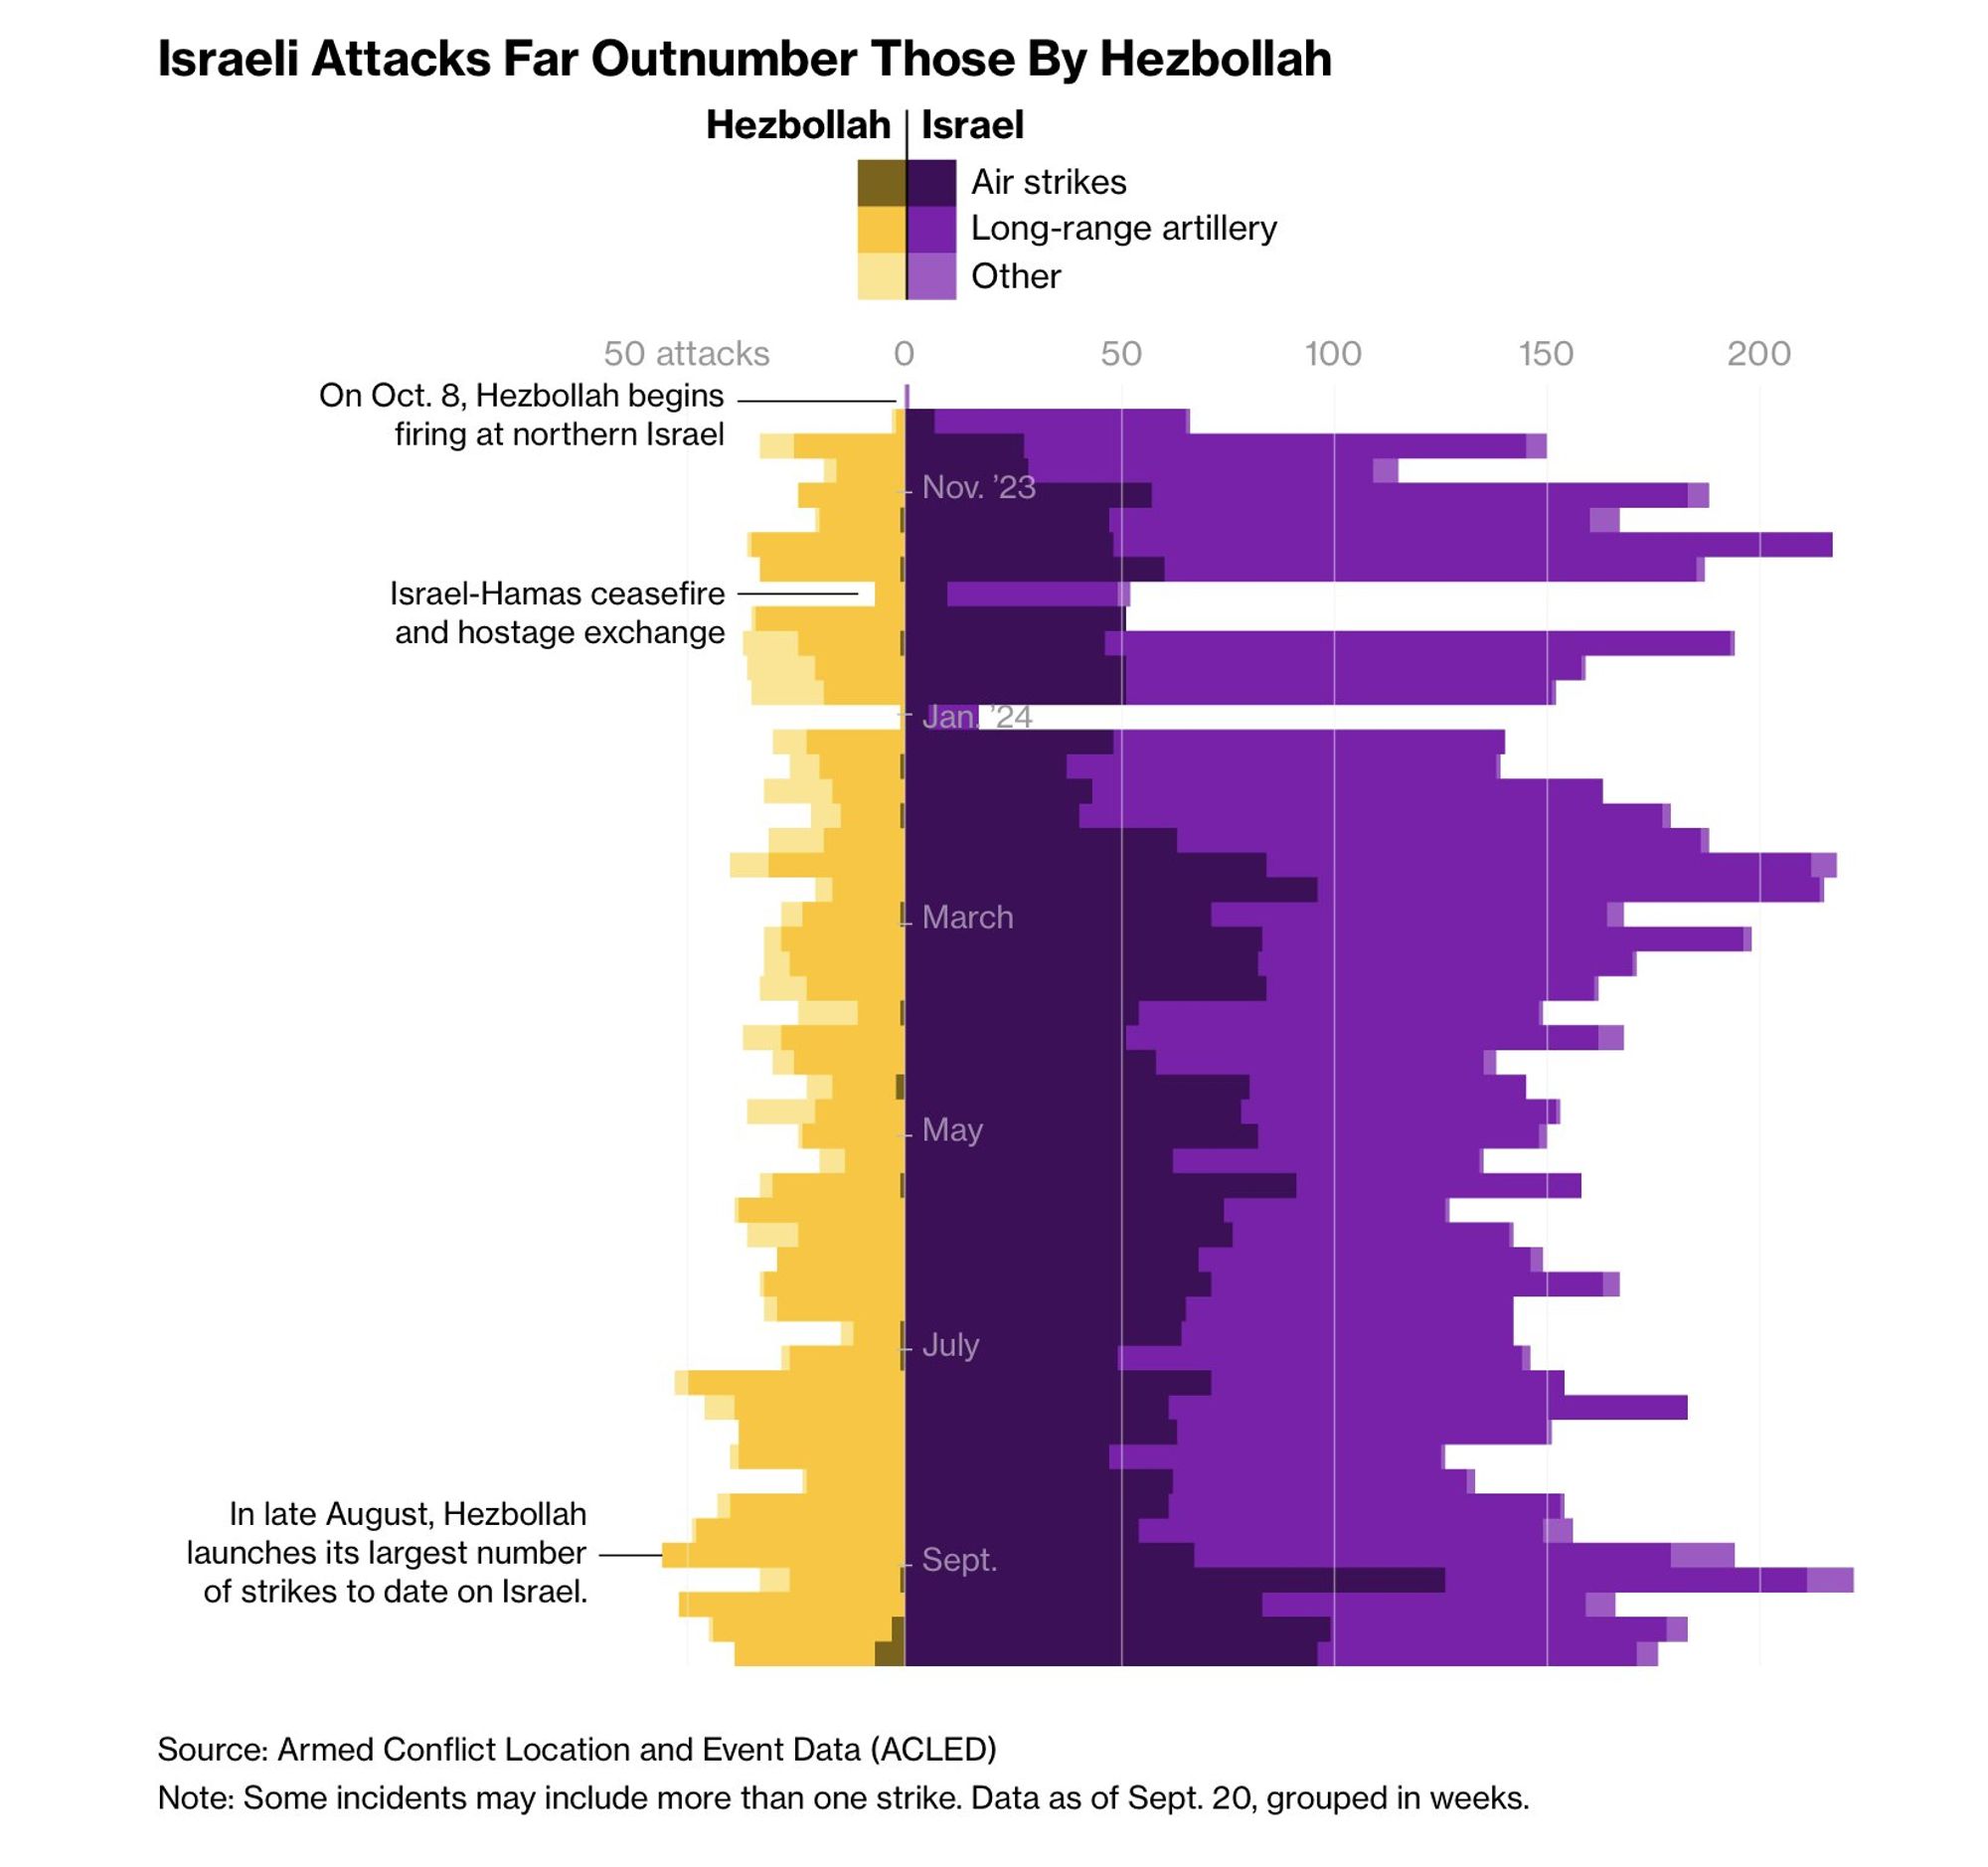
Incredible Bloomberg data visualization that clearly shows what’s actually going on between Israel and Lebanon. First, despite all the talk of the threat of Hezbollah rockets hitting Israel, it’s actually Israel that’s consistently firing far more rockets over the border. Source: acleddata.com
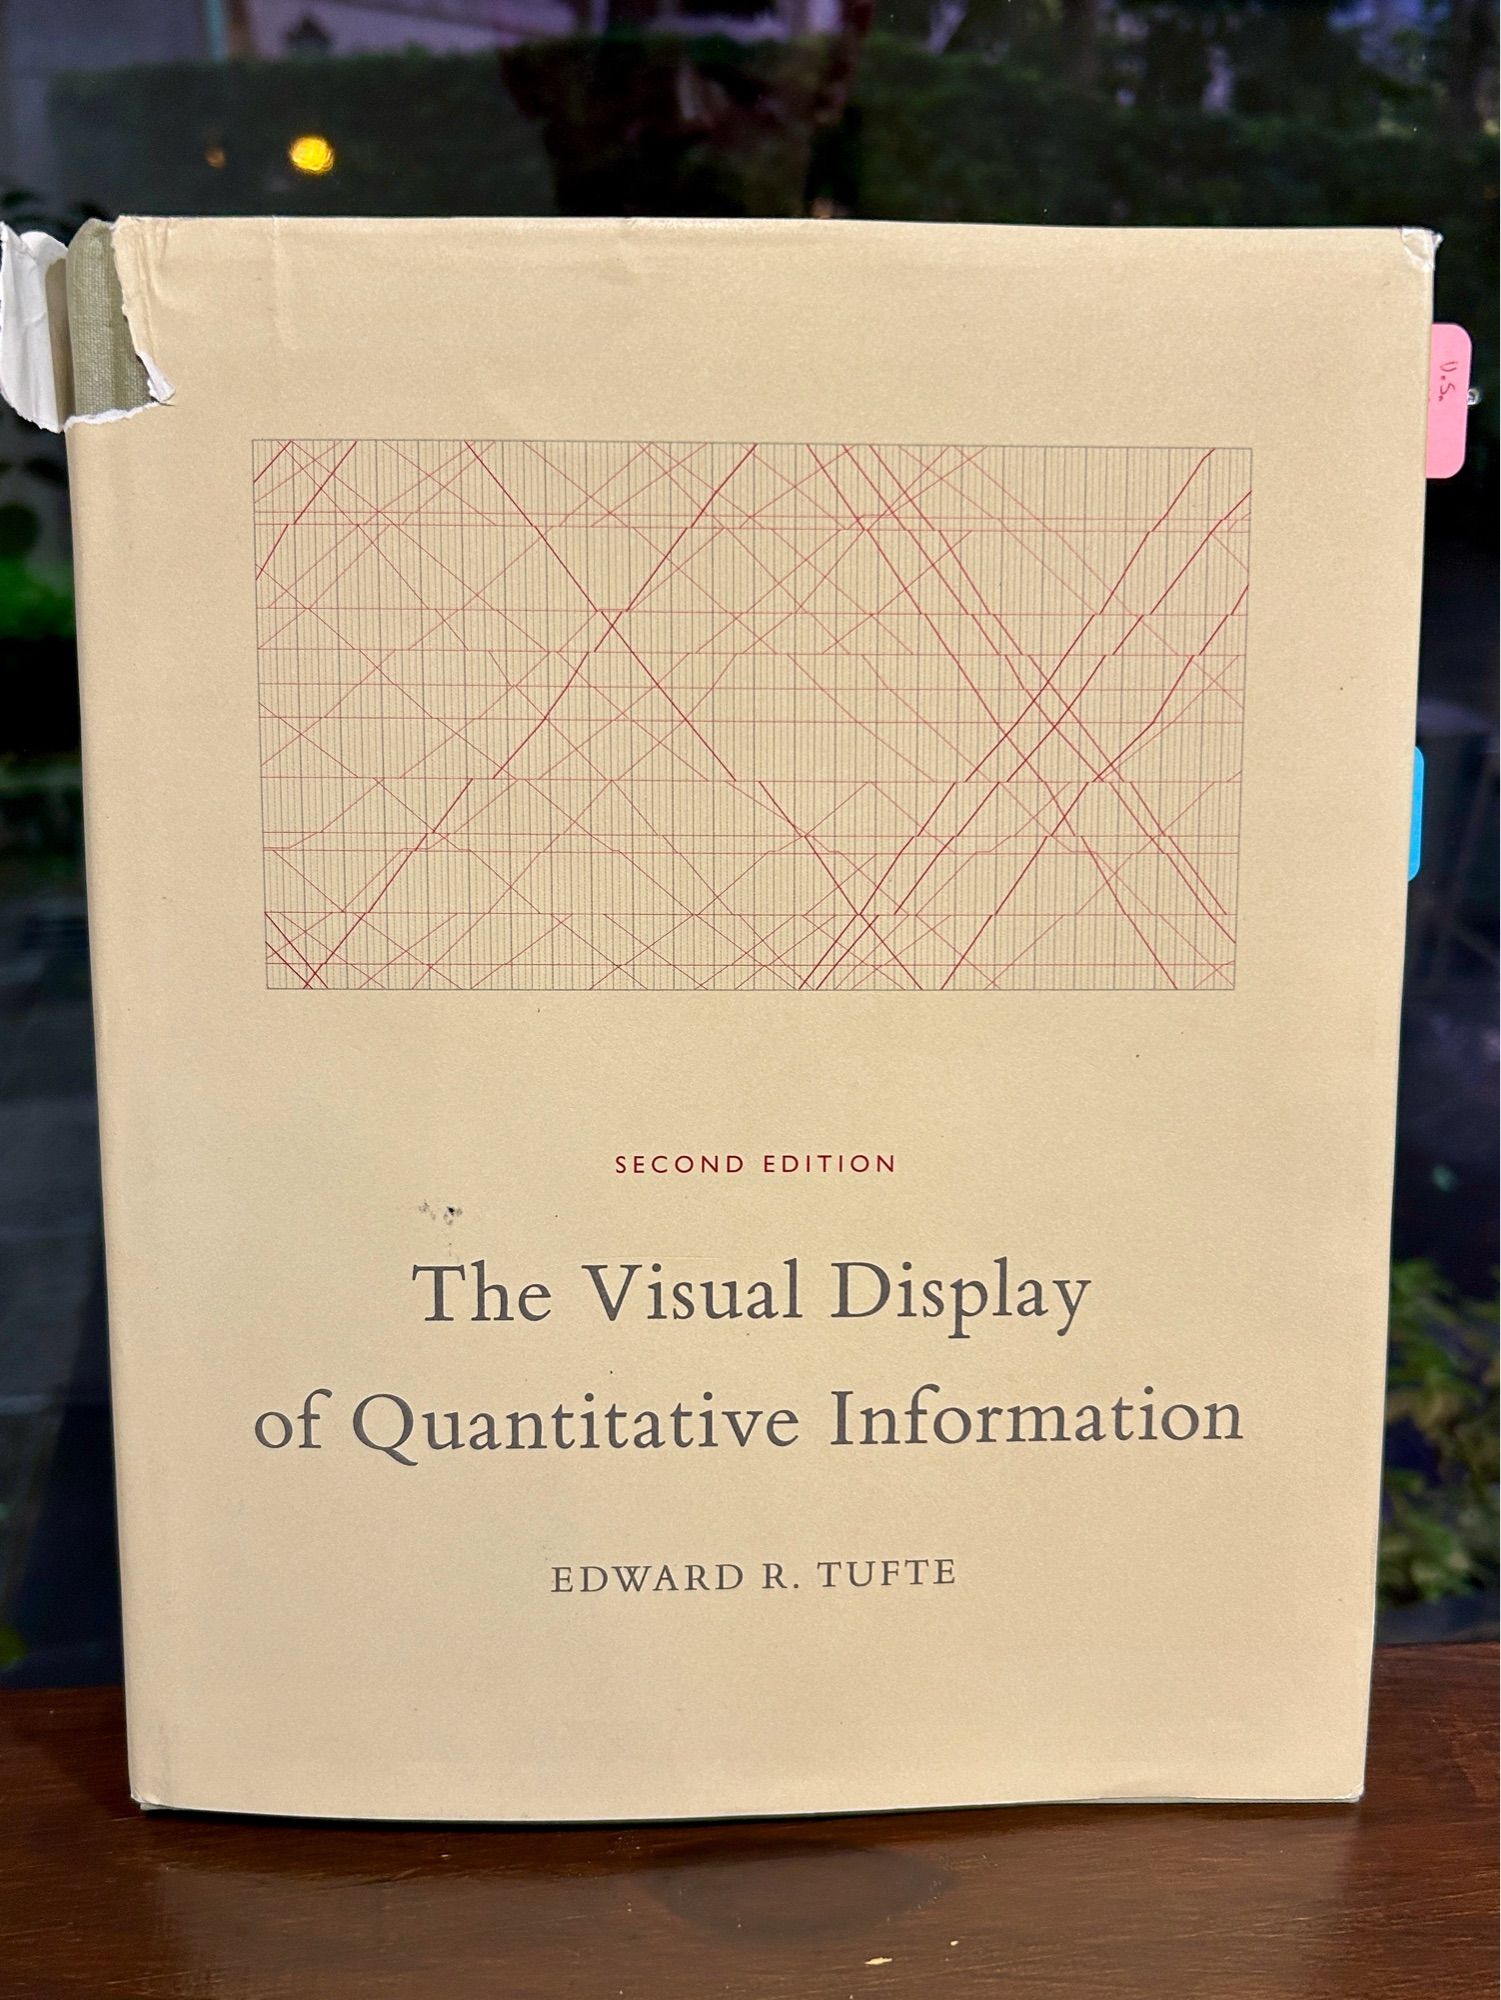
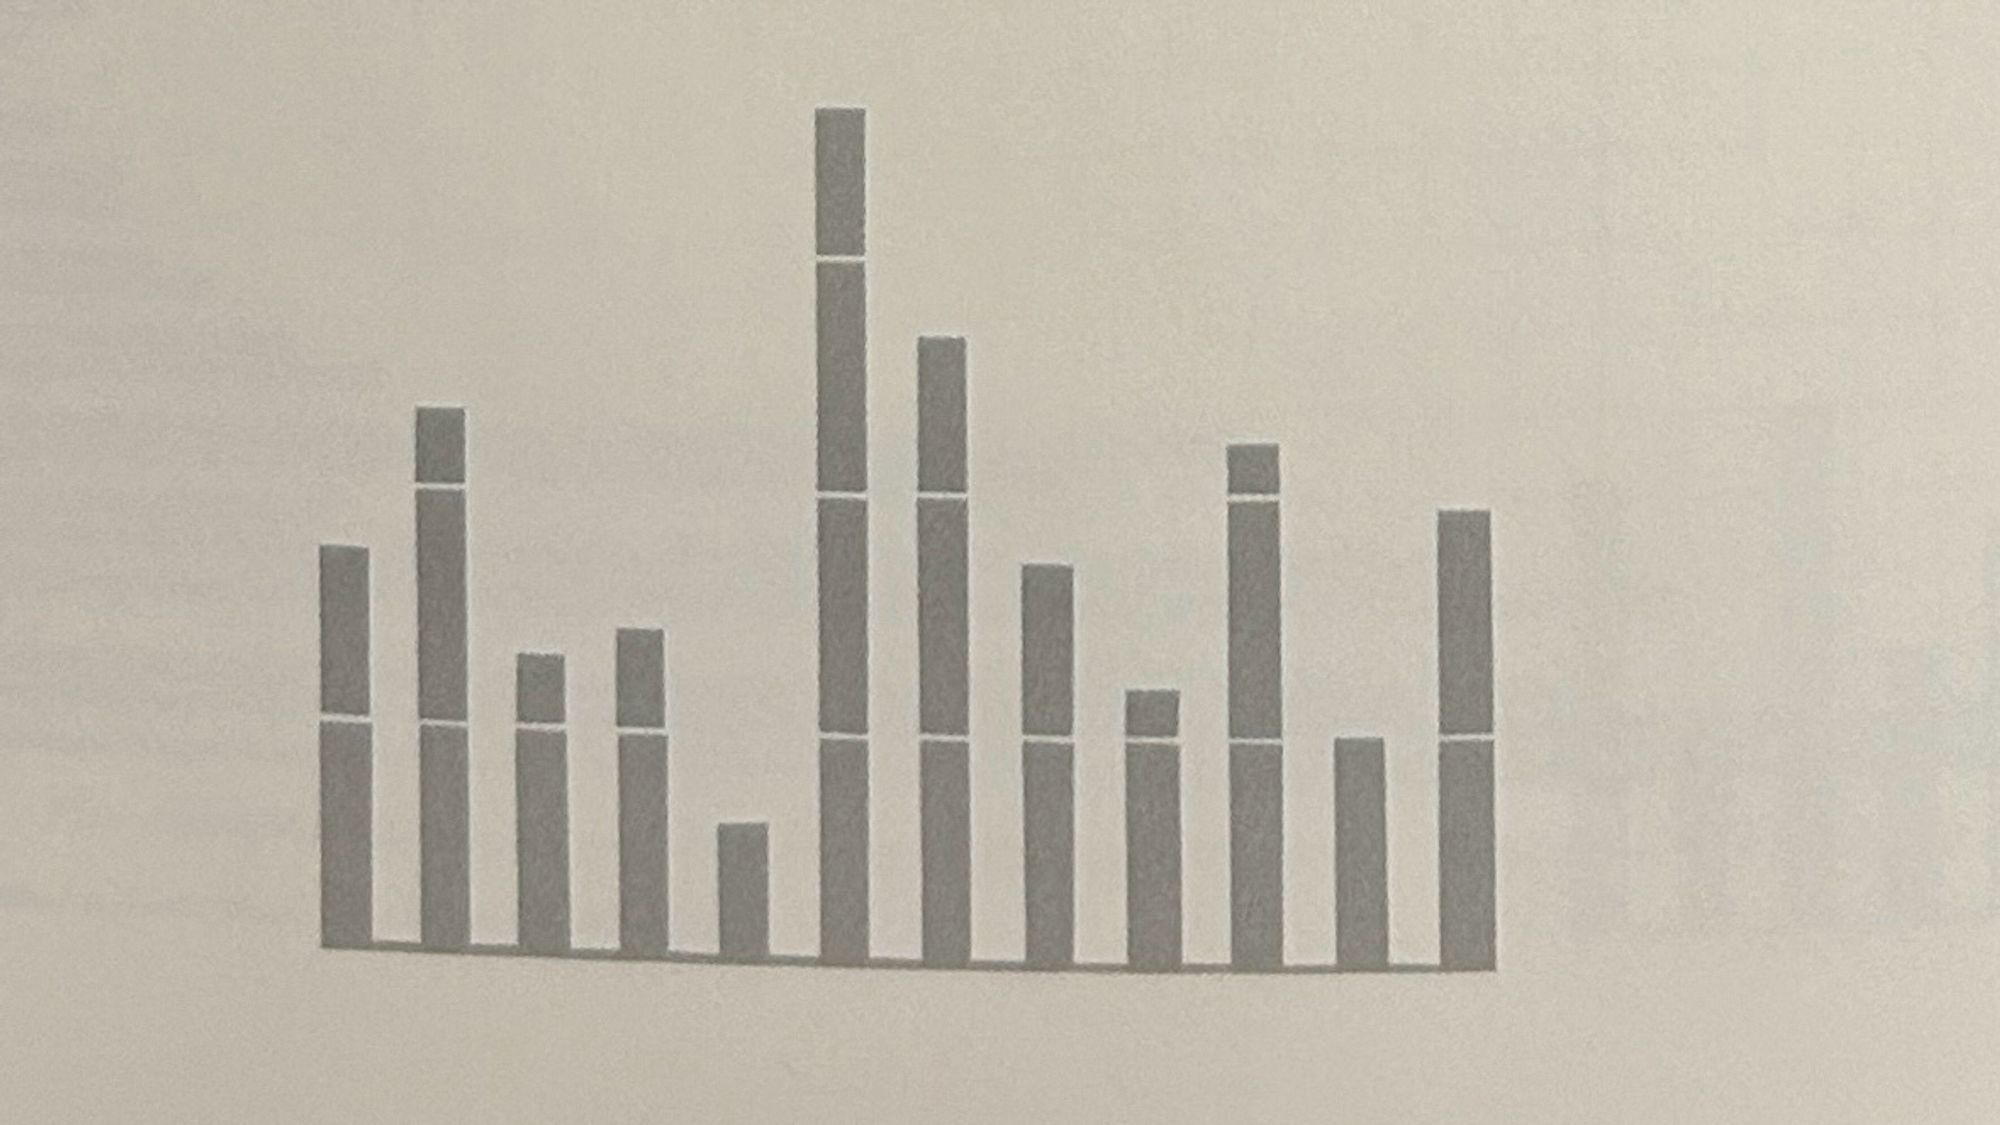
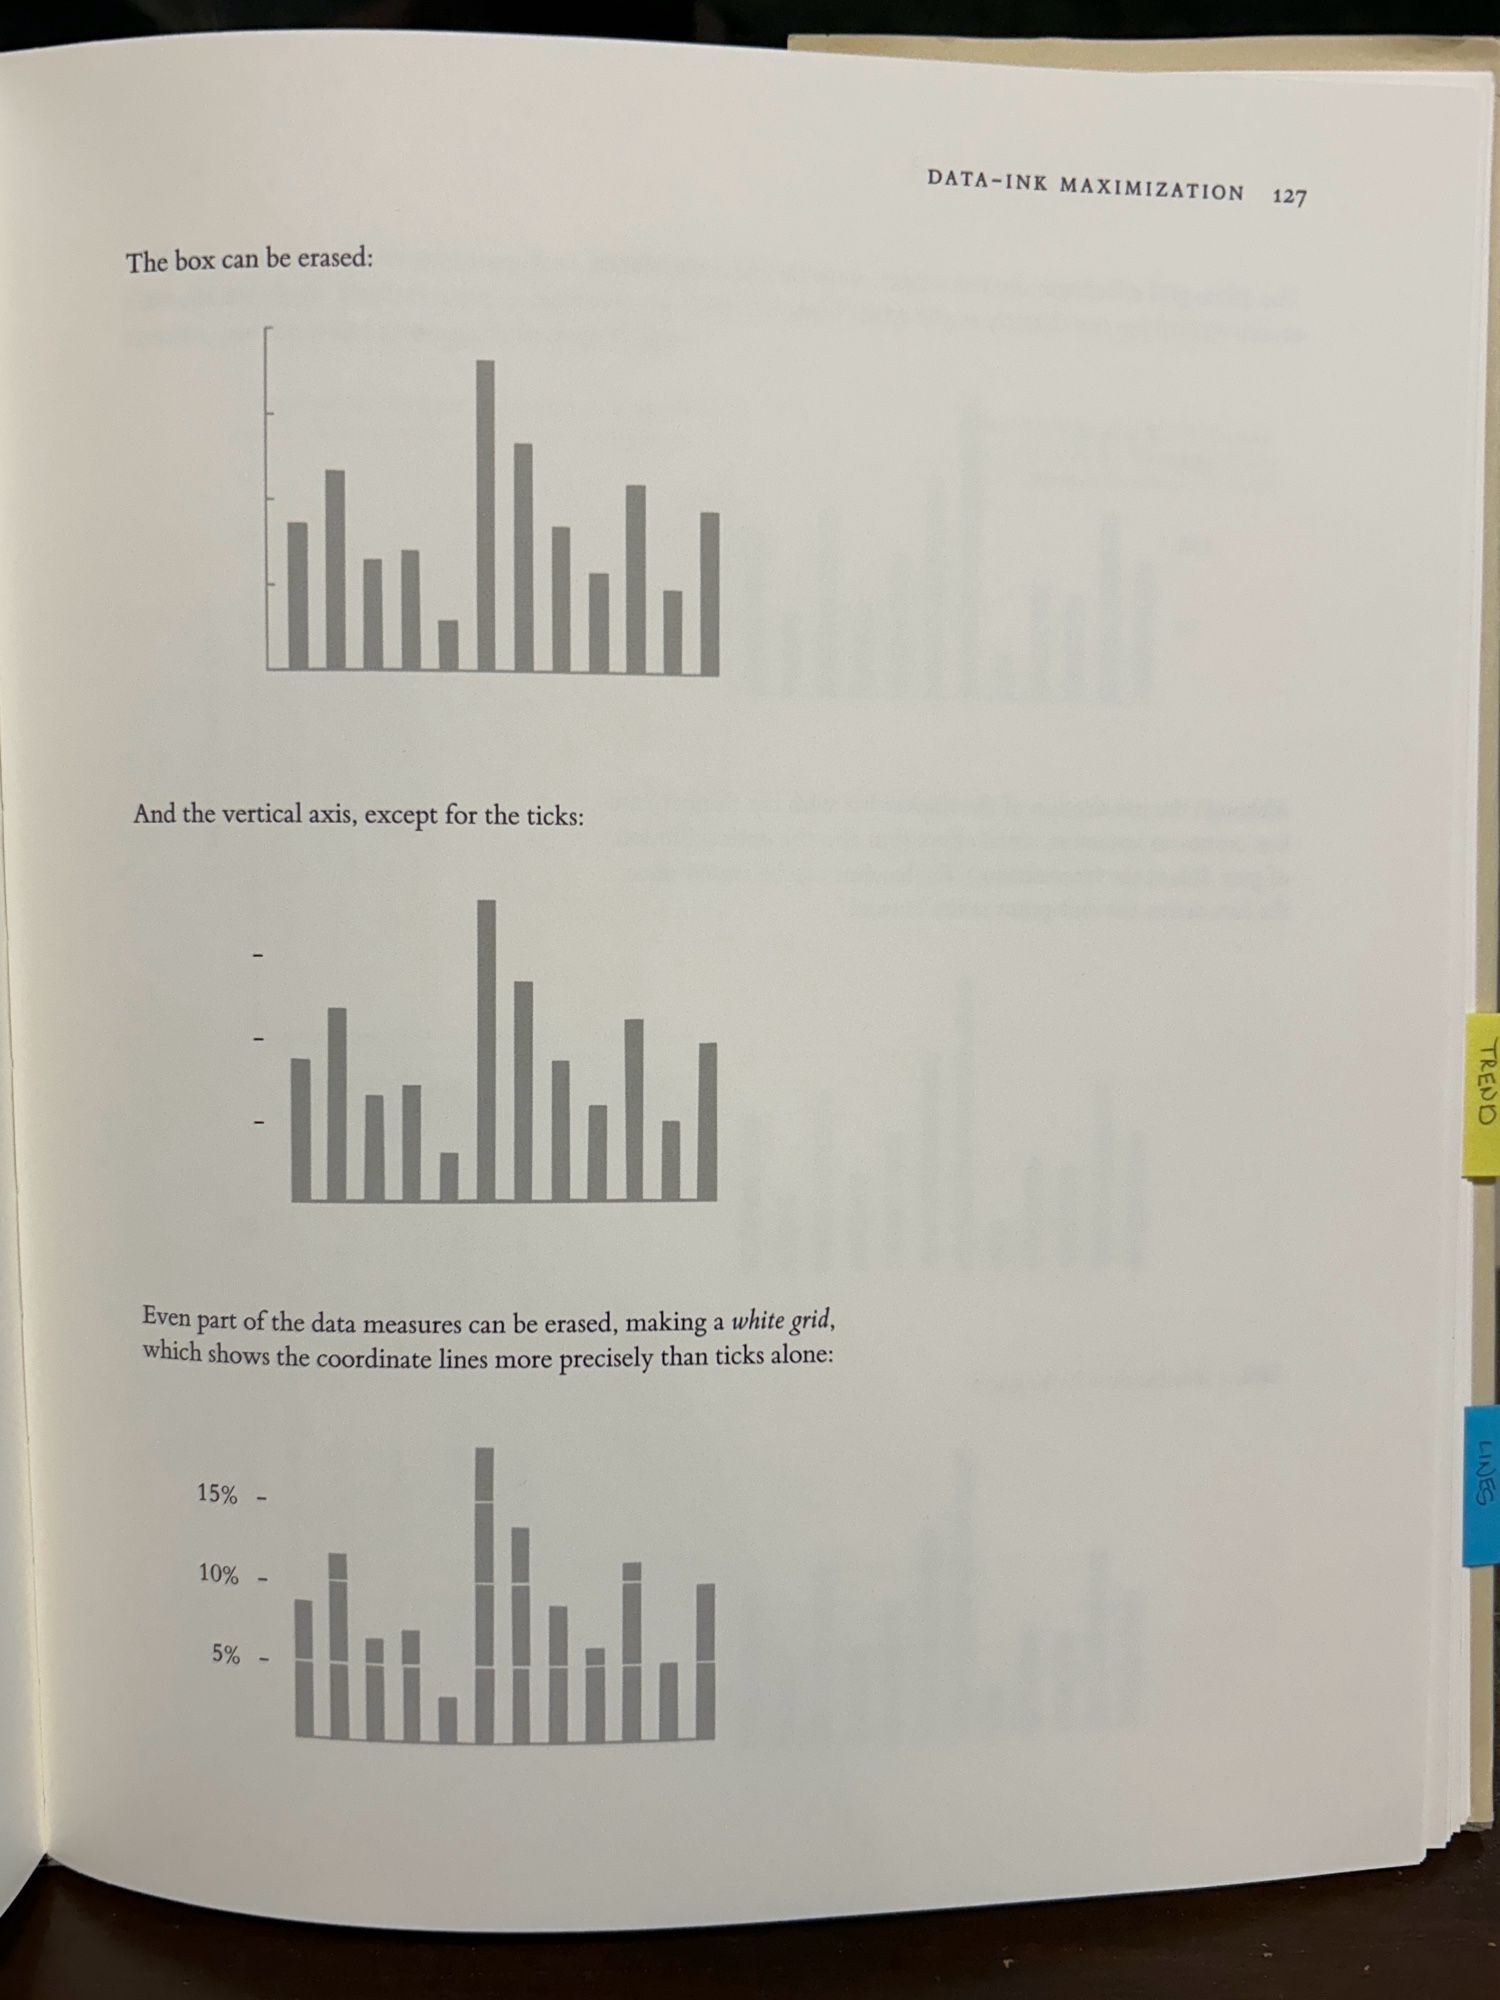
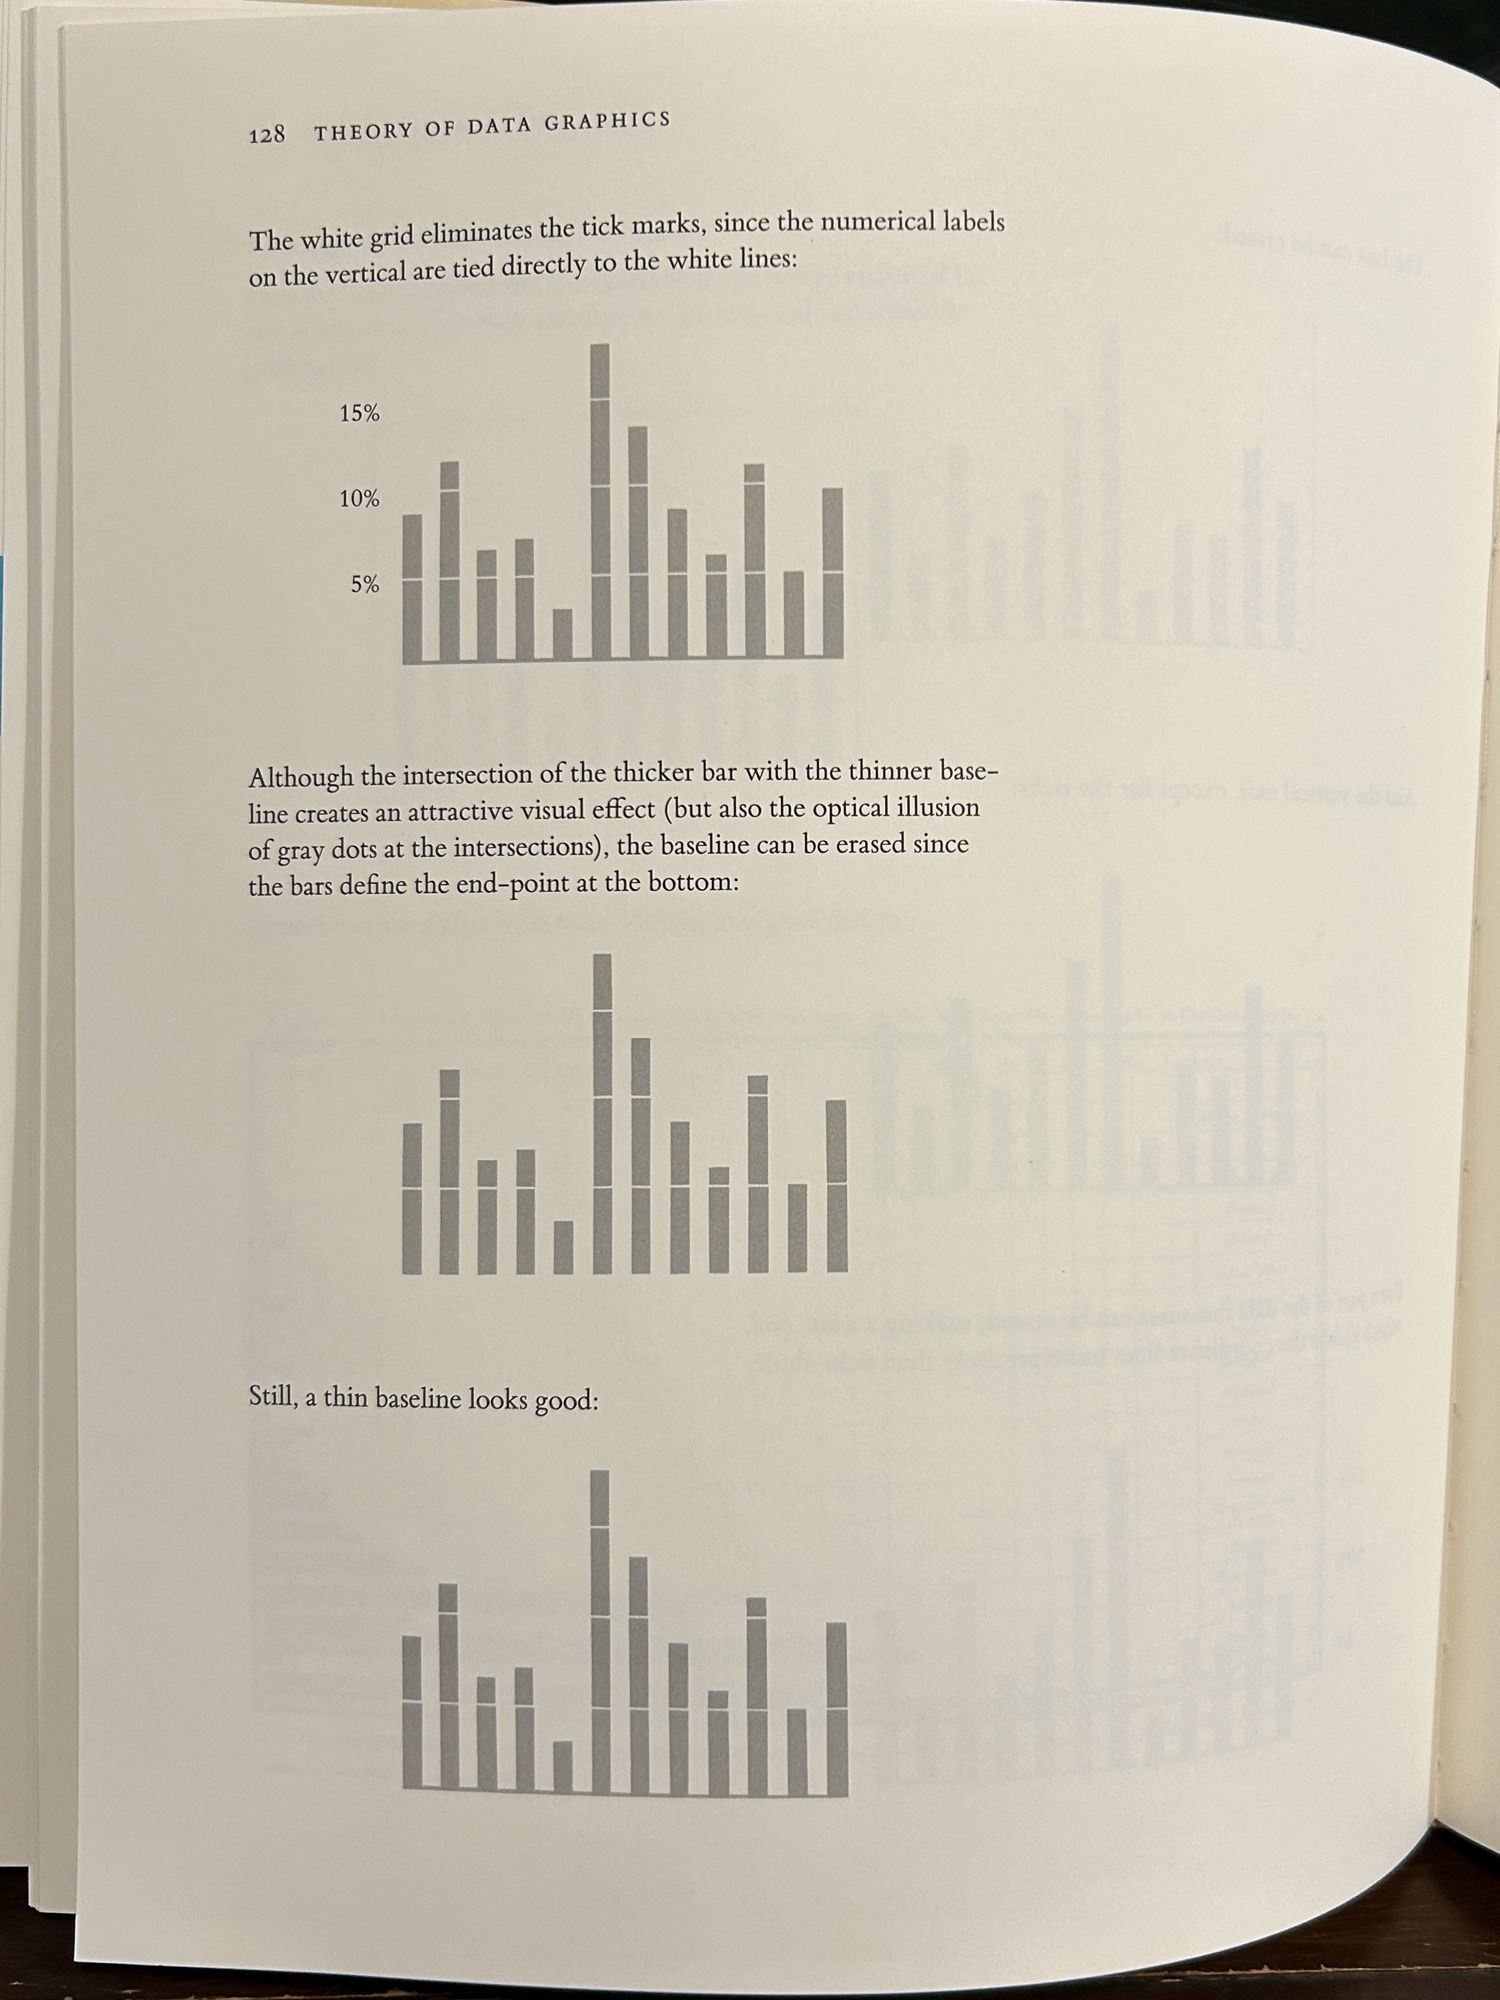
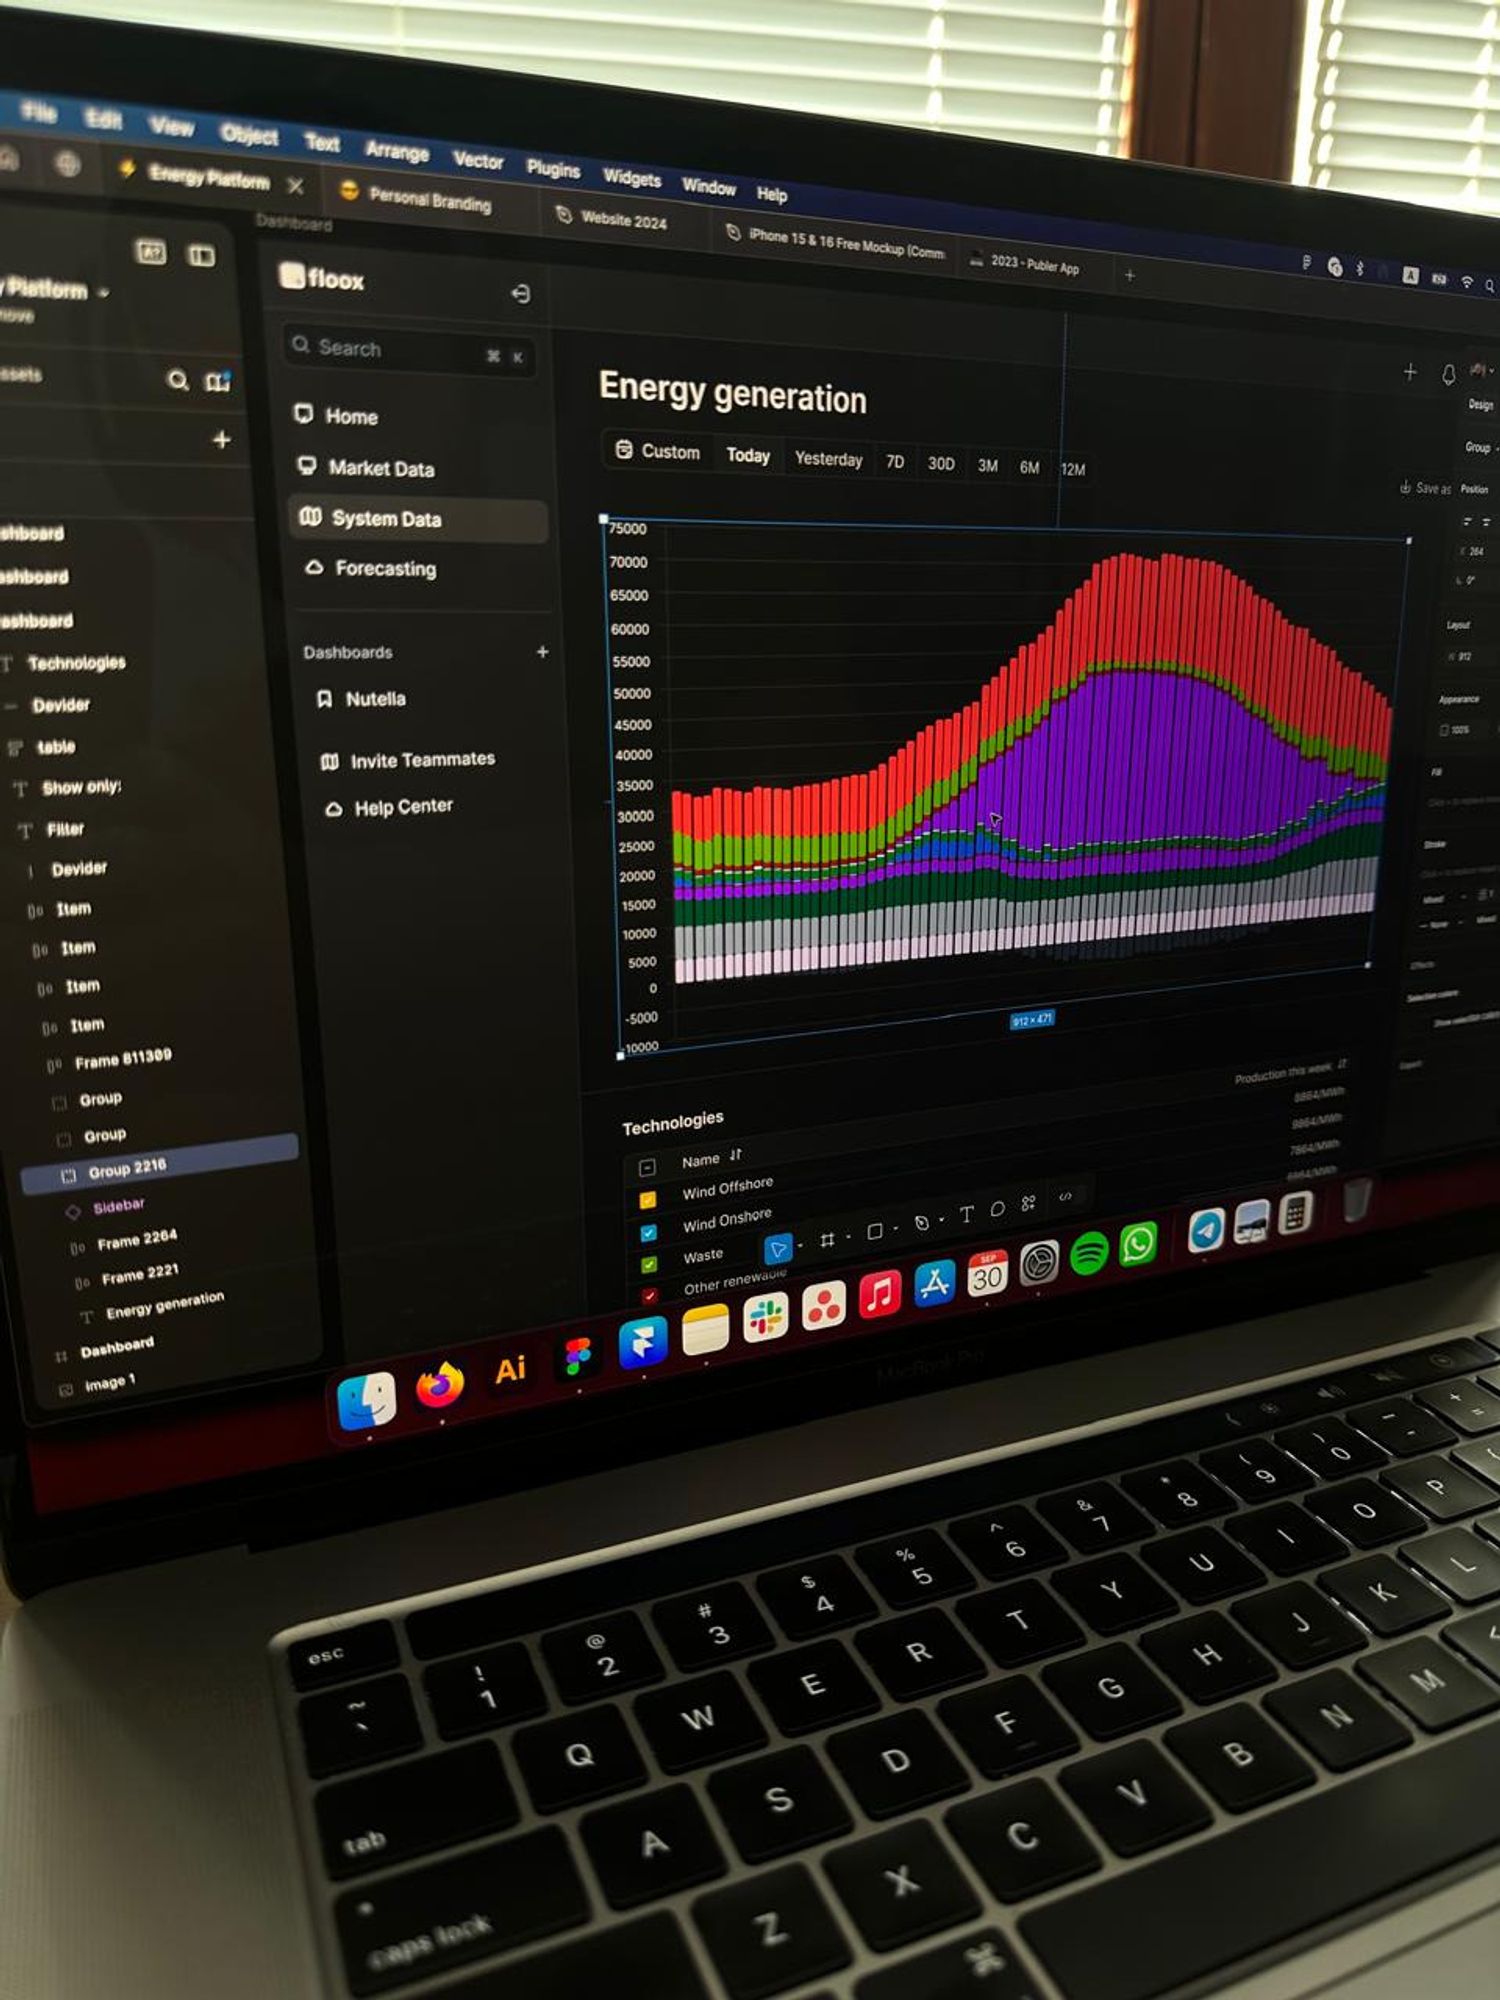
Tufte’s “The Visual Display of Quantitative Information” is an endless source of data visualization inspiration. My current favorite idea: for bar charts, OVERLAY white lines for the y axis grid. It’s elegant and simple; makes comparisons more clear; and does so using less ‘ink’.
This is incredible!! As a visual learner, this LLM visualization makes things way easier to understand. bbycroft.net/llm shows the dance of tokens as the AI generates text.
Combined visualization of genomic and epidemiological data for outbreaks https://pubmed.ncbi.nlm.nih.gov/39344899/
It's not Thursday, but throwback to my one and only film credit for "Research" (a film for my former employer, Faithlife/Logos), IIRC having to do with background information for some of the visualization stuff. Yeah, I guess that's pretty on-brand. Does this make me a professional researcher?

Improving the visualization of viruses in soil www.biorxiv.org/content/10.1101/2024.09.30.615710v1

Viruses are numerically the most abundant forms on Earth, and most are present in soil. Scientific s