#Rstats#QuartoLive Tutorials (transforming learnr tutorials). To use packages in the tutorial you add these labels on your YAML and list the packages: webr: packages: - ggplot2 - gapminder - dplyr Where can you find WebAssembly versions of your […]
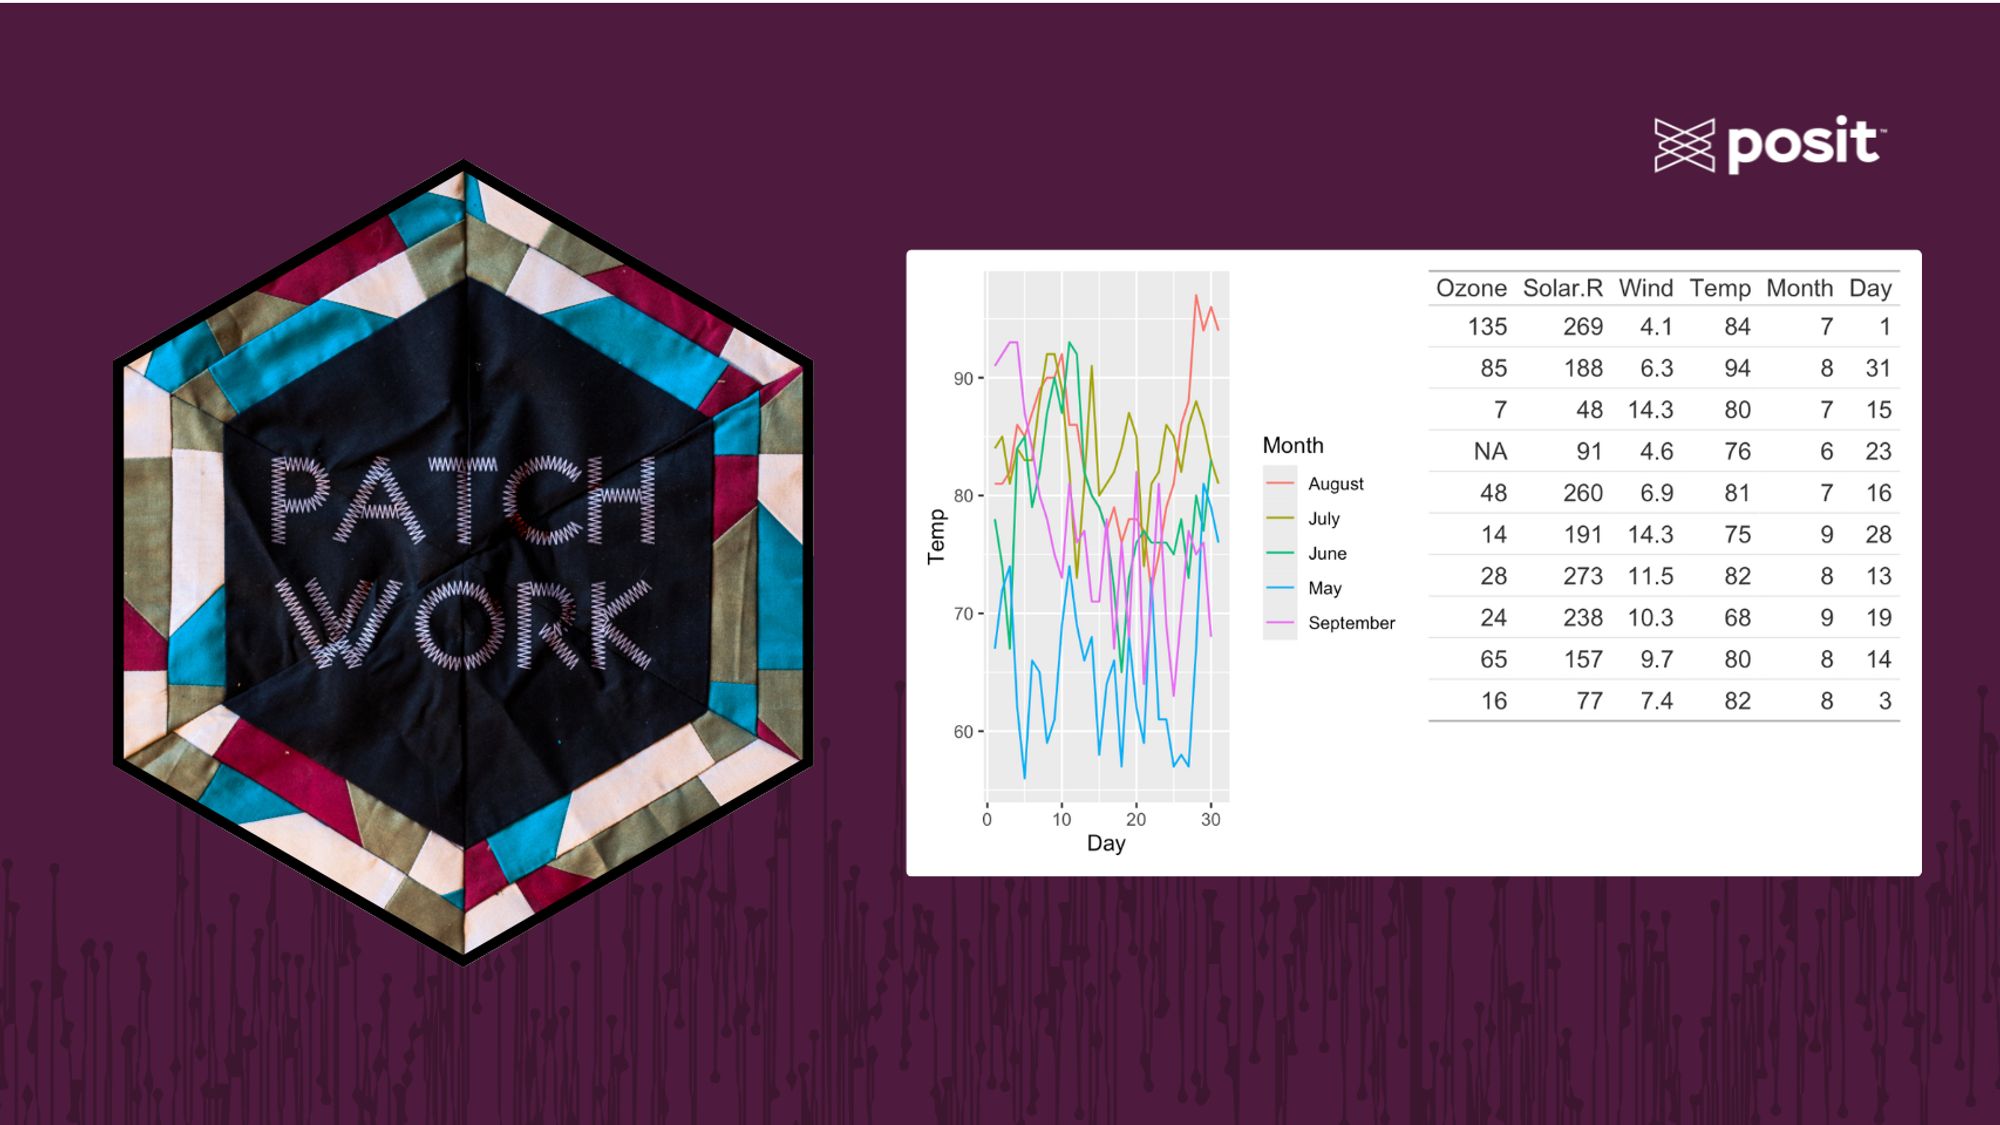
Announcing patchwork 1.3.0! 🎉 patchwork makes simple and powerful plot compositions in #RStats@thomasp85.comwww.tidyverse.org/blog/2024/09...
How to Create Horizontal Boxplots in Base R and ggplot2 "Introduction Data visualization is a crucial aspect of data analysis, allowing us to understand and communicate complex data insights effectively..." https://www.r-bloggers.com/2024/09/how-to-create-horizontal-boxplots-in-base-r-and-ggplot2/
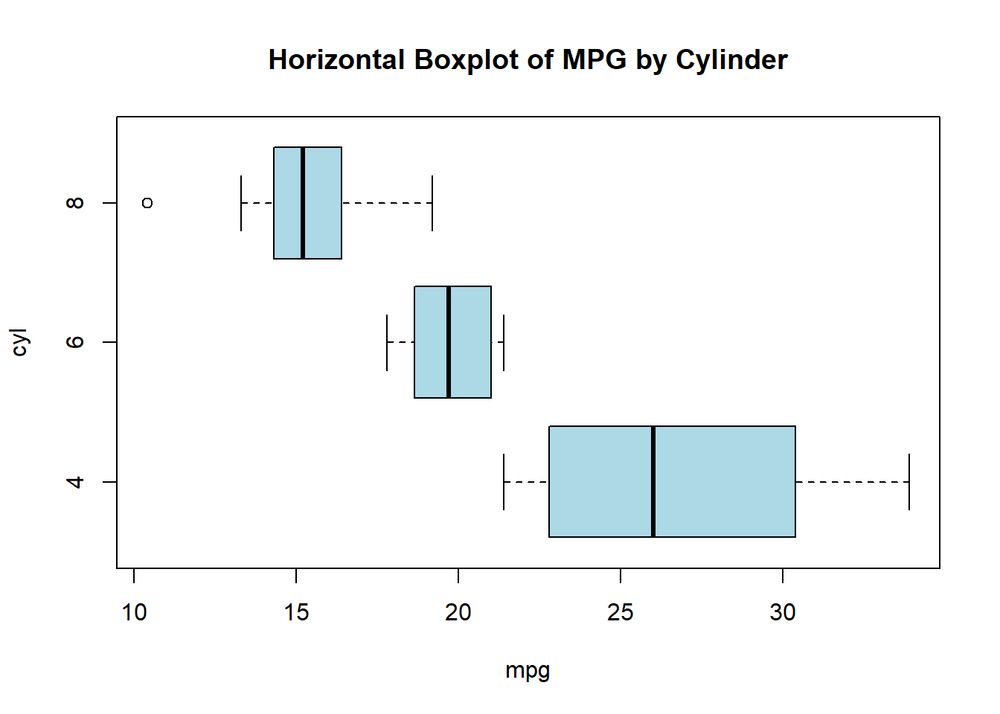
Introduction Data visualization is a crucial aspect of data analysis, allowing us to understand and communicate complex data insights effectively. Among various visualization techniques, boxplots stan...

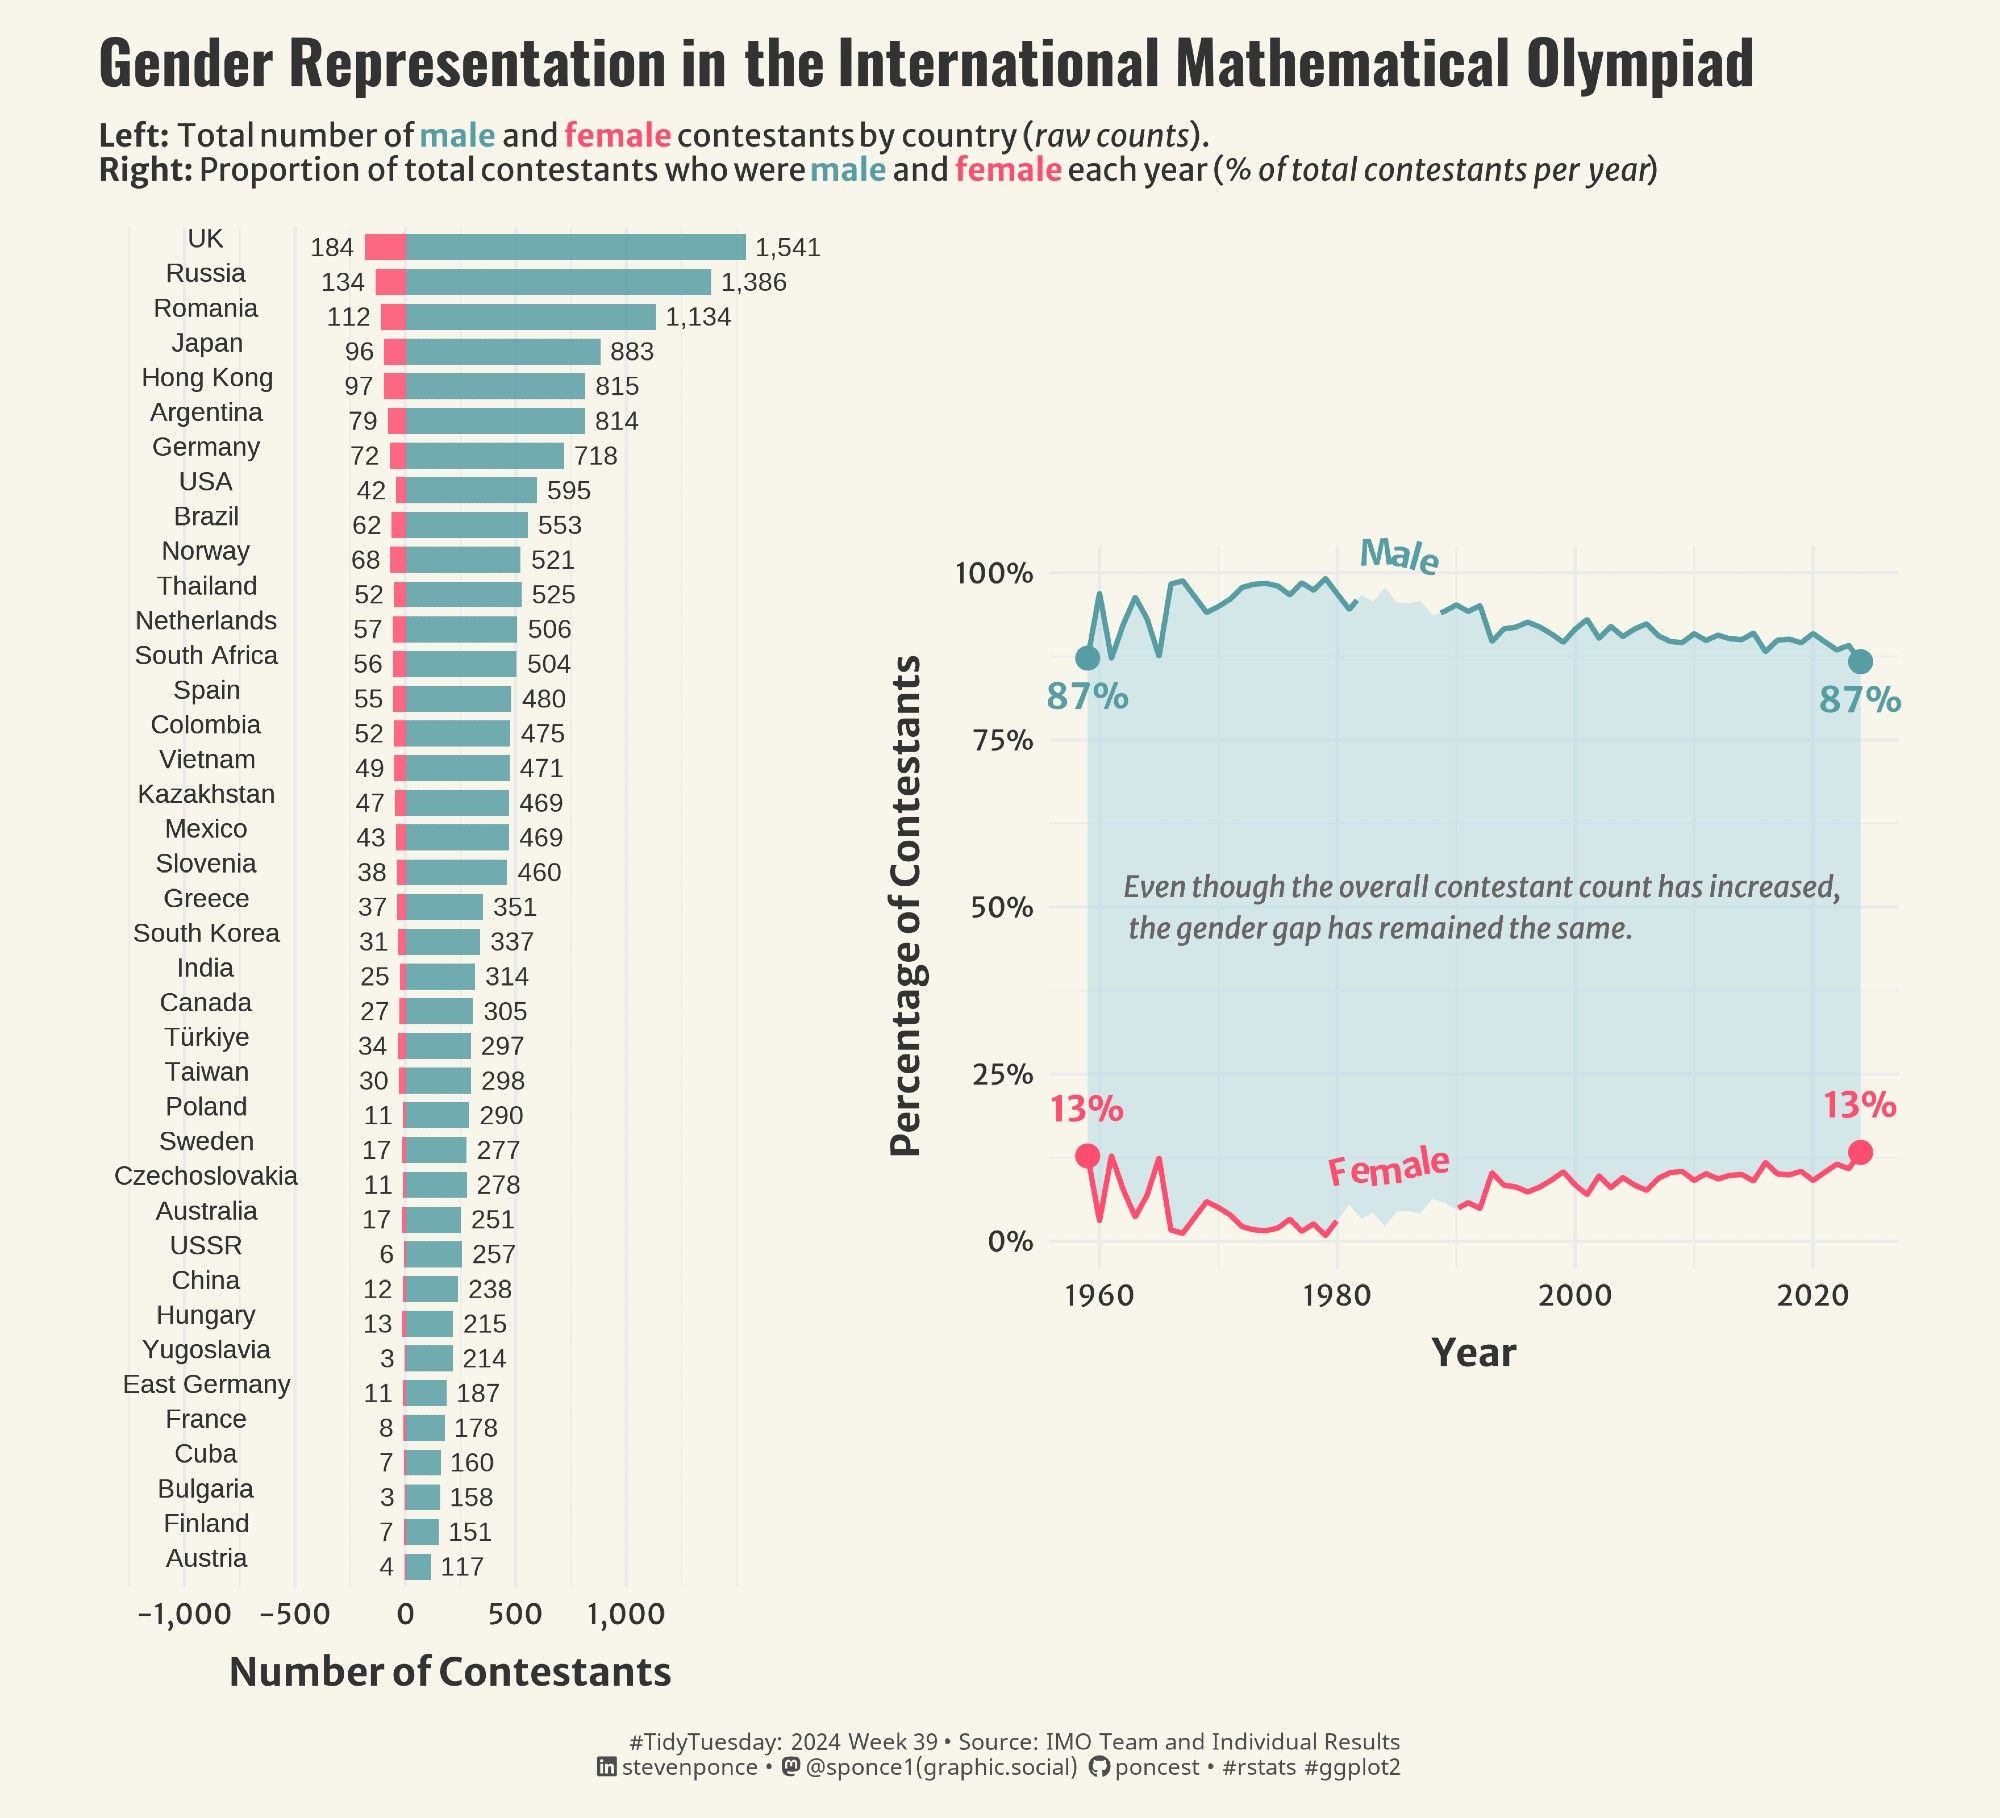
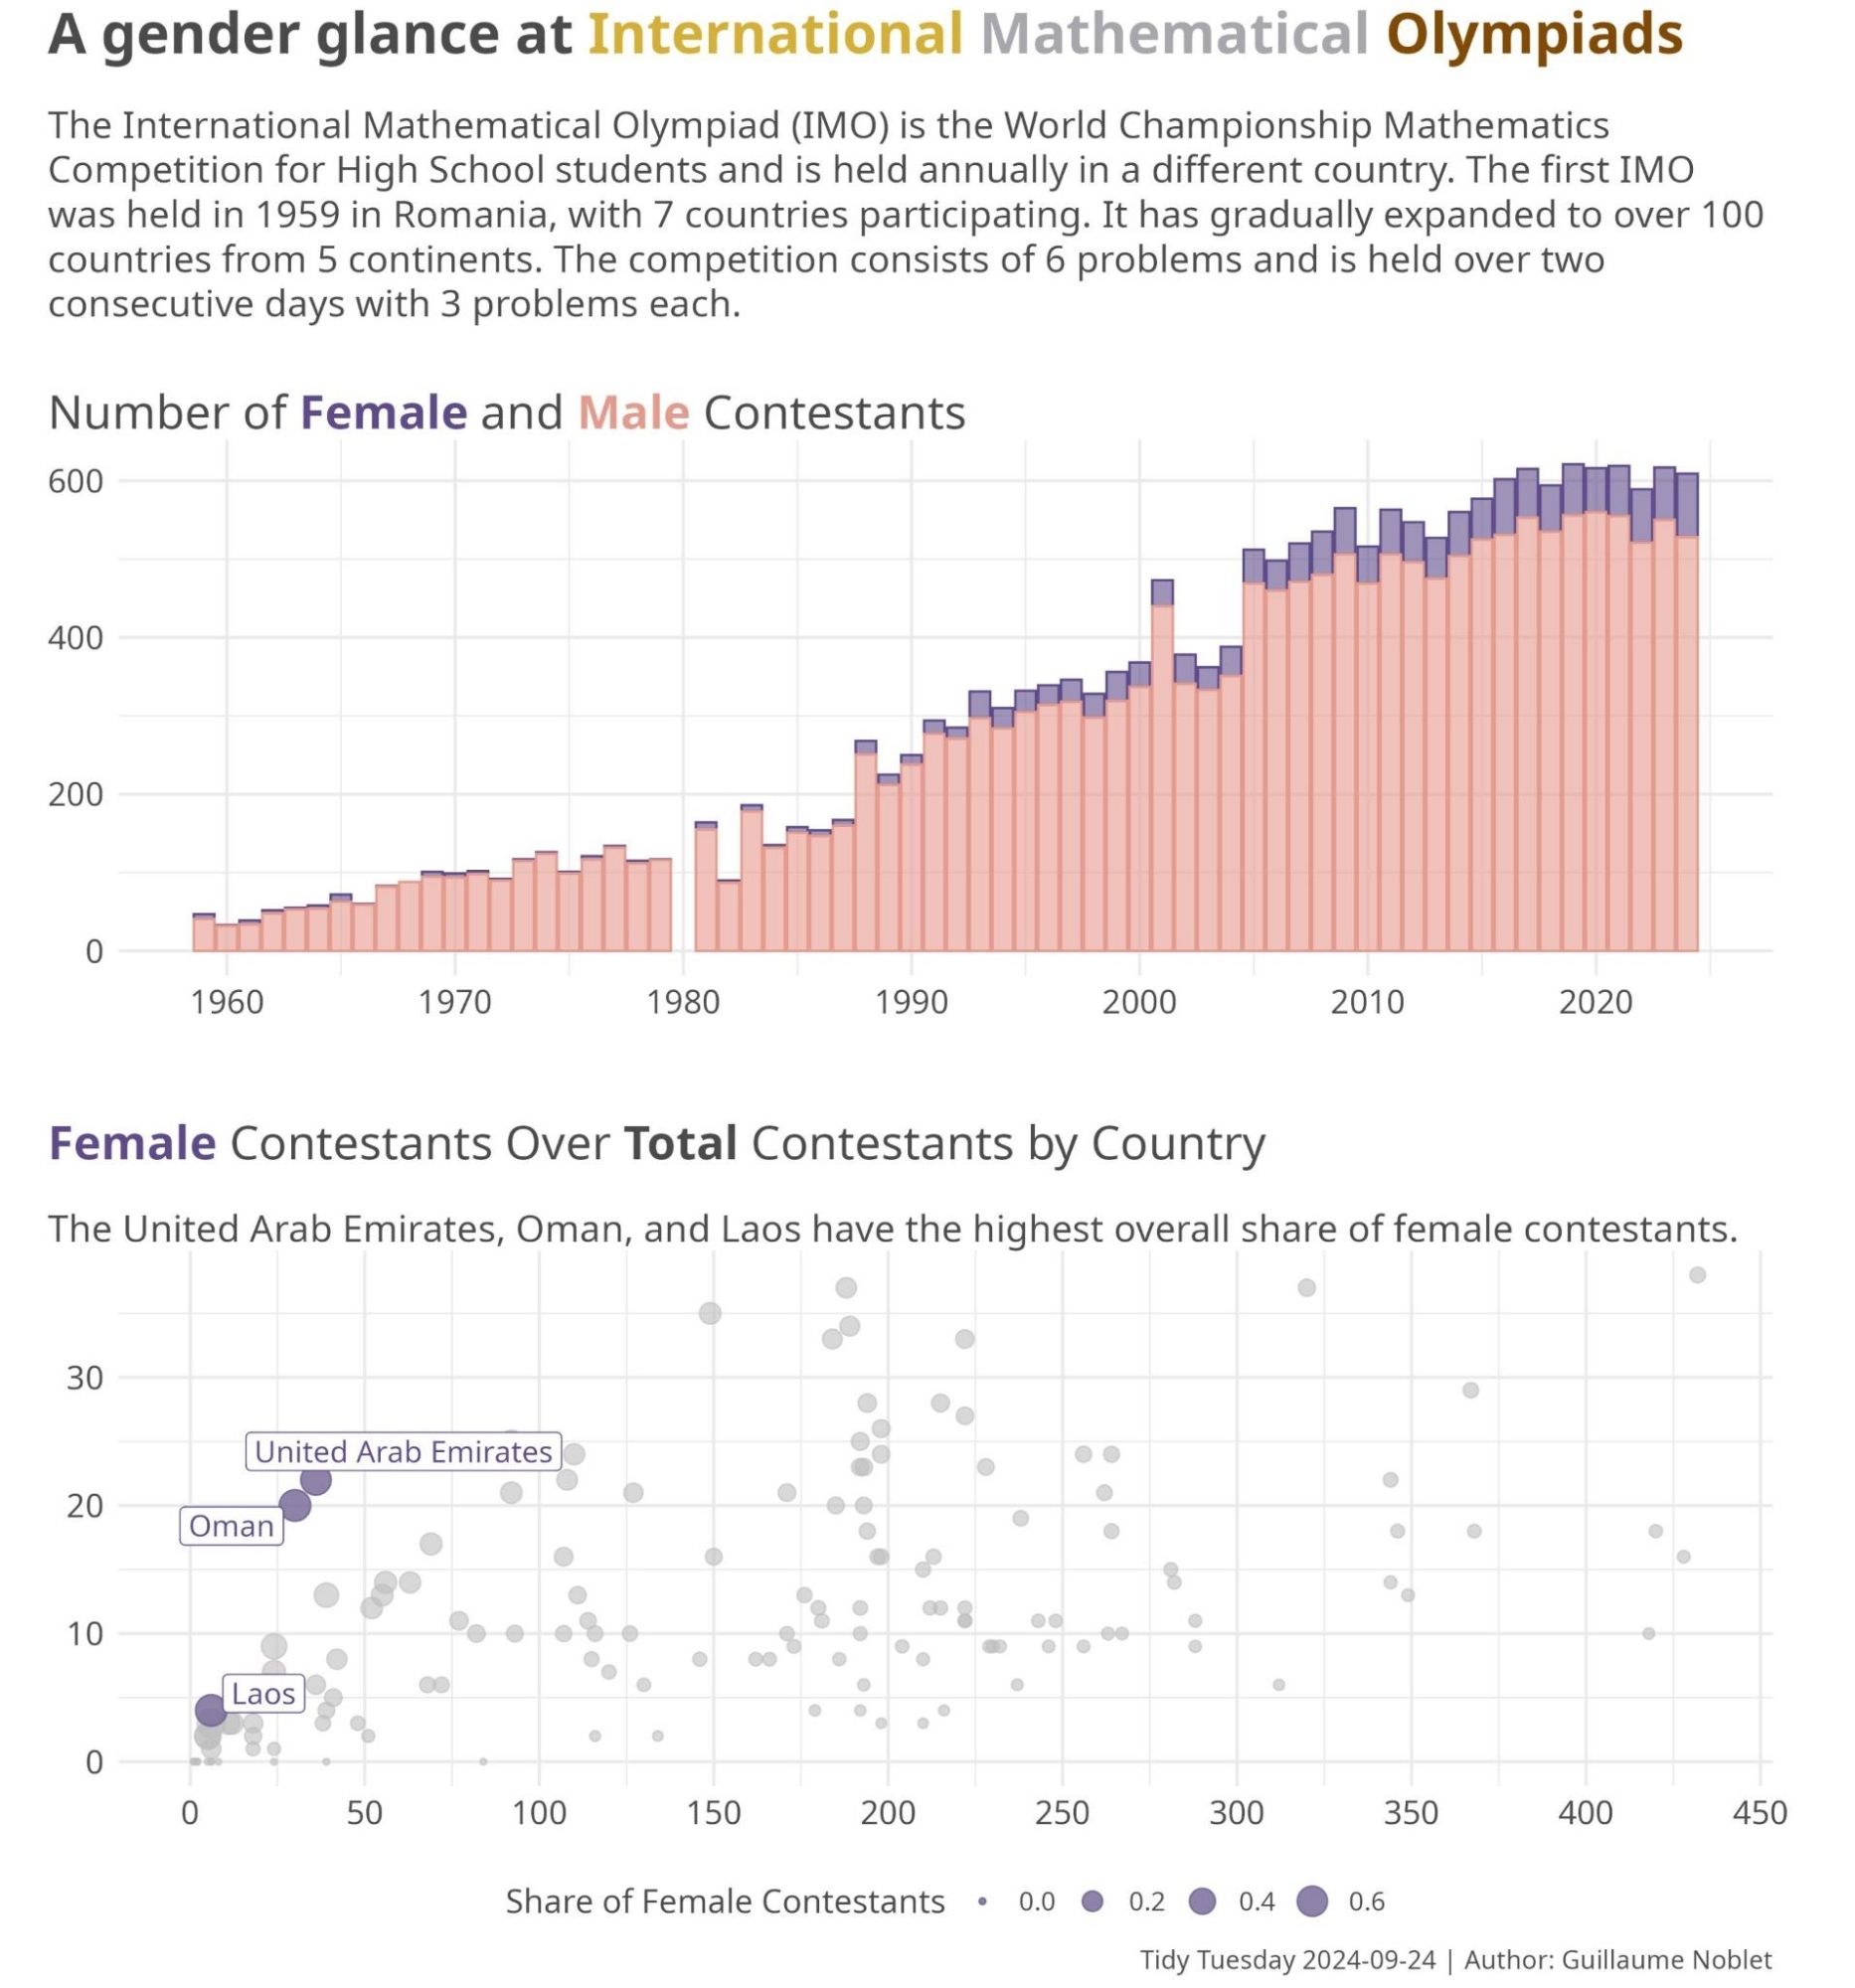
I'm teaching a class on how to create fabulous visualizations in ggplot2 in R, this upcoming quarter. I'm always like to show examples of good, bad, and ugly figures, and ask them how to improve them. If have any examples (from your own work or published figures), reply here!
Uppdaterade terapisimuleringar av slutställningen efter 65% av matcherna i Allsvenskan 2024. As usual a big hand to Joseph Buchdahl for collecting data and http://posit.cloud#rstats#ggplot2