(automated) #Balkonsolar Tagesertrag: 953.97Wh erzeugt am 2024-10-01 49.72% Änderung gegenüber gestern
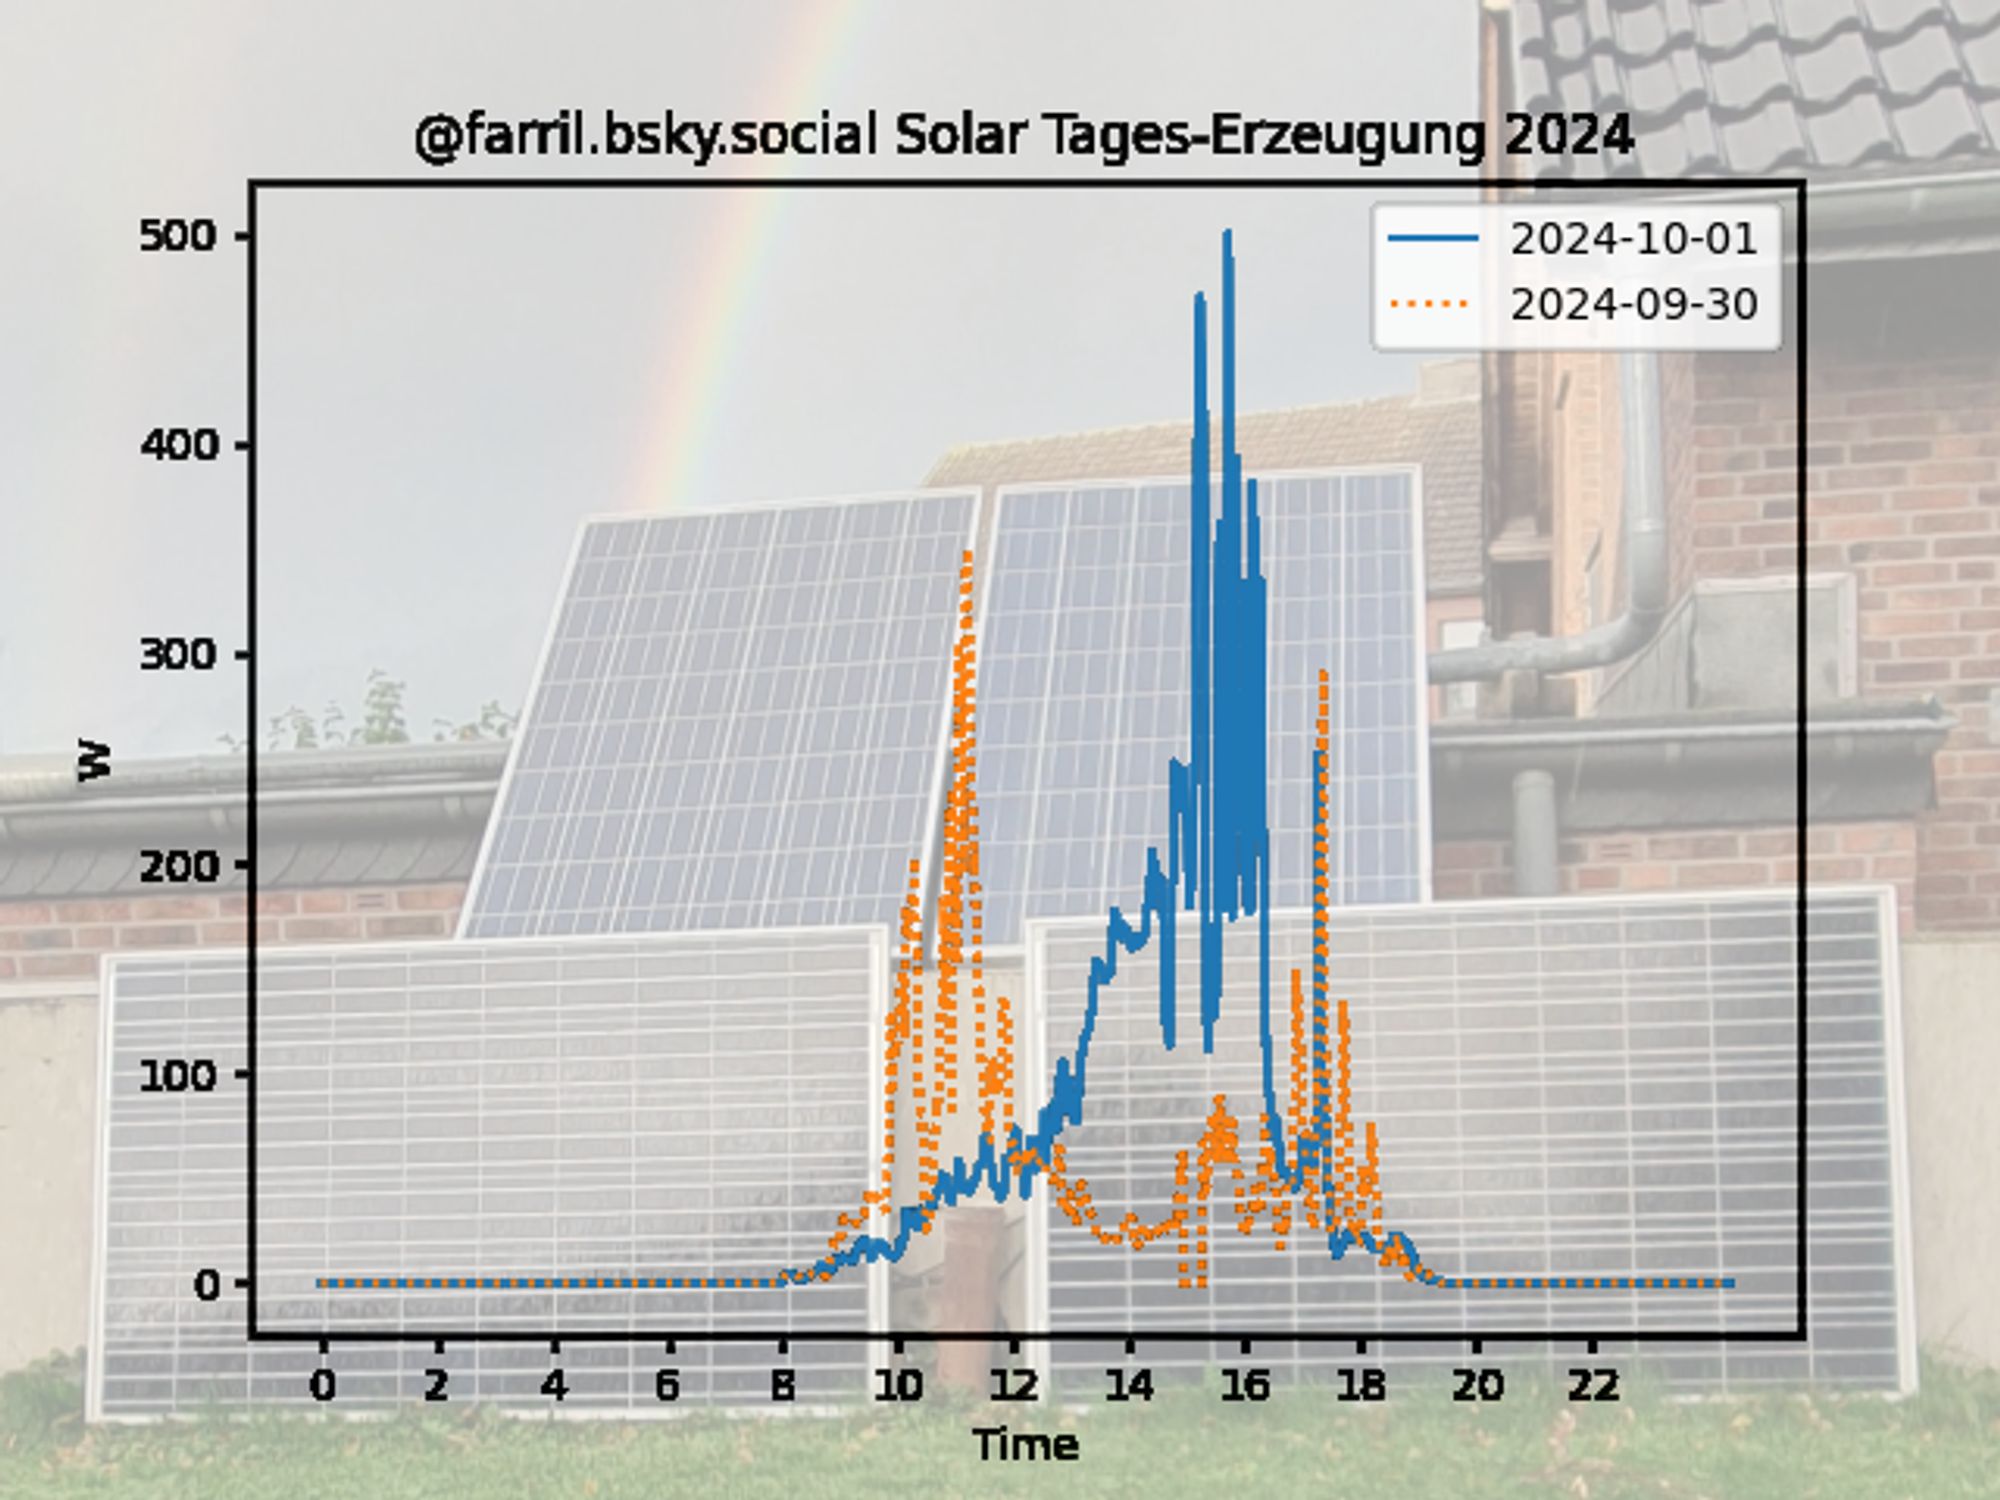
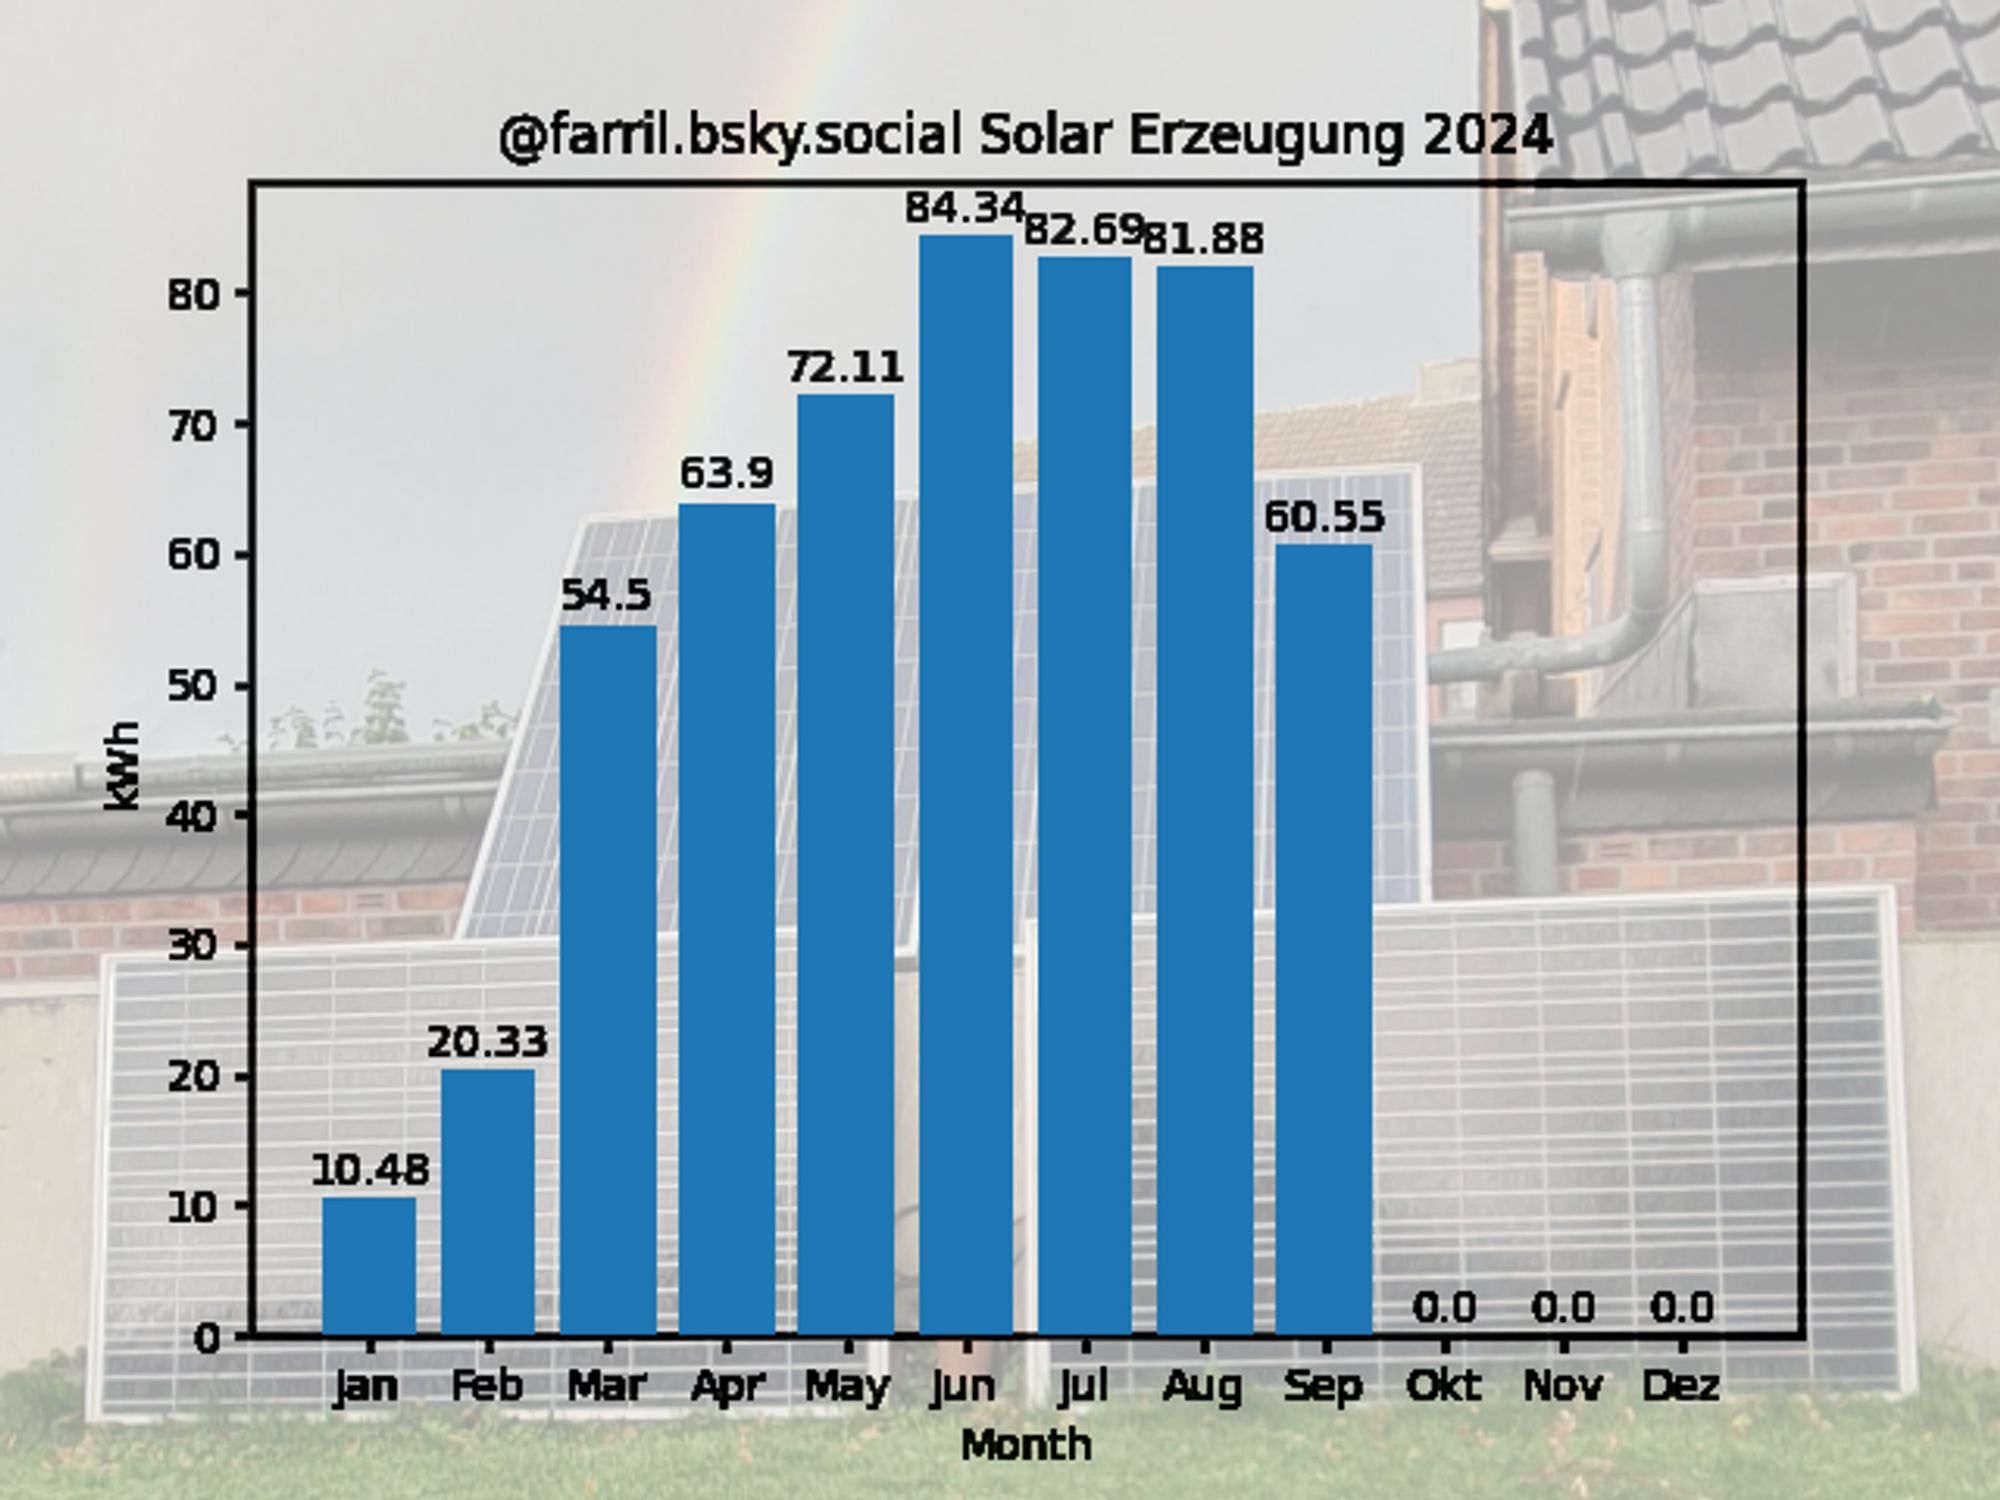
(automated) #Balkonsolar Statistik vom 2024-10-01: 531.7kWh erzeugt in 2024 Das ist 10.63% des Strombezugs 2022 Ersparnis bei 23,85ct/kWh: - ohne MwSt = 126.81EUR - mit MwSt = 150.9EUR Gesamt bisher: - ohne MwSt = 303.22EUR - mit MwSt = 360.83EUR


'ello folks! Interested in contributing? Want advice on opening or choosing an issue? Have a pull request that's stalled out🫤? Wanna check that your talk/poster/vid uses best practices? Curious or confused about this whole open source thing? Join tomorrow!

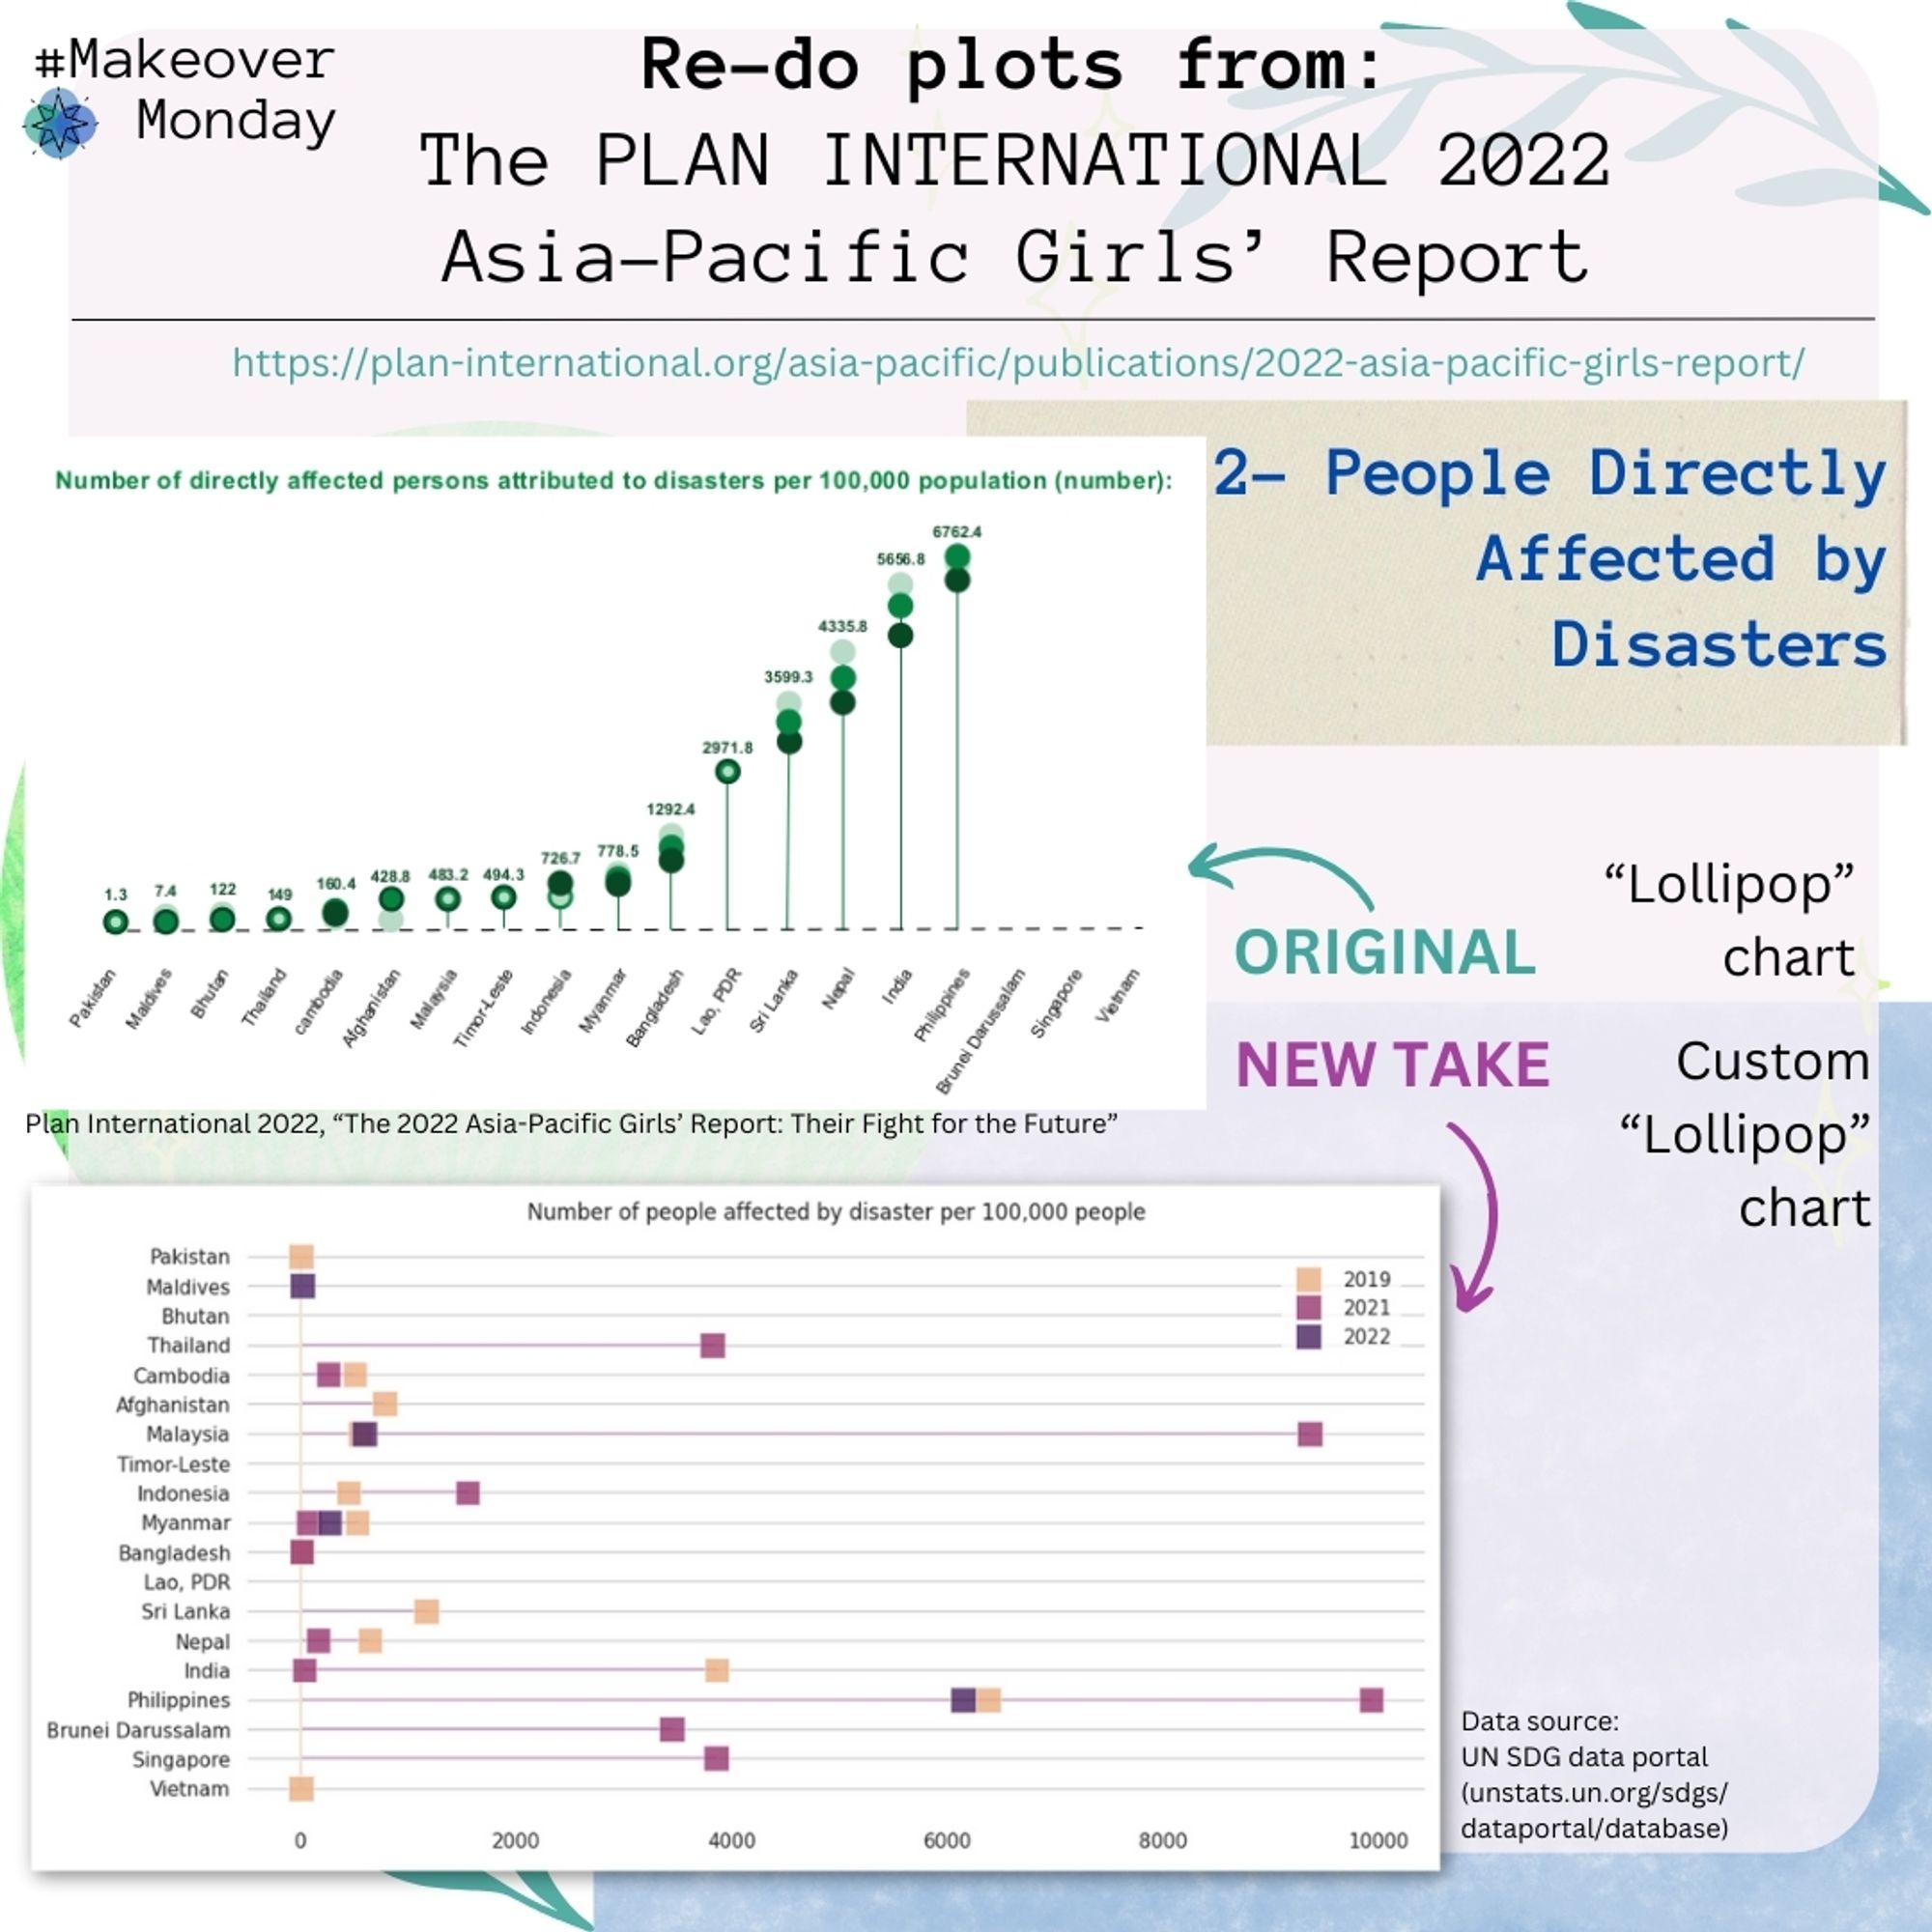
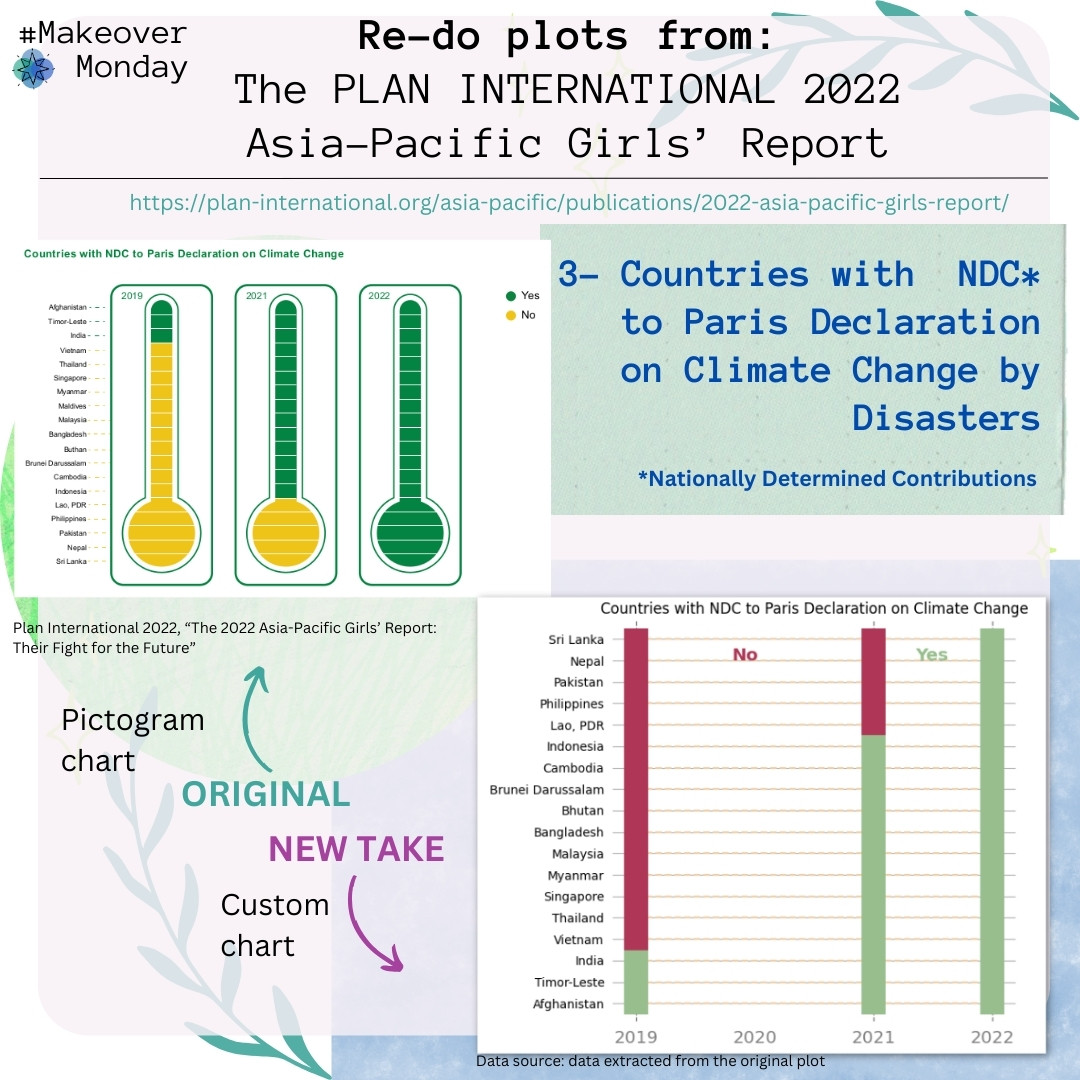
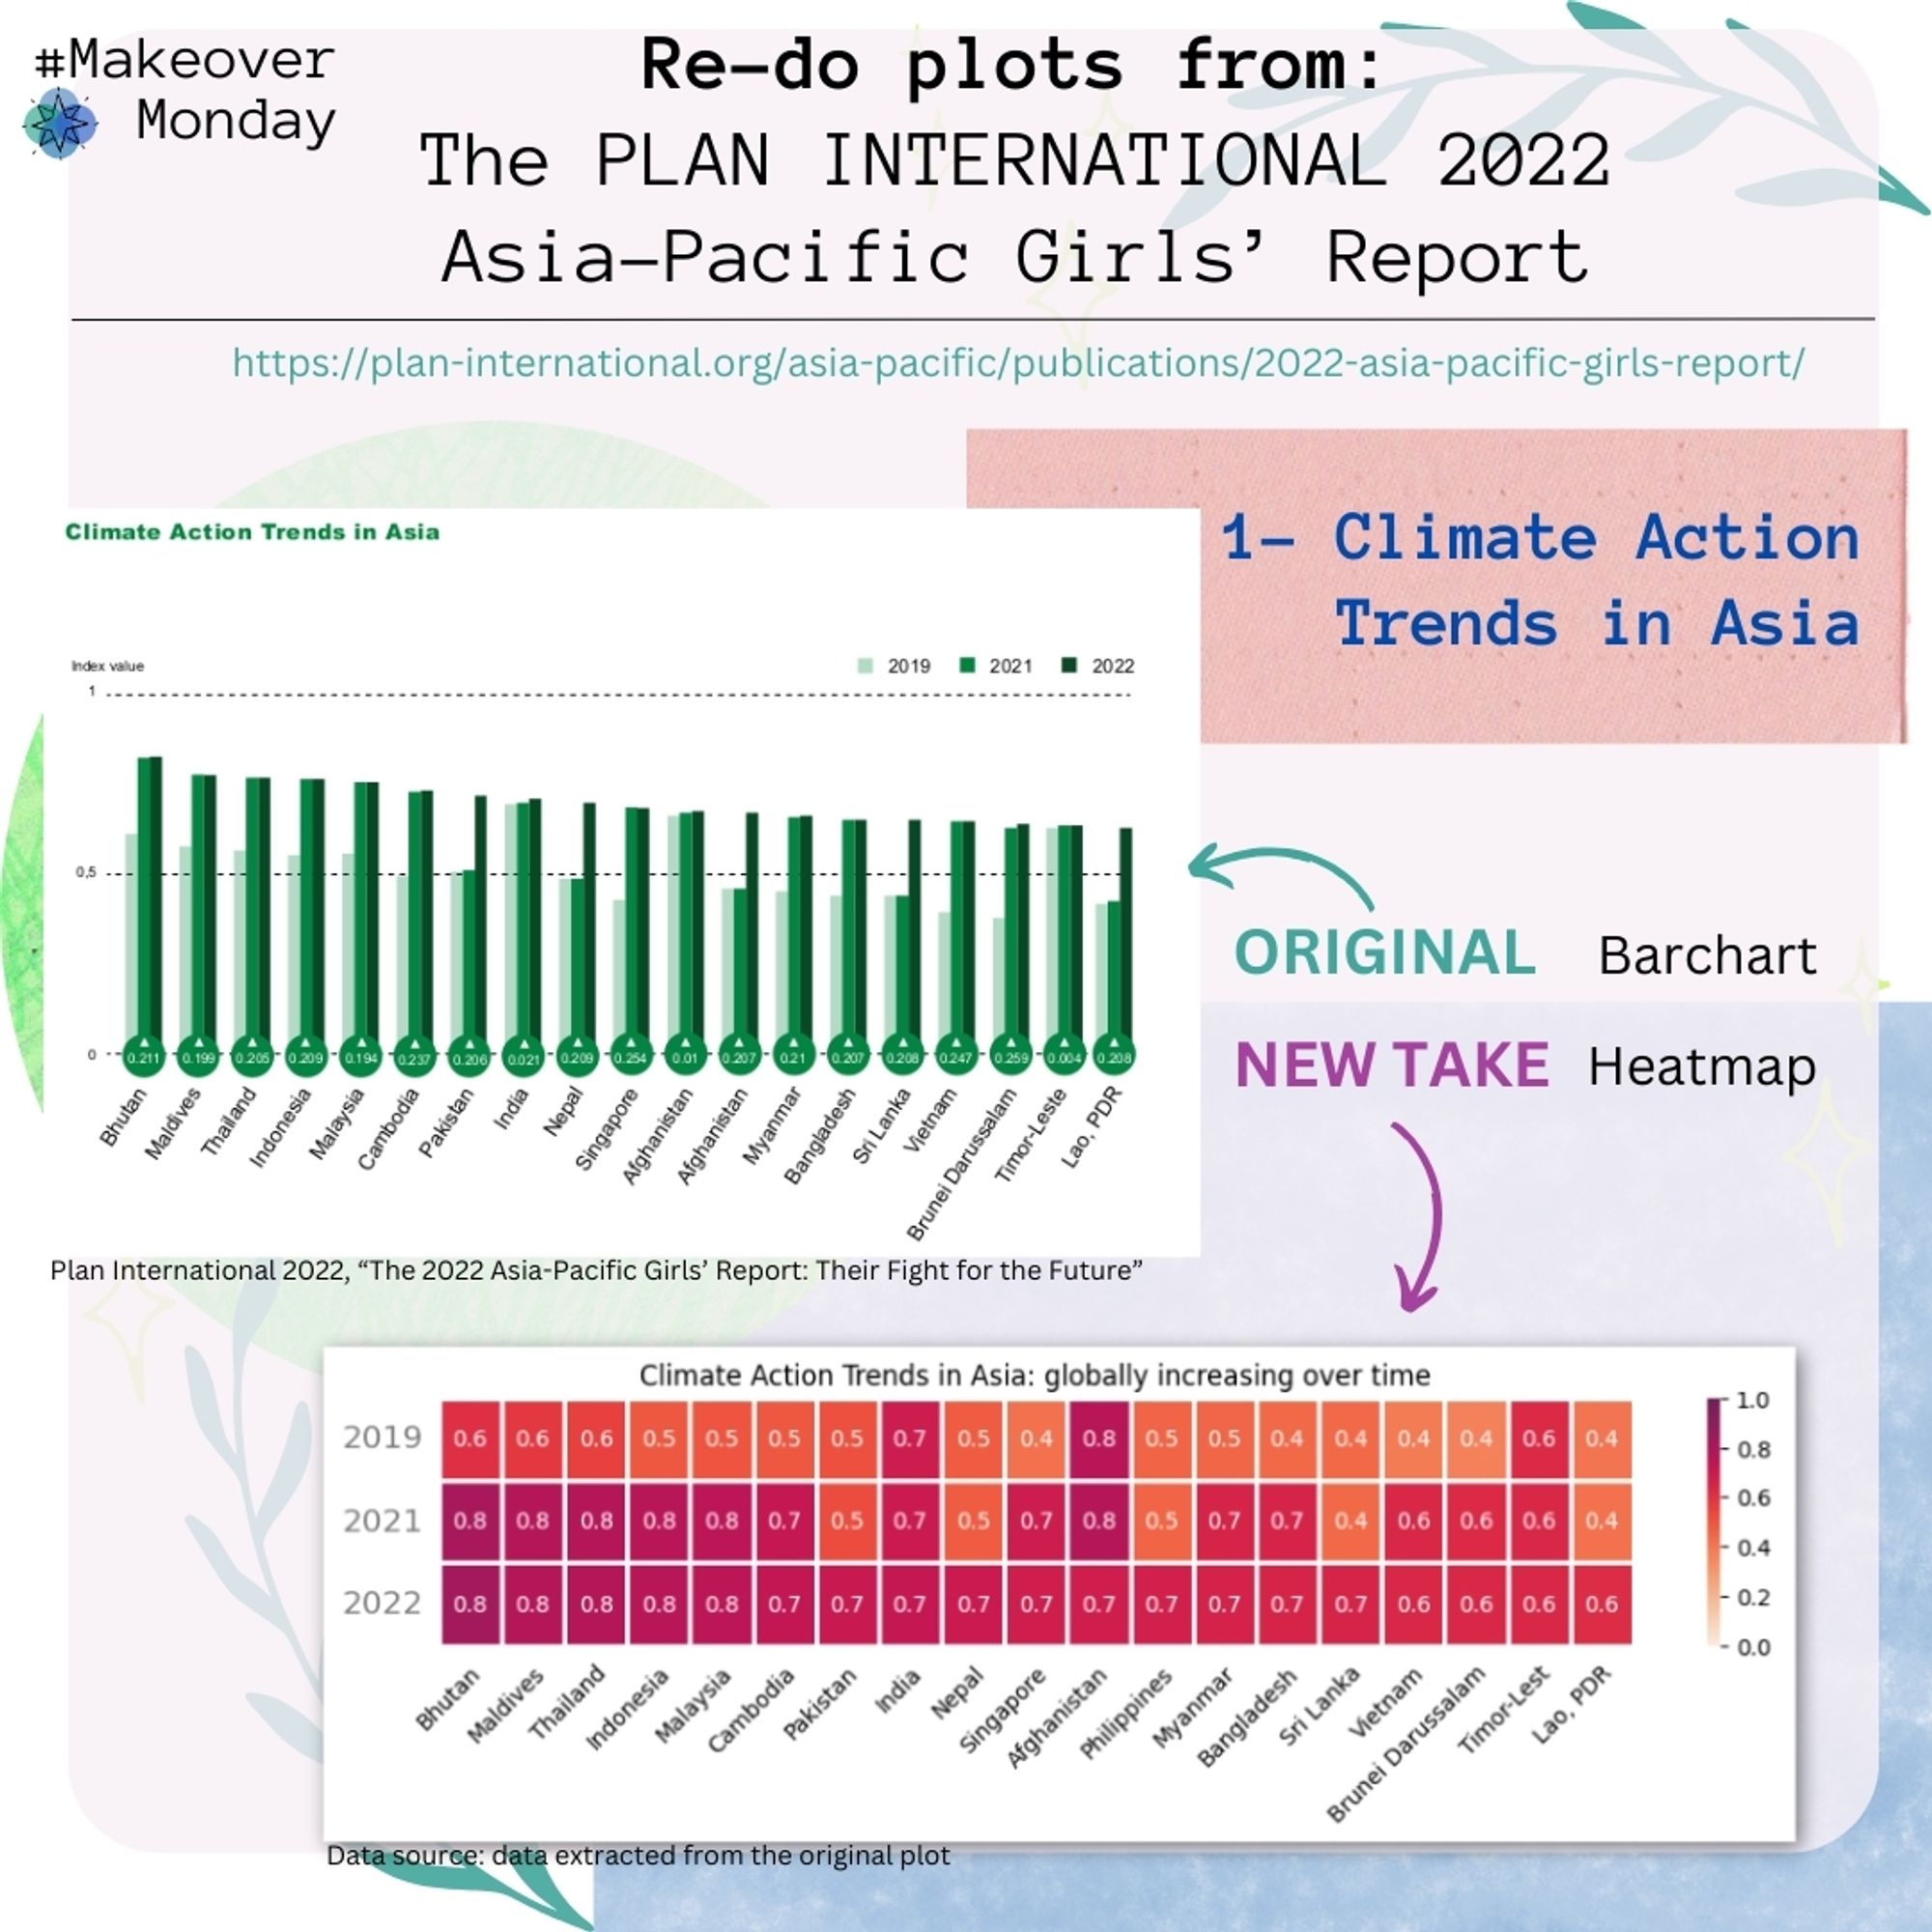
I was wondering how I would go about creating graphs/plots for a data report, so I gave it a go using Python (Seaborn and Matplotlib). It was a good exercise. I got to practice using Seaborn and learned more features of Matplotlib! 📊📈📉✨ . #makeovermonday#dataviz
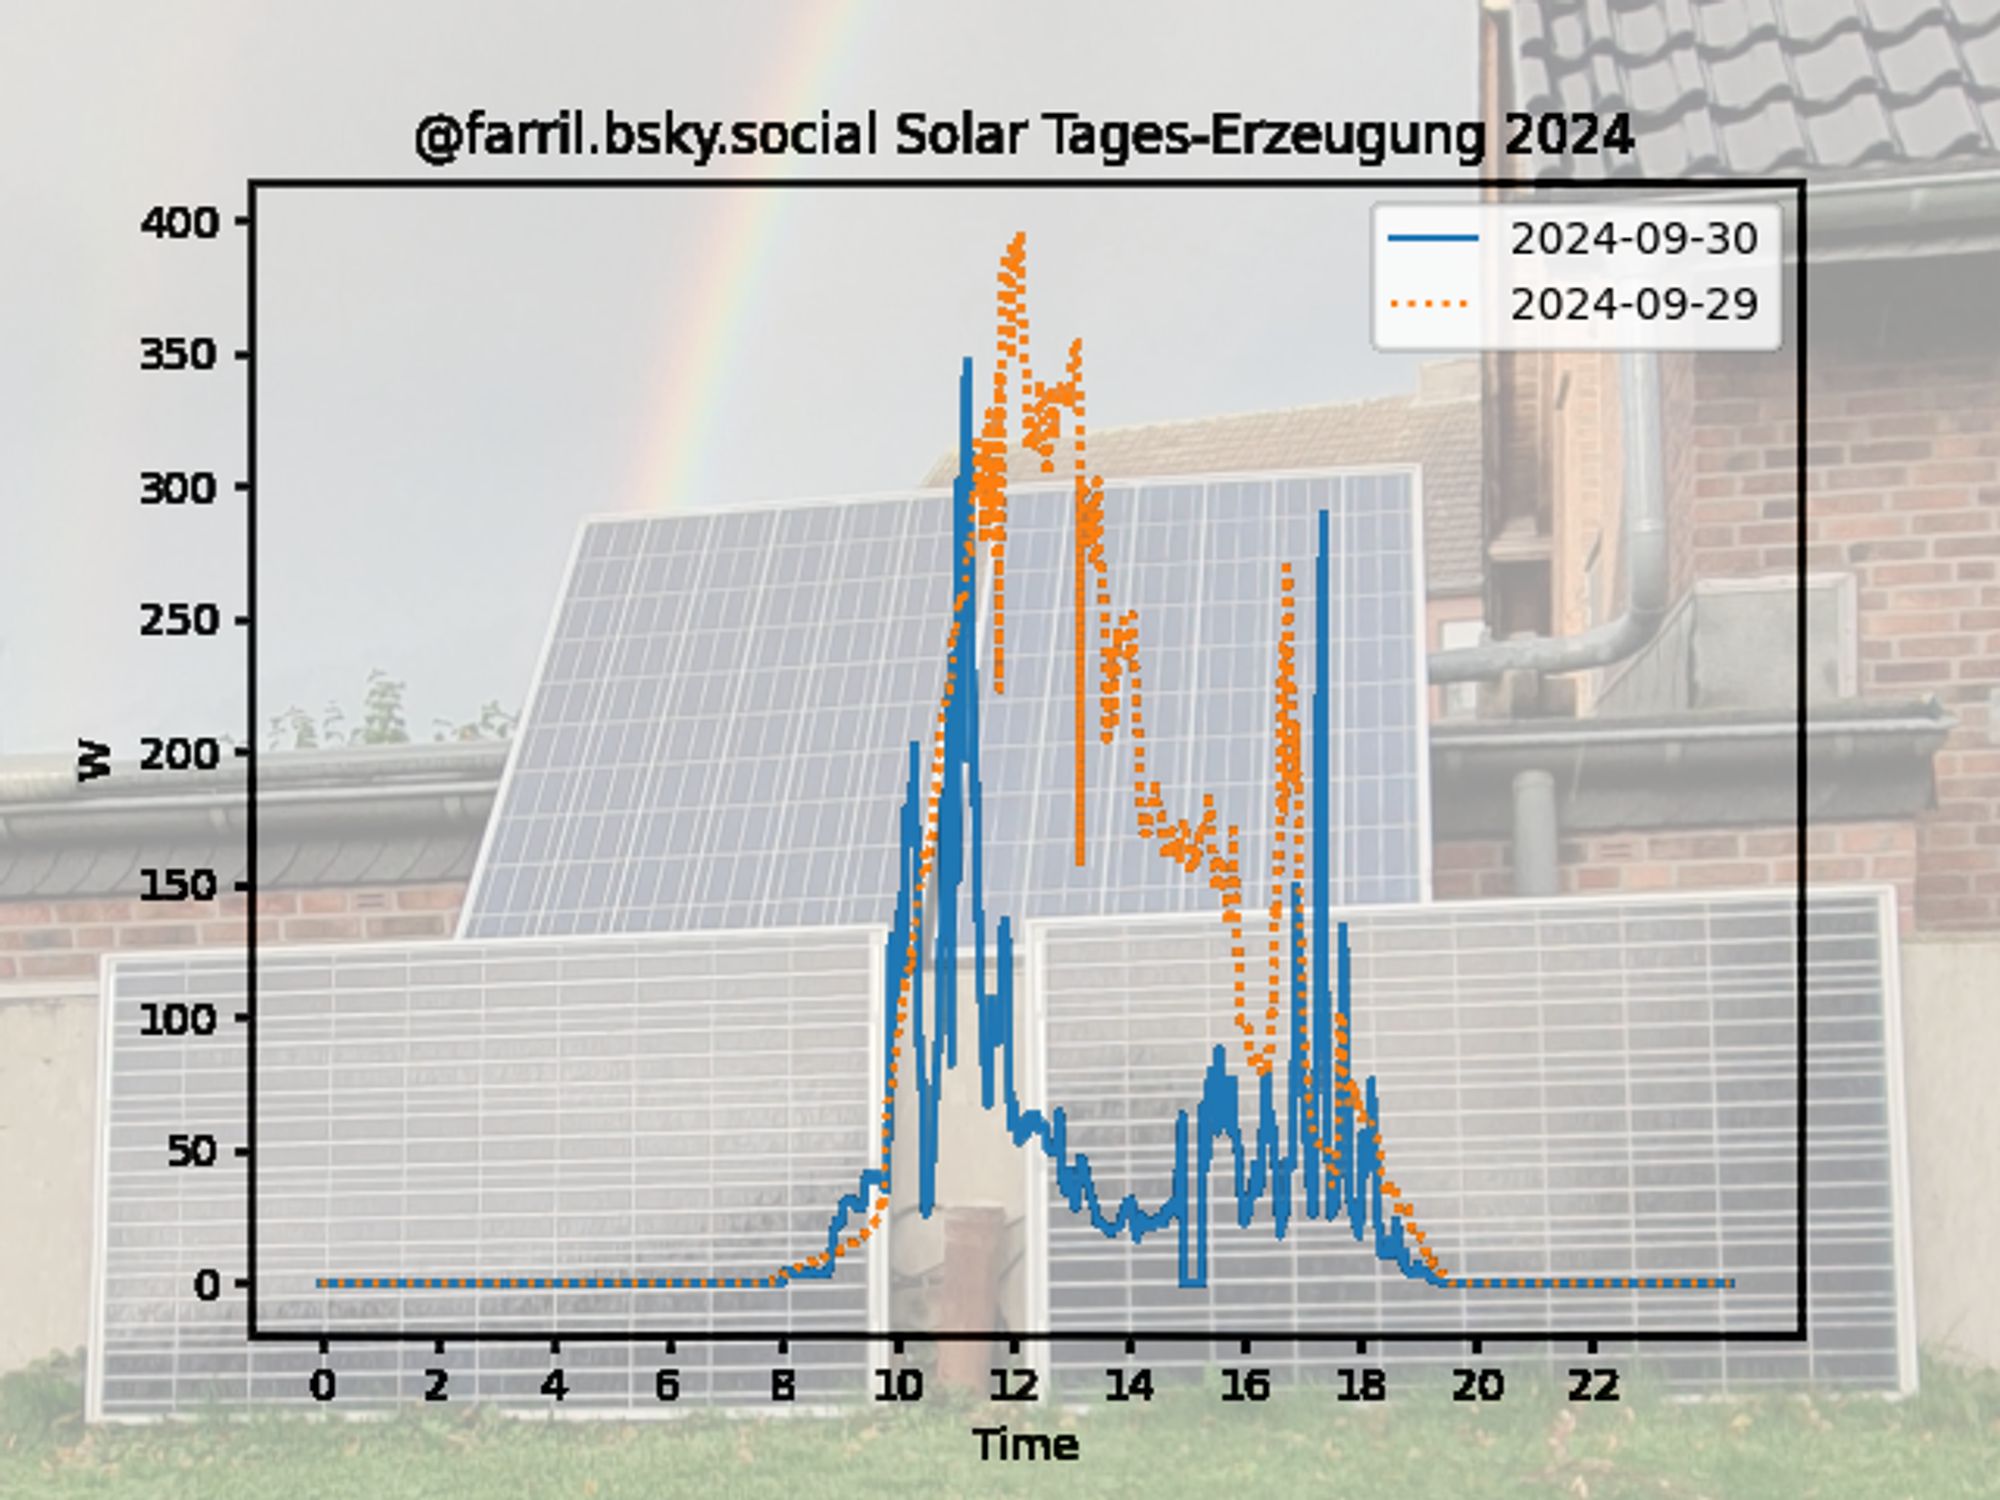
(automated) #Balkonsolar Tagesertrag: 637.18Wh erzeugt am 2024-09-30 -62.46% Änderung gegenüber gestern
(automated) #Balkonsolar Statistik vom 2024-09-30: 530.77kWh erzeugt in 2024 Das ist 10.62% des Strombezugs 2022 Ersparnis bei 23,85ct/kWh: - ohne MwSt = 126.59EUR - mit MwSt = 150.64EUR Gesamt bisher: - ohne MwSt = 303.0EUR - mit MwSt = 360.57EUR
Python | 使用Matplotlib繪製Swarm Plot(蜂群圖) #使用#繪製#蜂群

Swarm Plot(蜂群圖)是一種數據可視化圖表,
Não sei se utilizou matplotlib ou Excel. Mas o gráfico de linha é melhor utilizado para mostrar a o comportamento de uma ou mais variáveis no decorrer do tempo. No caso, cada programa seria uma label/legenda. Já o eixo x trariam dados temporais.
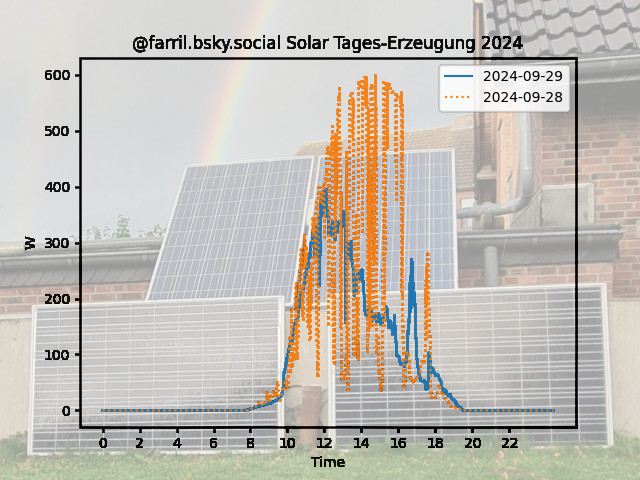
(automated) #Balkonsolar Tagesertrag: 1697.43Wh erzeugt am 2024-09-29 -26.19% Änderung gegenüber gestern