CC
Claudia C. Weber
@cc7740.bsky.social
Molecular evolution, genomes (lots of them, preferably weird), computational models. Cambridge, UK (she/her)
github.com/claudia-c-weber
236 followers297 following21 posts
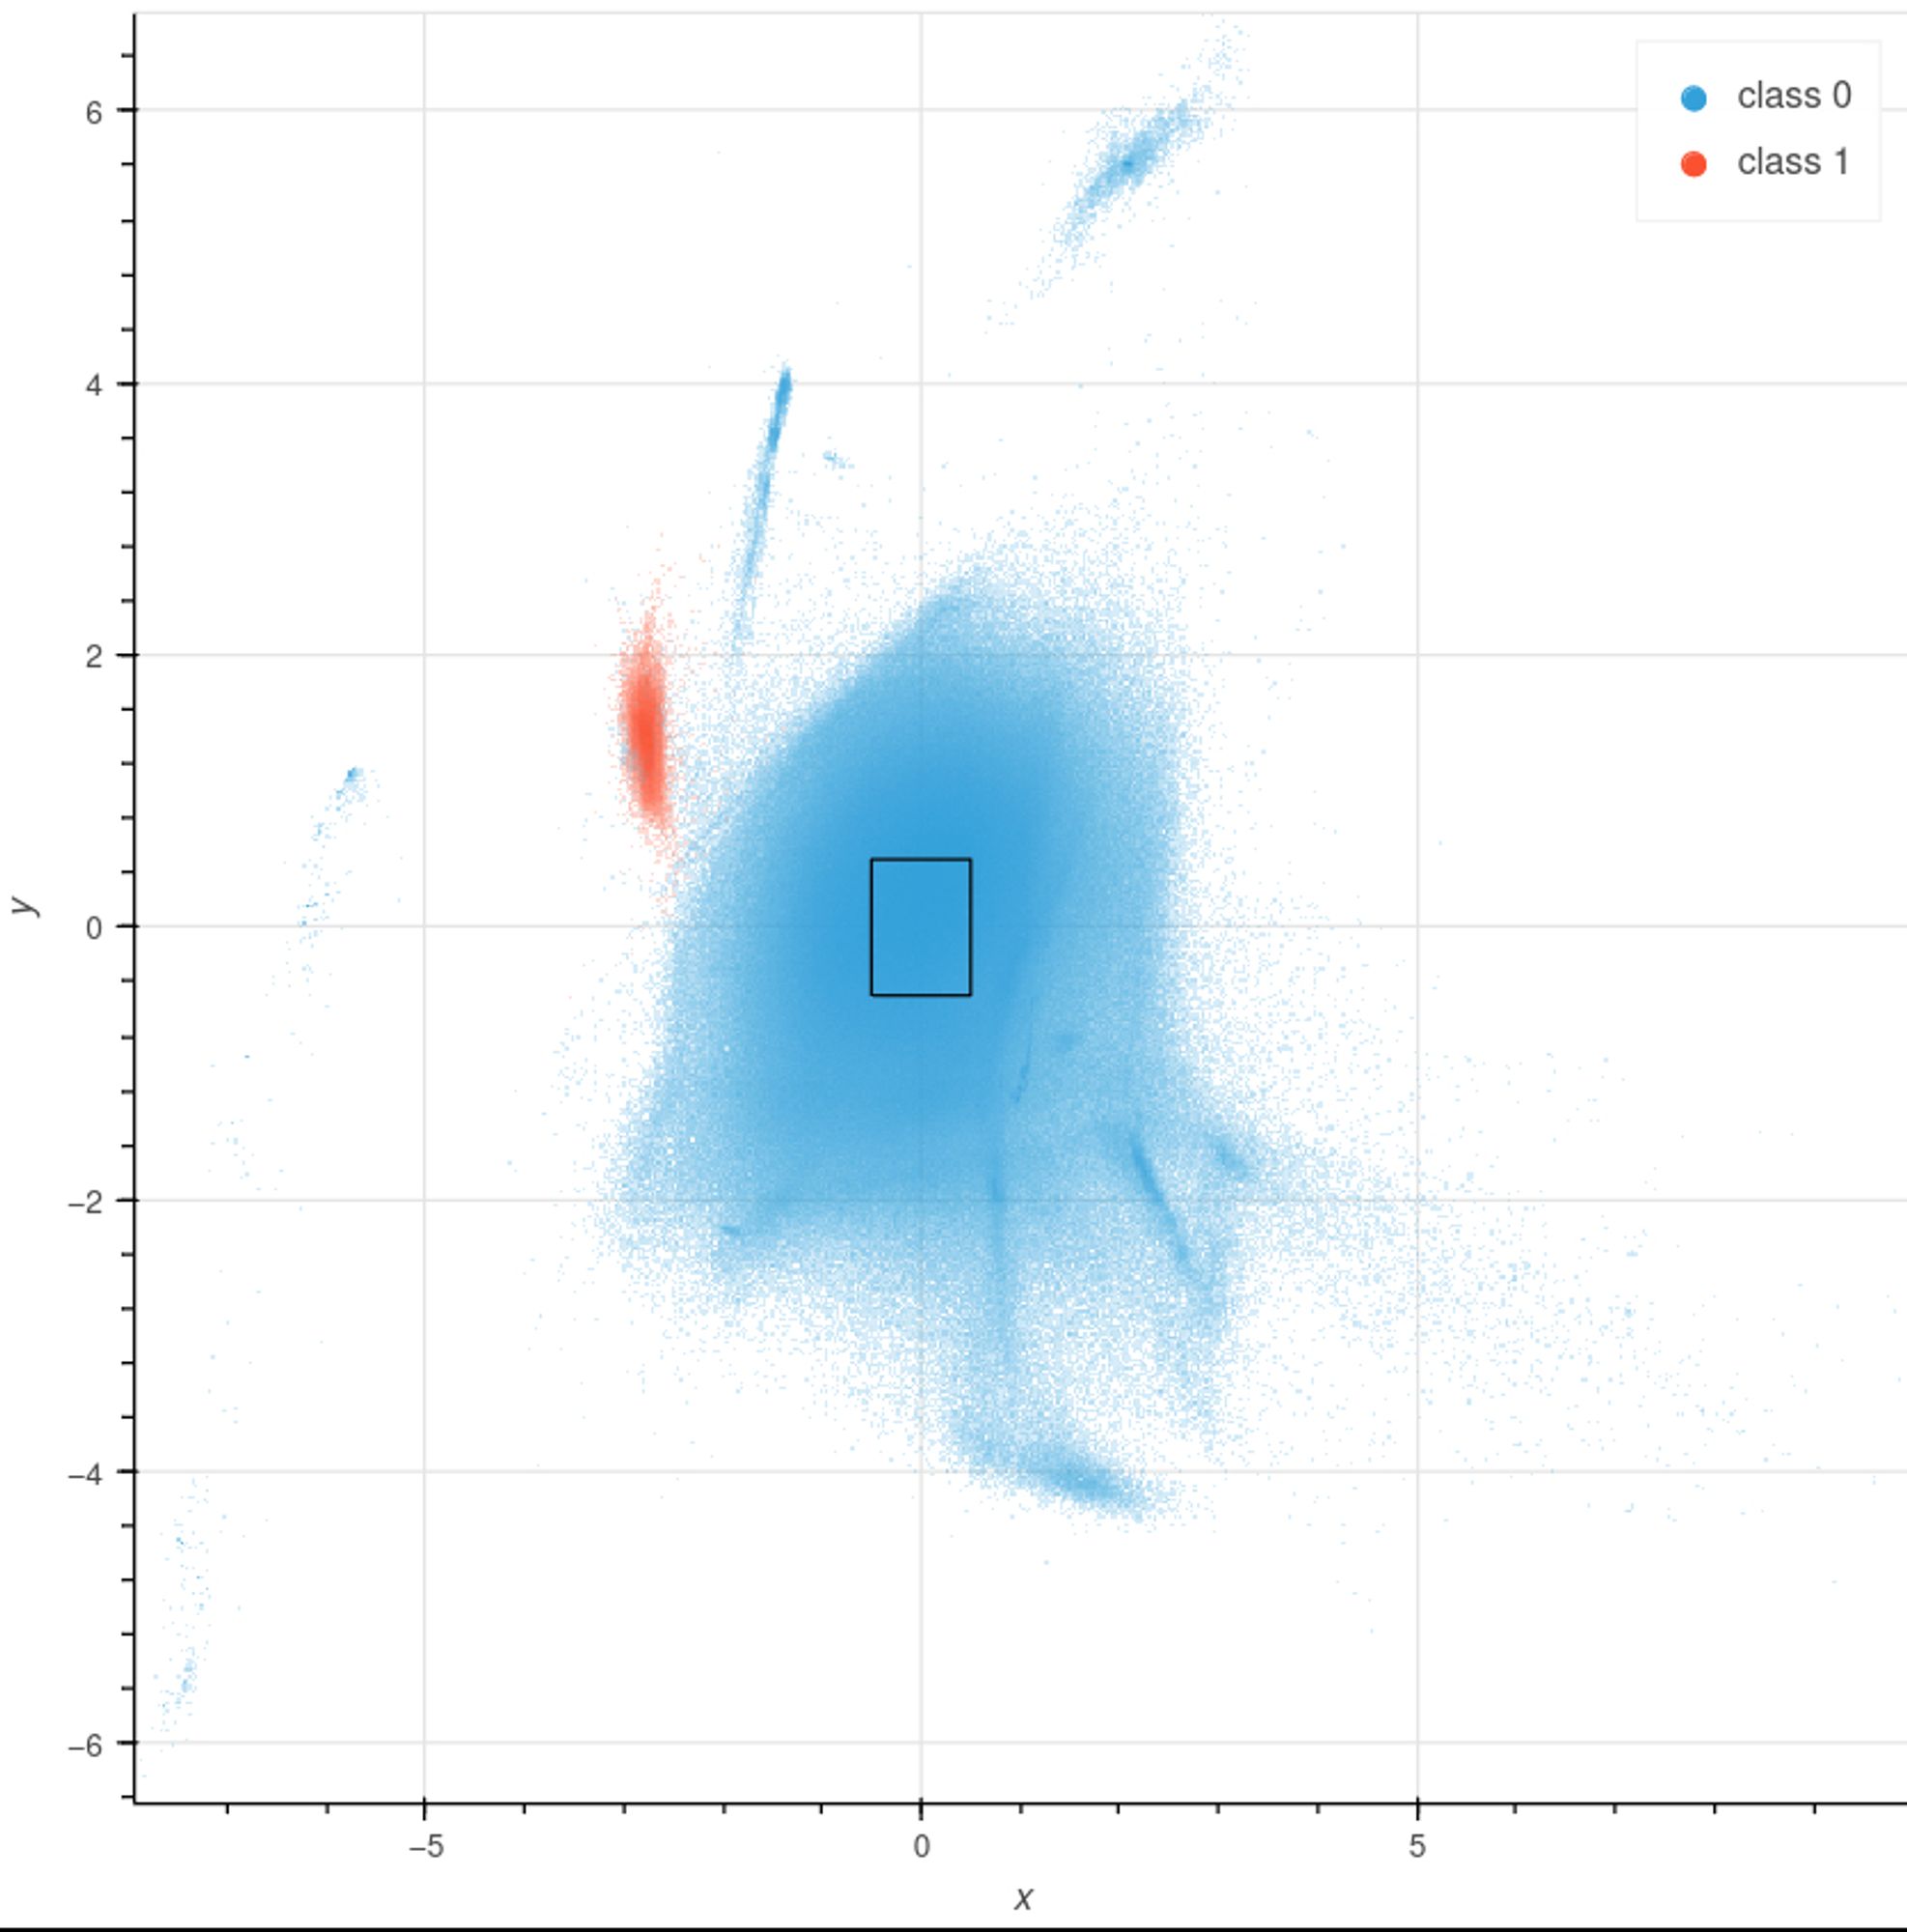
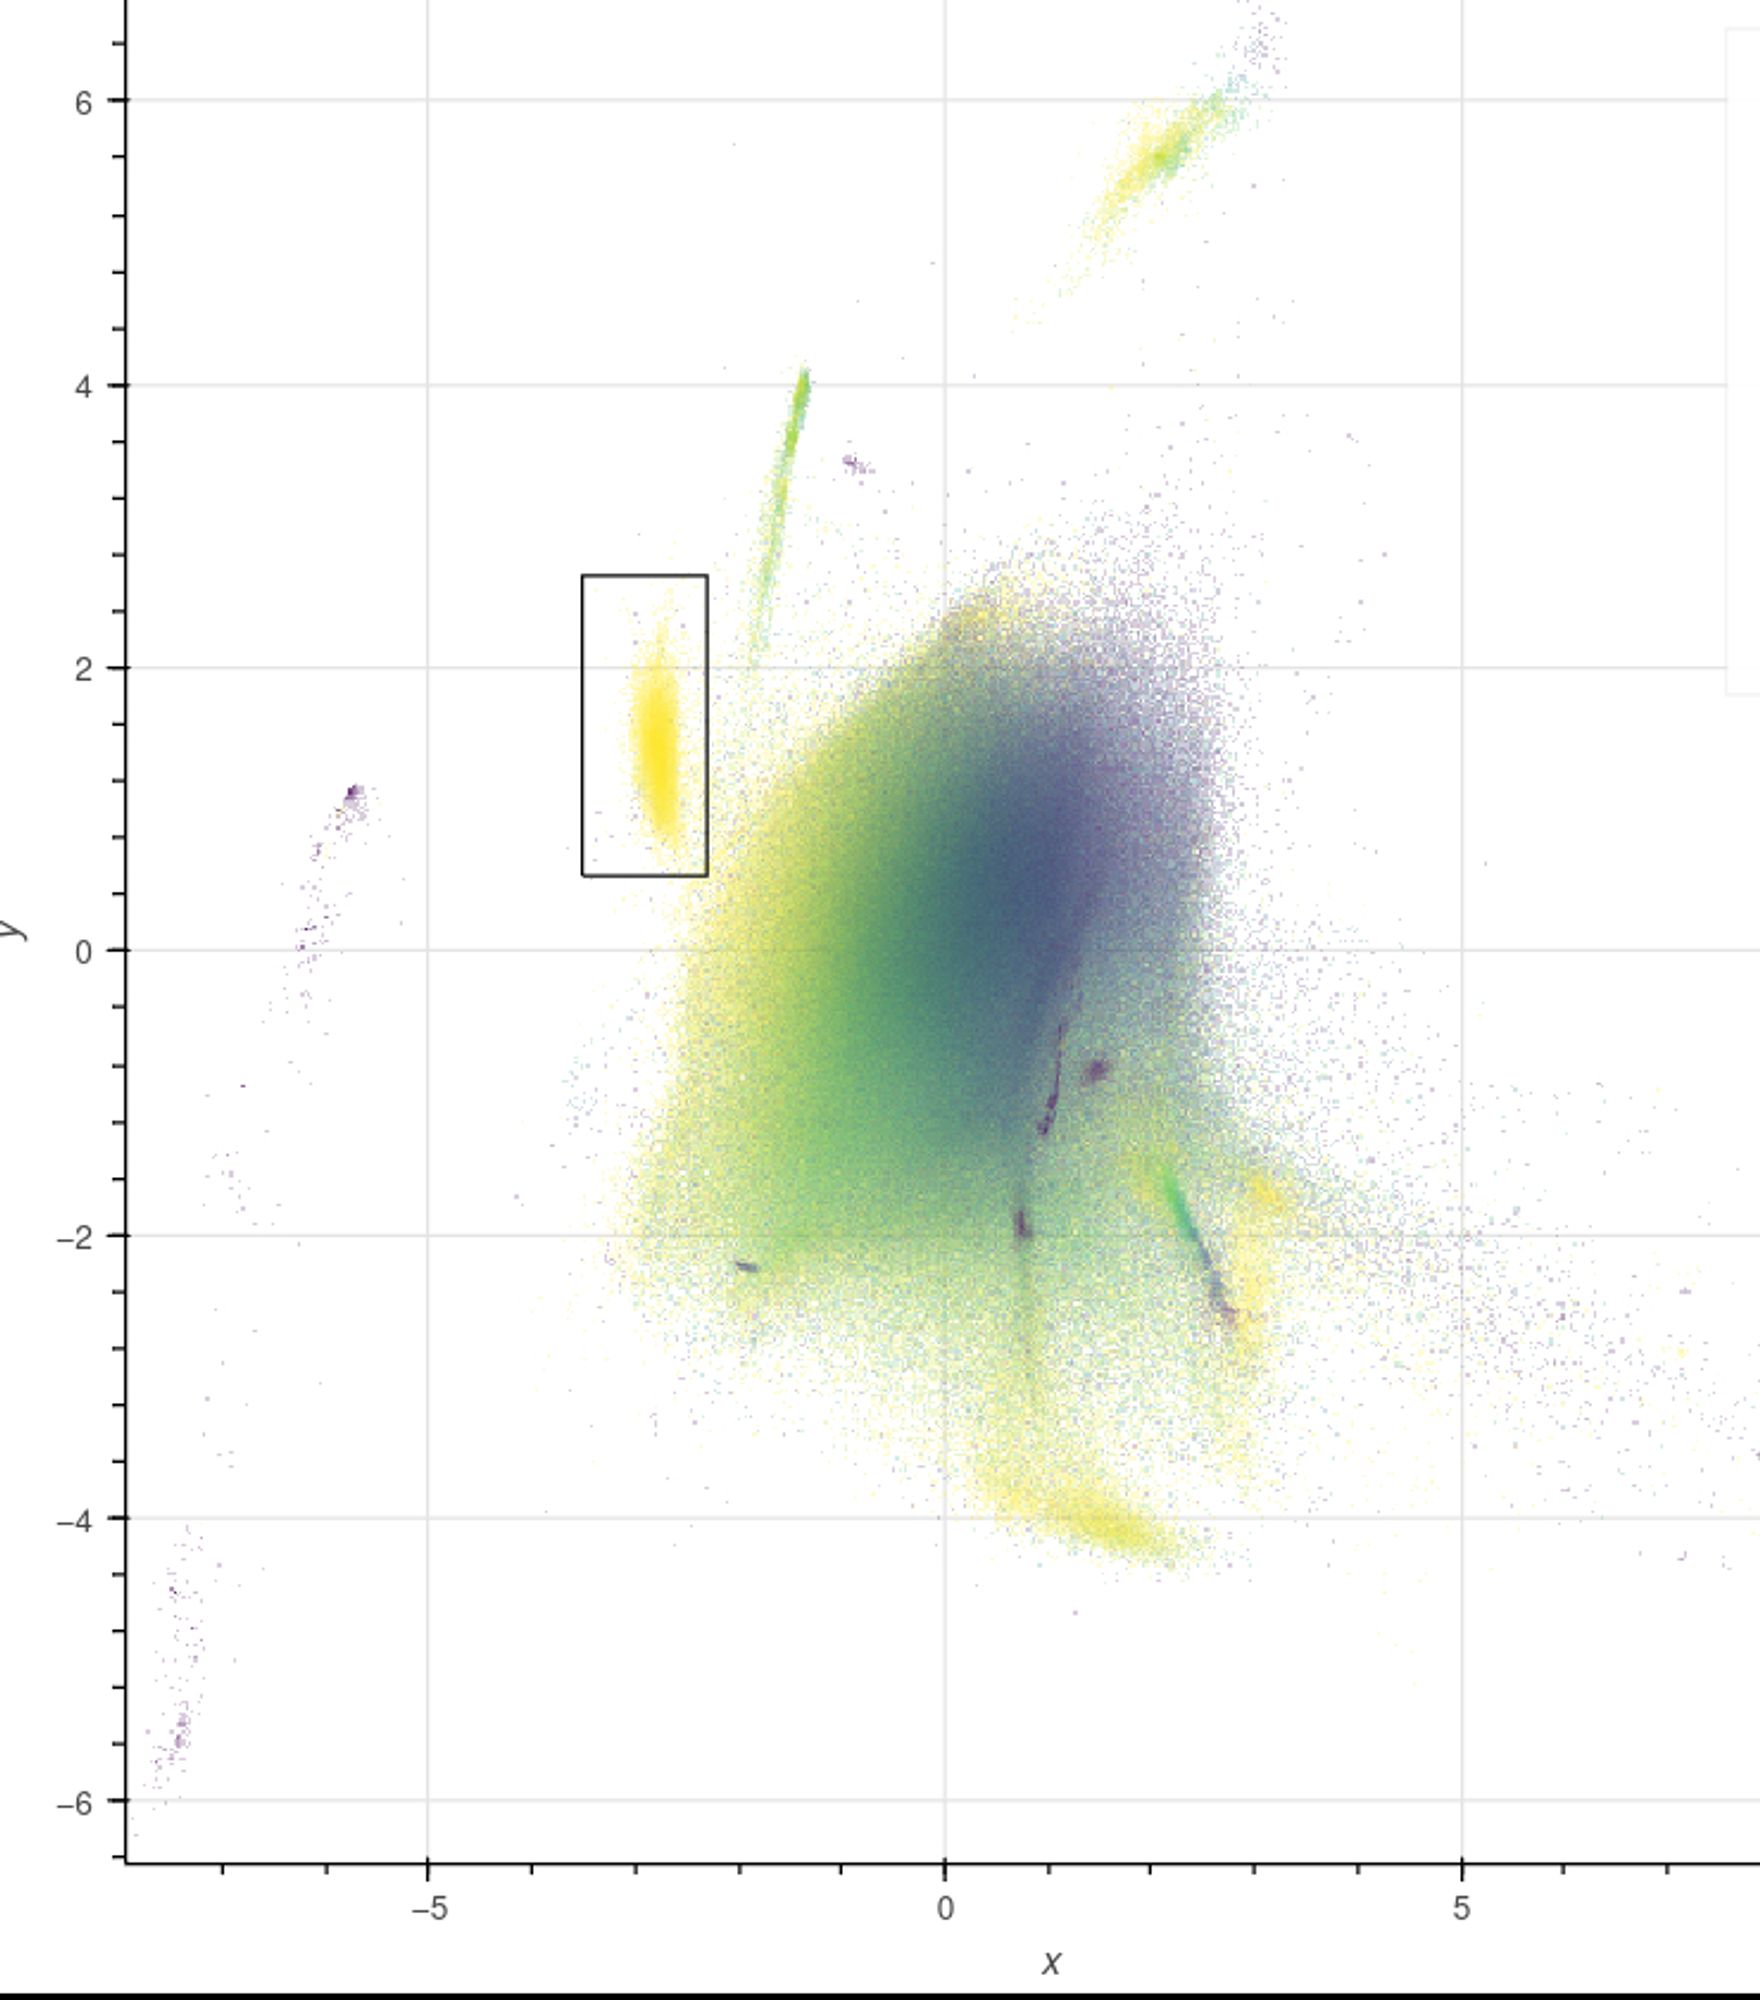
Given compositional differences, sequences from different sources form distinct clusters in the VAE’s latent space. For example, the pictured moth (blue) is infected with Wolbachia (red). No labels? Discrepancies in coverage and coding density (second image) often provide clues.
…and there are widgets to filter, query, and extract sequences for downstream analysis. For code and more examples, see: github.com/CobiontID/re...
GitHub - CobiontID/read_VAE: VAE-based framework to explore long-read datasets and identify potential contaminants or cobionts
VAE-based framework to explore long-read datasets and identify potential contaminants or cobionts - CobiontID/read_VAE
CC
Claudia C. Weber
@cc7740.bsky.social
Molecular evolution, genomes (lots of them, preferably weird), computational models. Cambridge, UK (she/her)
github.com/claudia-c-weber
236 followers297 following21 posts