A new study from MBARI researchers and their collaborators using SOCCOM float data has revealed that storms trigger the release of carbon dioxide from the ocean. This work will help improve models used for forecasting our changing climate. Dive in: www.mbari.org/news/new-res...
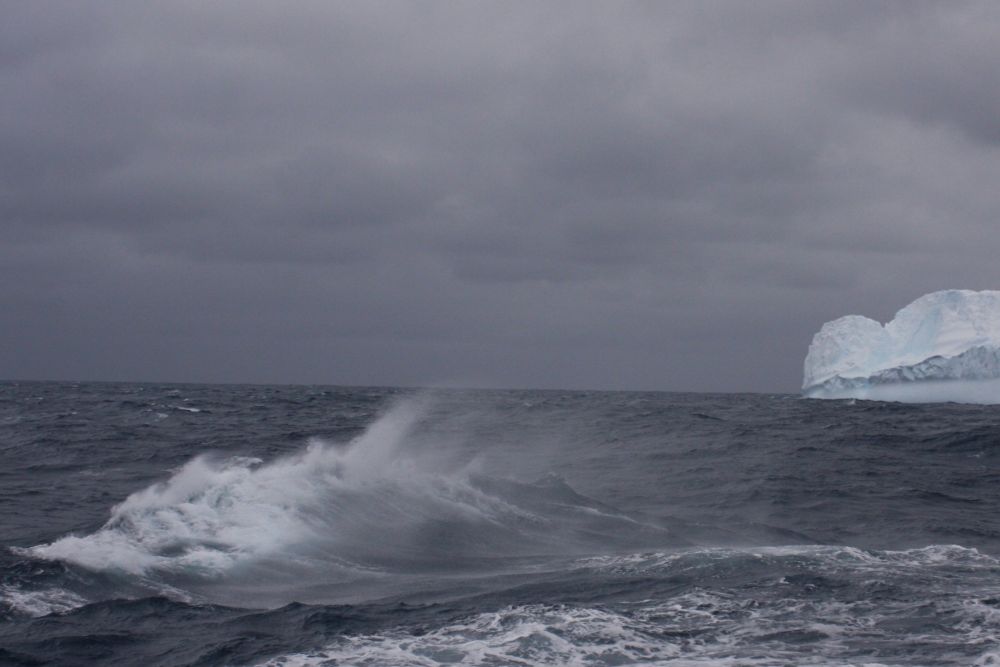
Observations collected by SOCCOM’s network of robotic floats provide new information about how frequent storms in this remote region can affect the ocean’s ability to absorb carbon dioxide.
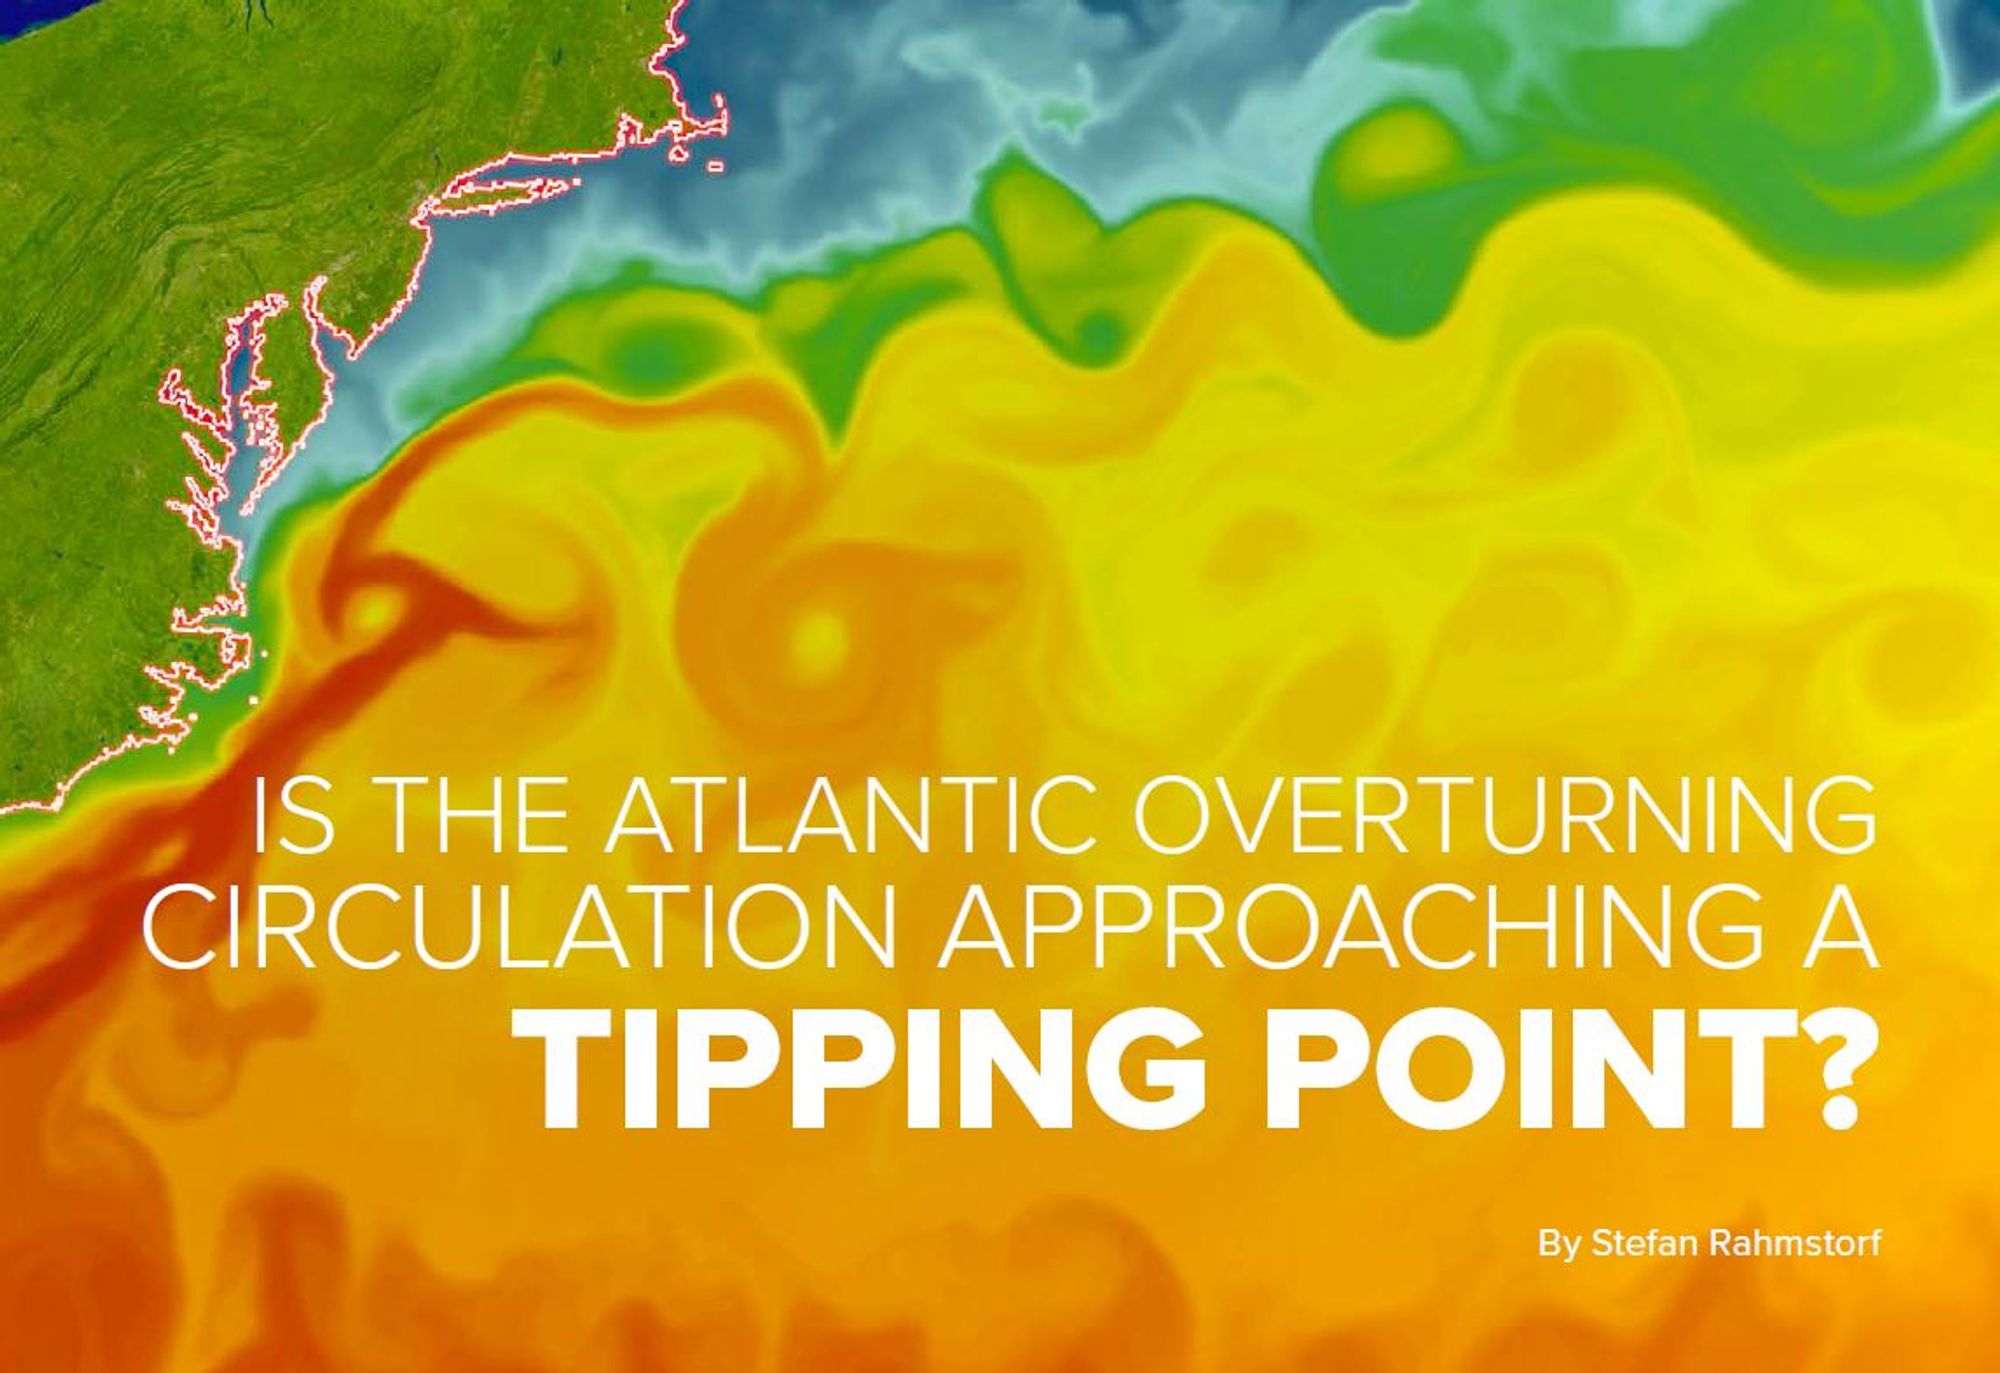
This is a must-read about one of the most important components of the climate system. Very well written, easy to understand and very comprehensive. This will enable you to understand why there is a debate about the AMOC tipping point and why it is so extremely important.
Summarising 2023 for you - 202 days were the highest temp on record for that day - That's 55% of the year - The records were broken by a margin that was itself record-breaking - We can slow down and then eventually stop this getting worse by eradicating fossil fuels ASAP - 2024 may be worse
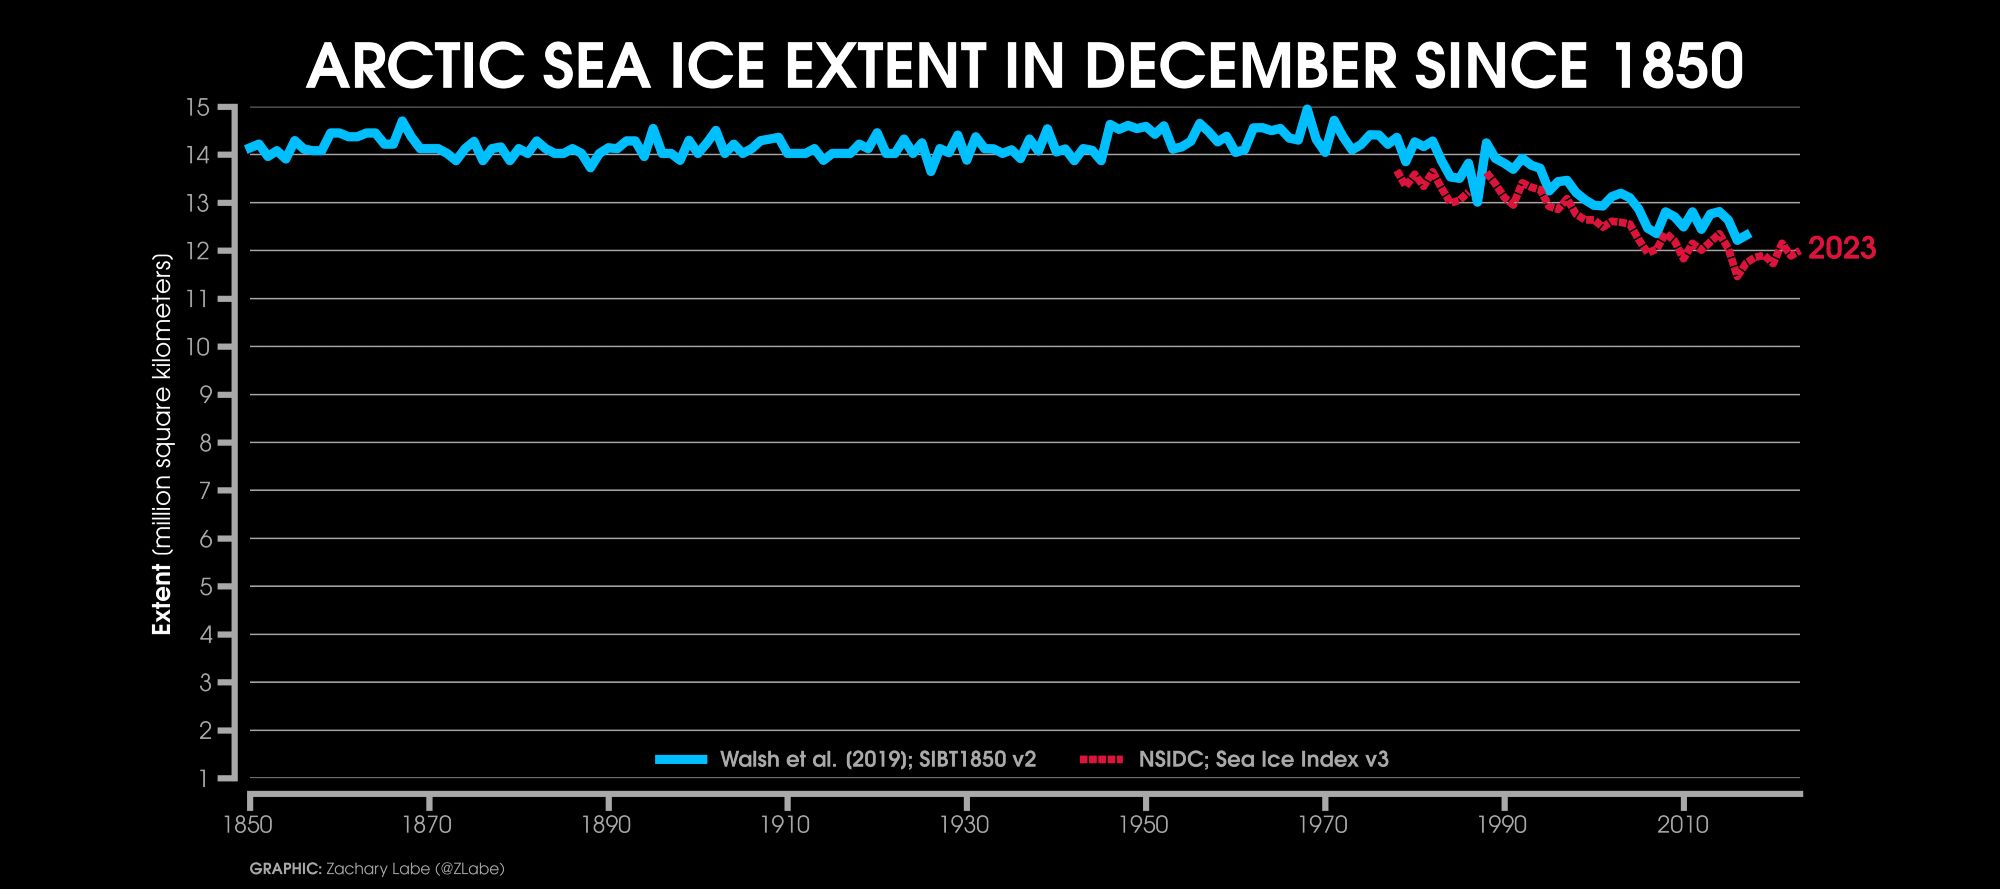
A longer perspective for December Arctic sea ice extent (since the year 1850)... You can read more about this dataset at carbonbrief.org/guest-post-p...
Its now official: 2023 was the warmest year on record in the JRA-55 dataset, at 1.43C above preindustrial levels. It beat the prior record set in 2016 by 0.14C, and continues a rapid warming trend thats seen global temperatures rise around 1C since 1970.

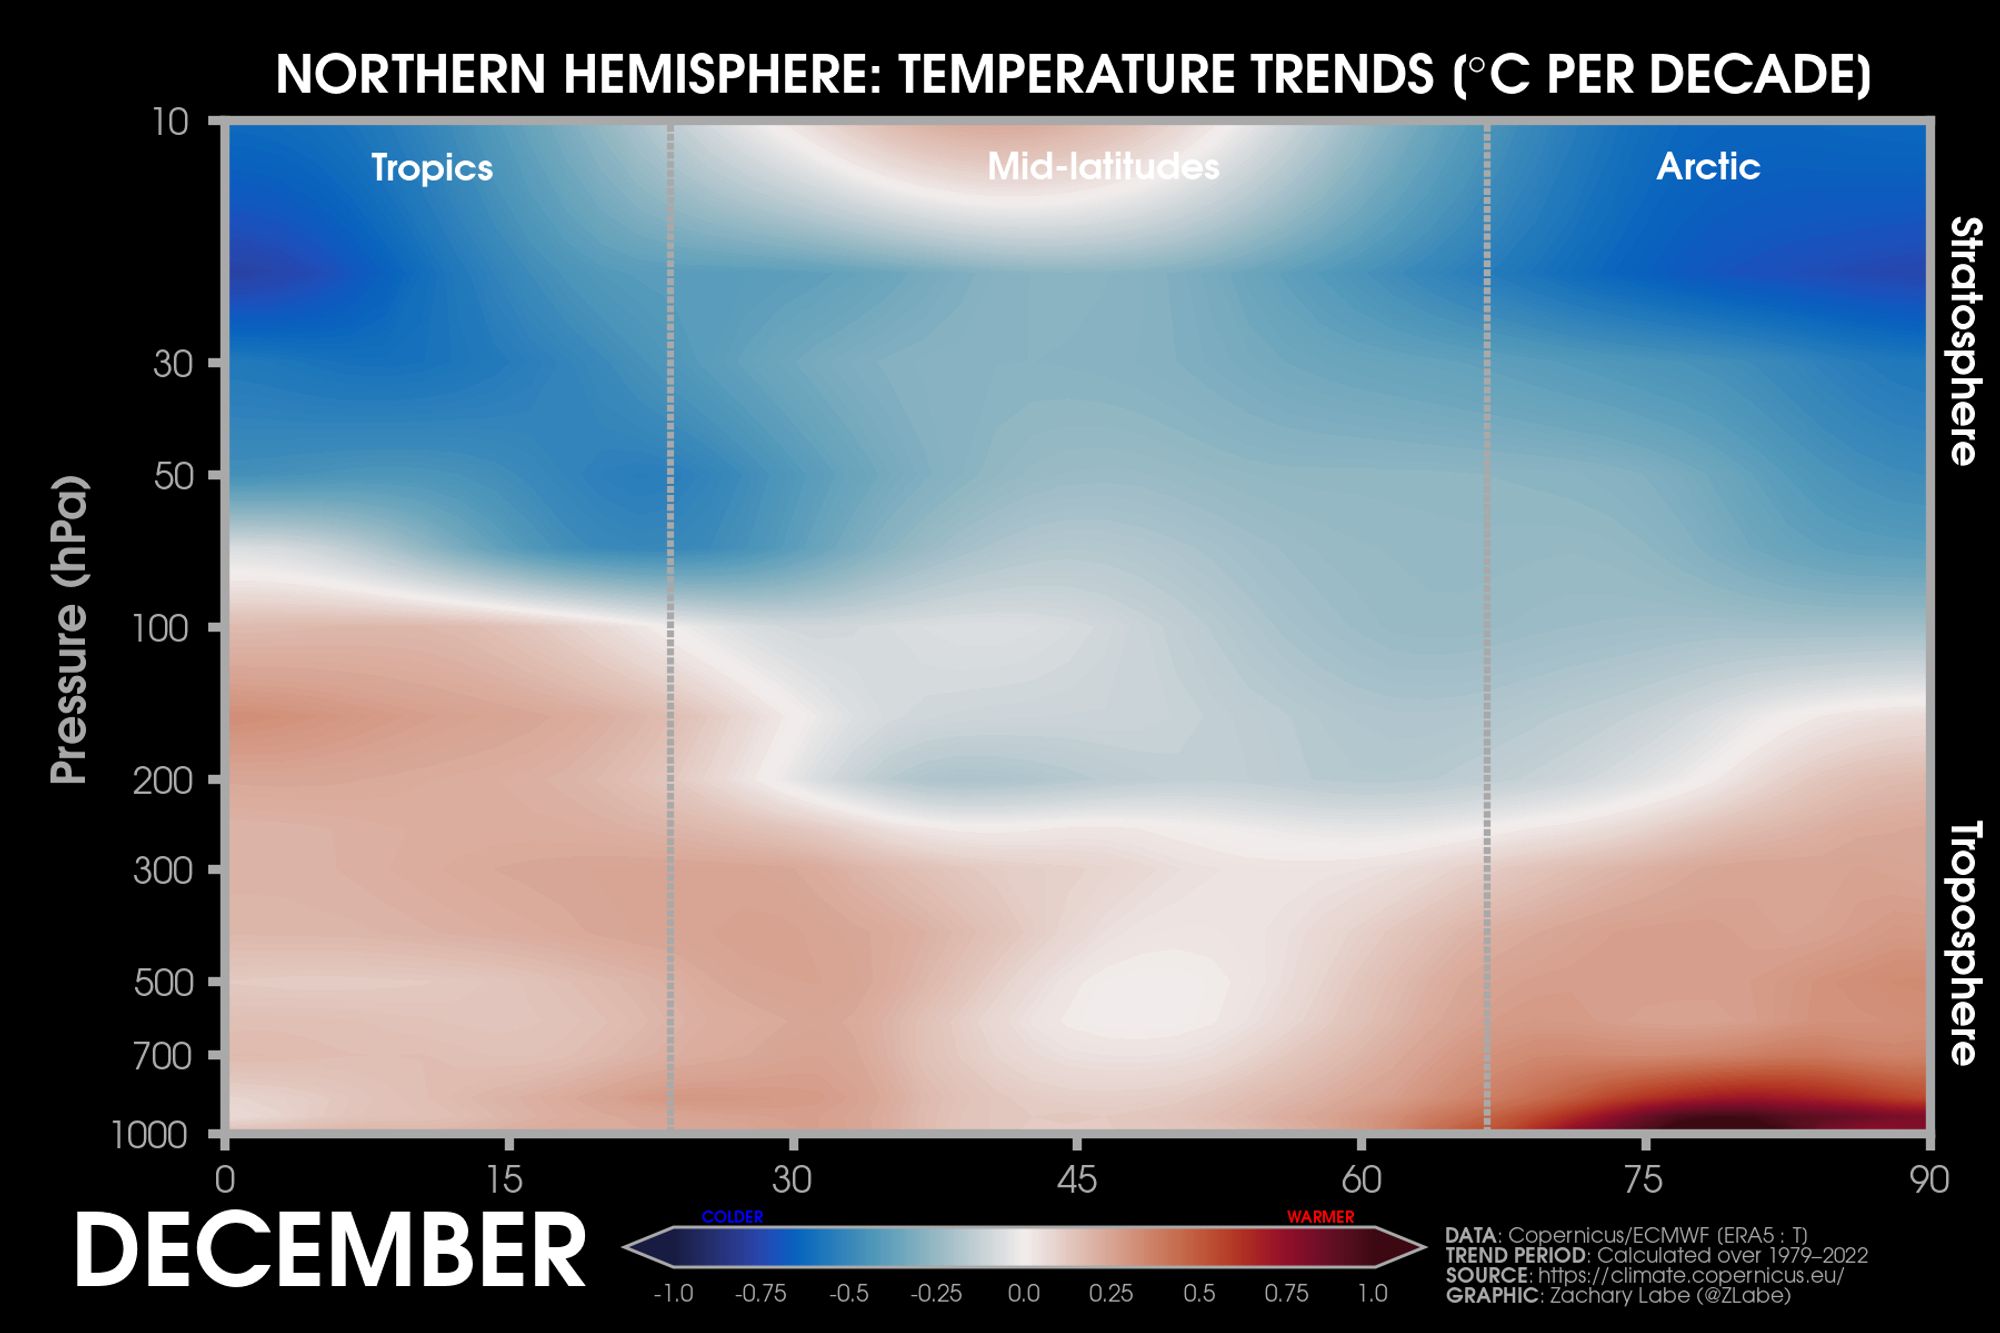
Warming is not only confined to the surface in December, but also extends vertically aloft. There are numerous feedbacks which contribute to Arctic amplification (i.e., not just sea ice loss). Data from ECMWF ERA5. For more info: doi.org/10.1029/2020...
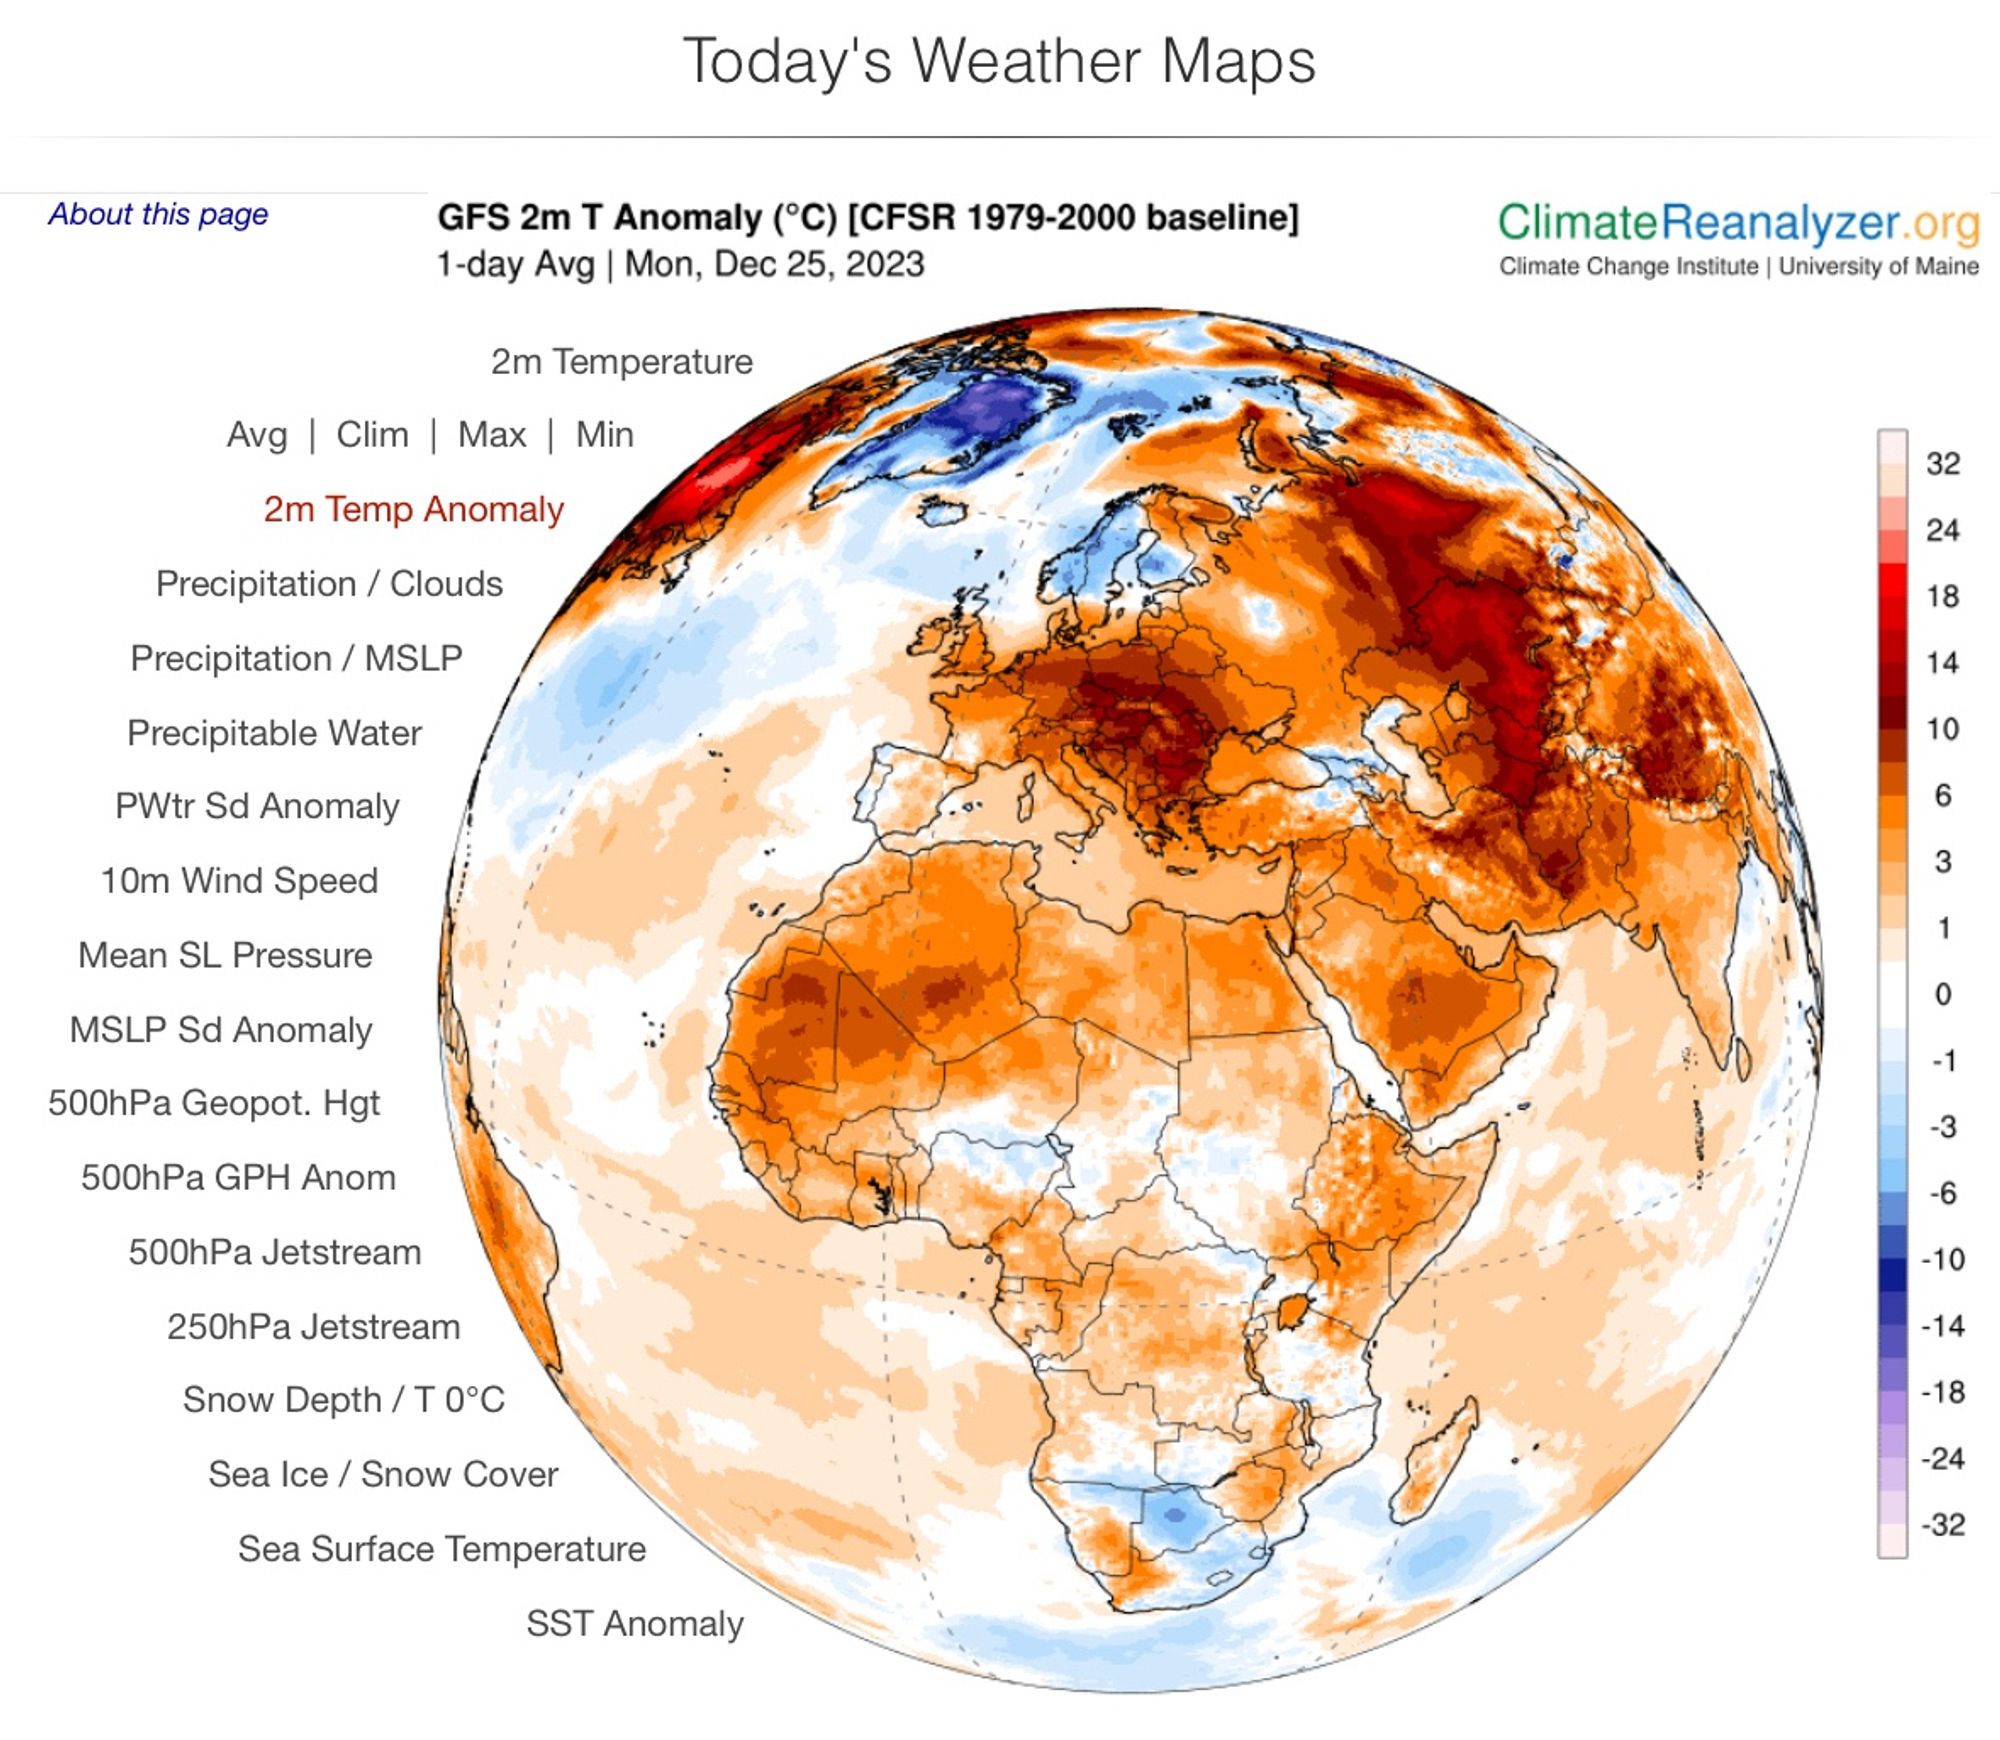
Today‘s temperature deviation, relative to the average 25 Dec during the period 1979-2000. Some areas are 18°C or more warmer than normal. Where “normal” is a time interval already affected by global warming.
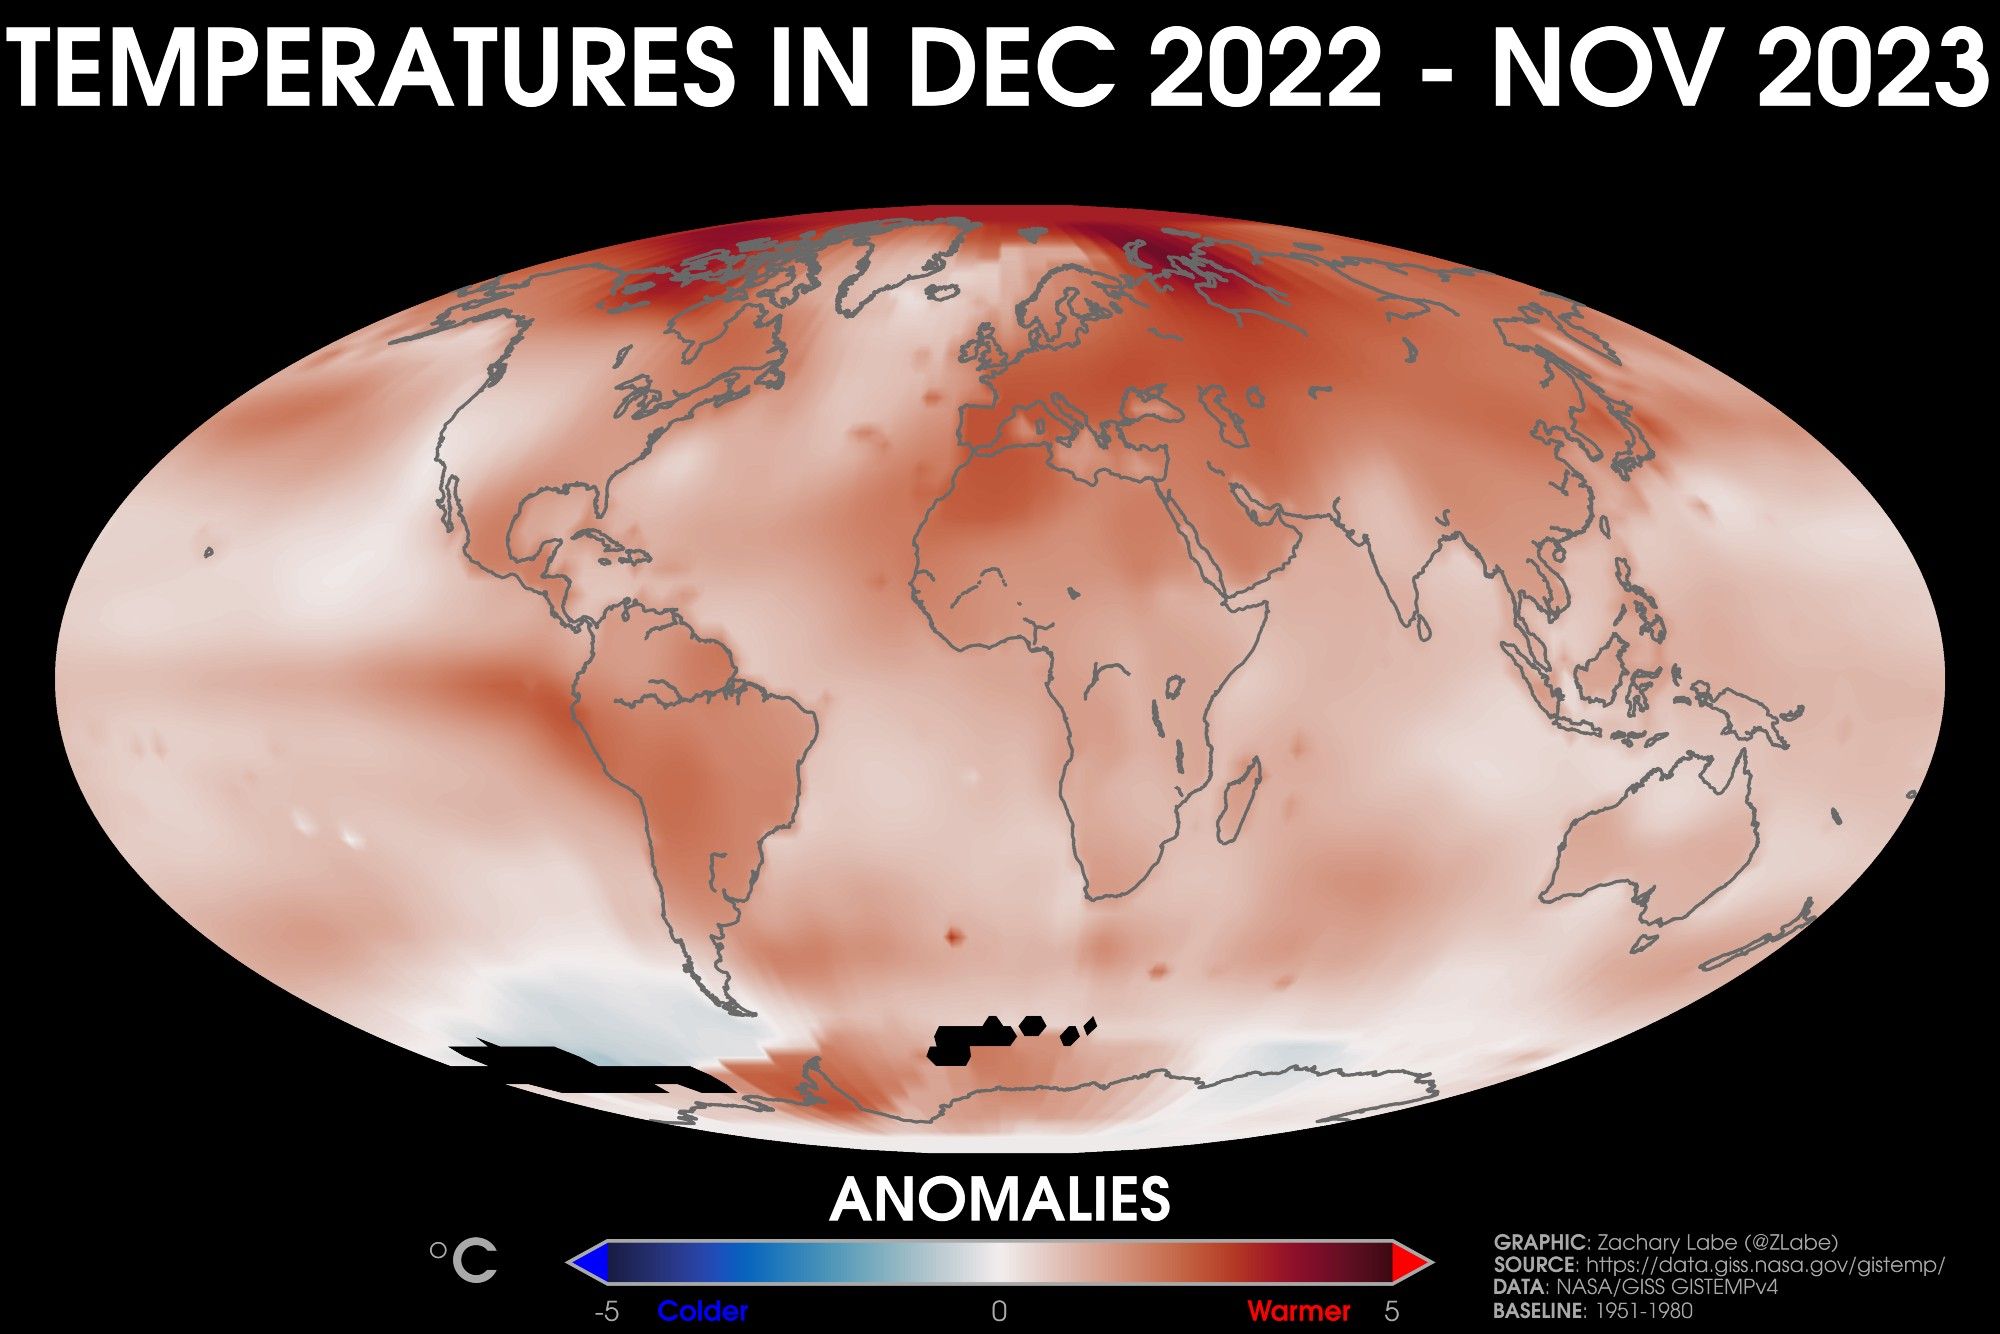
Reflecting back at temperatures over the last 12 months, and it's really quite revealing... 🟥 Warmer than average 🟦 Colder than average For more information on methods: data.giss.nasa.gov/gistemp/faq/
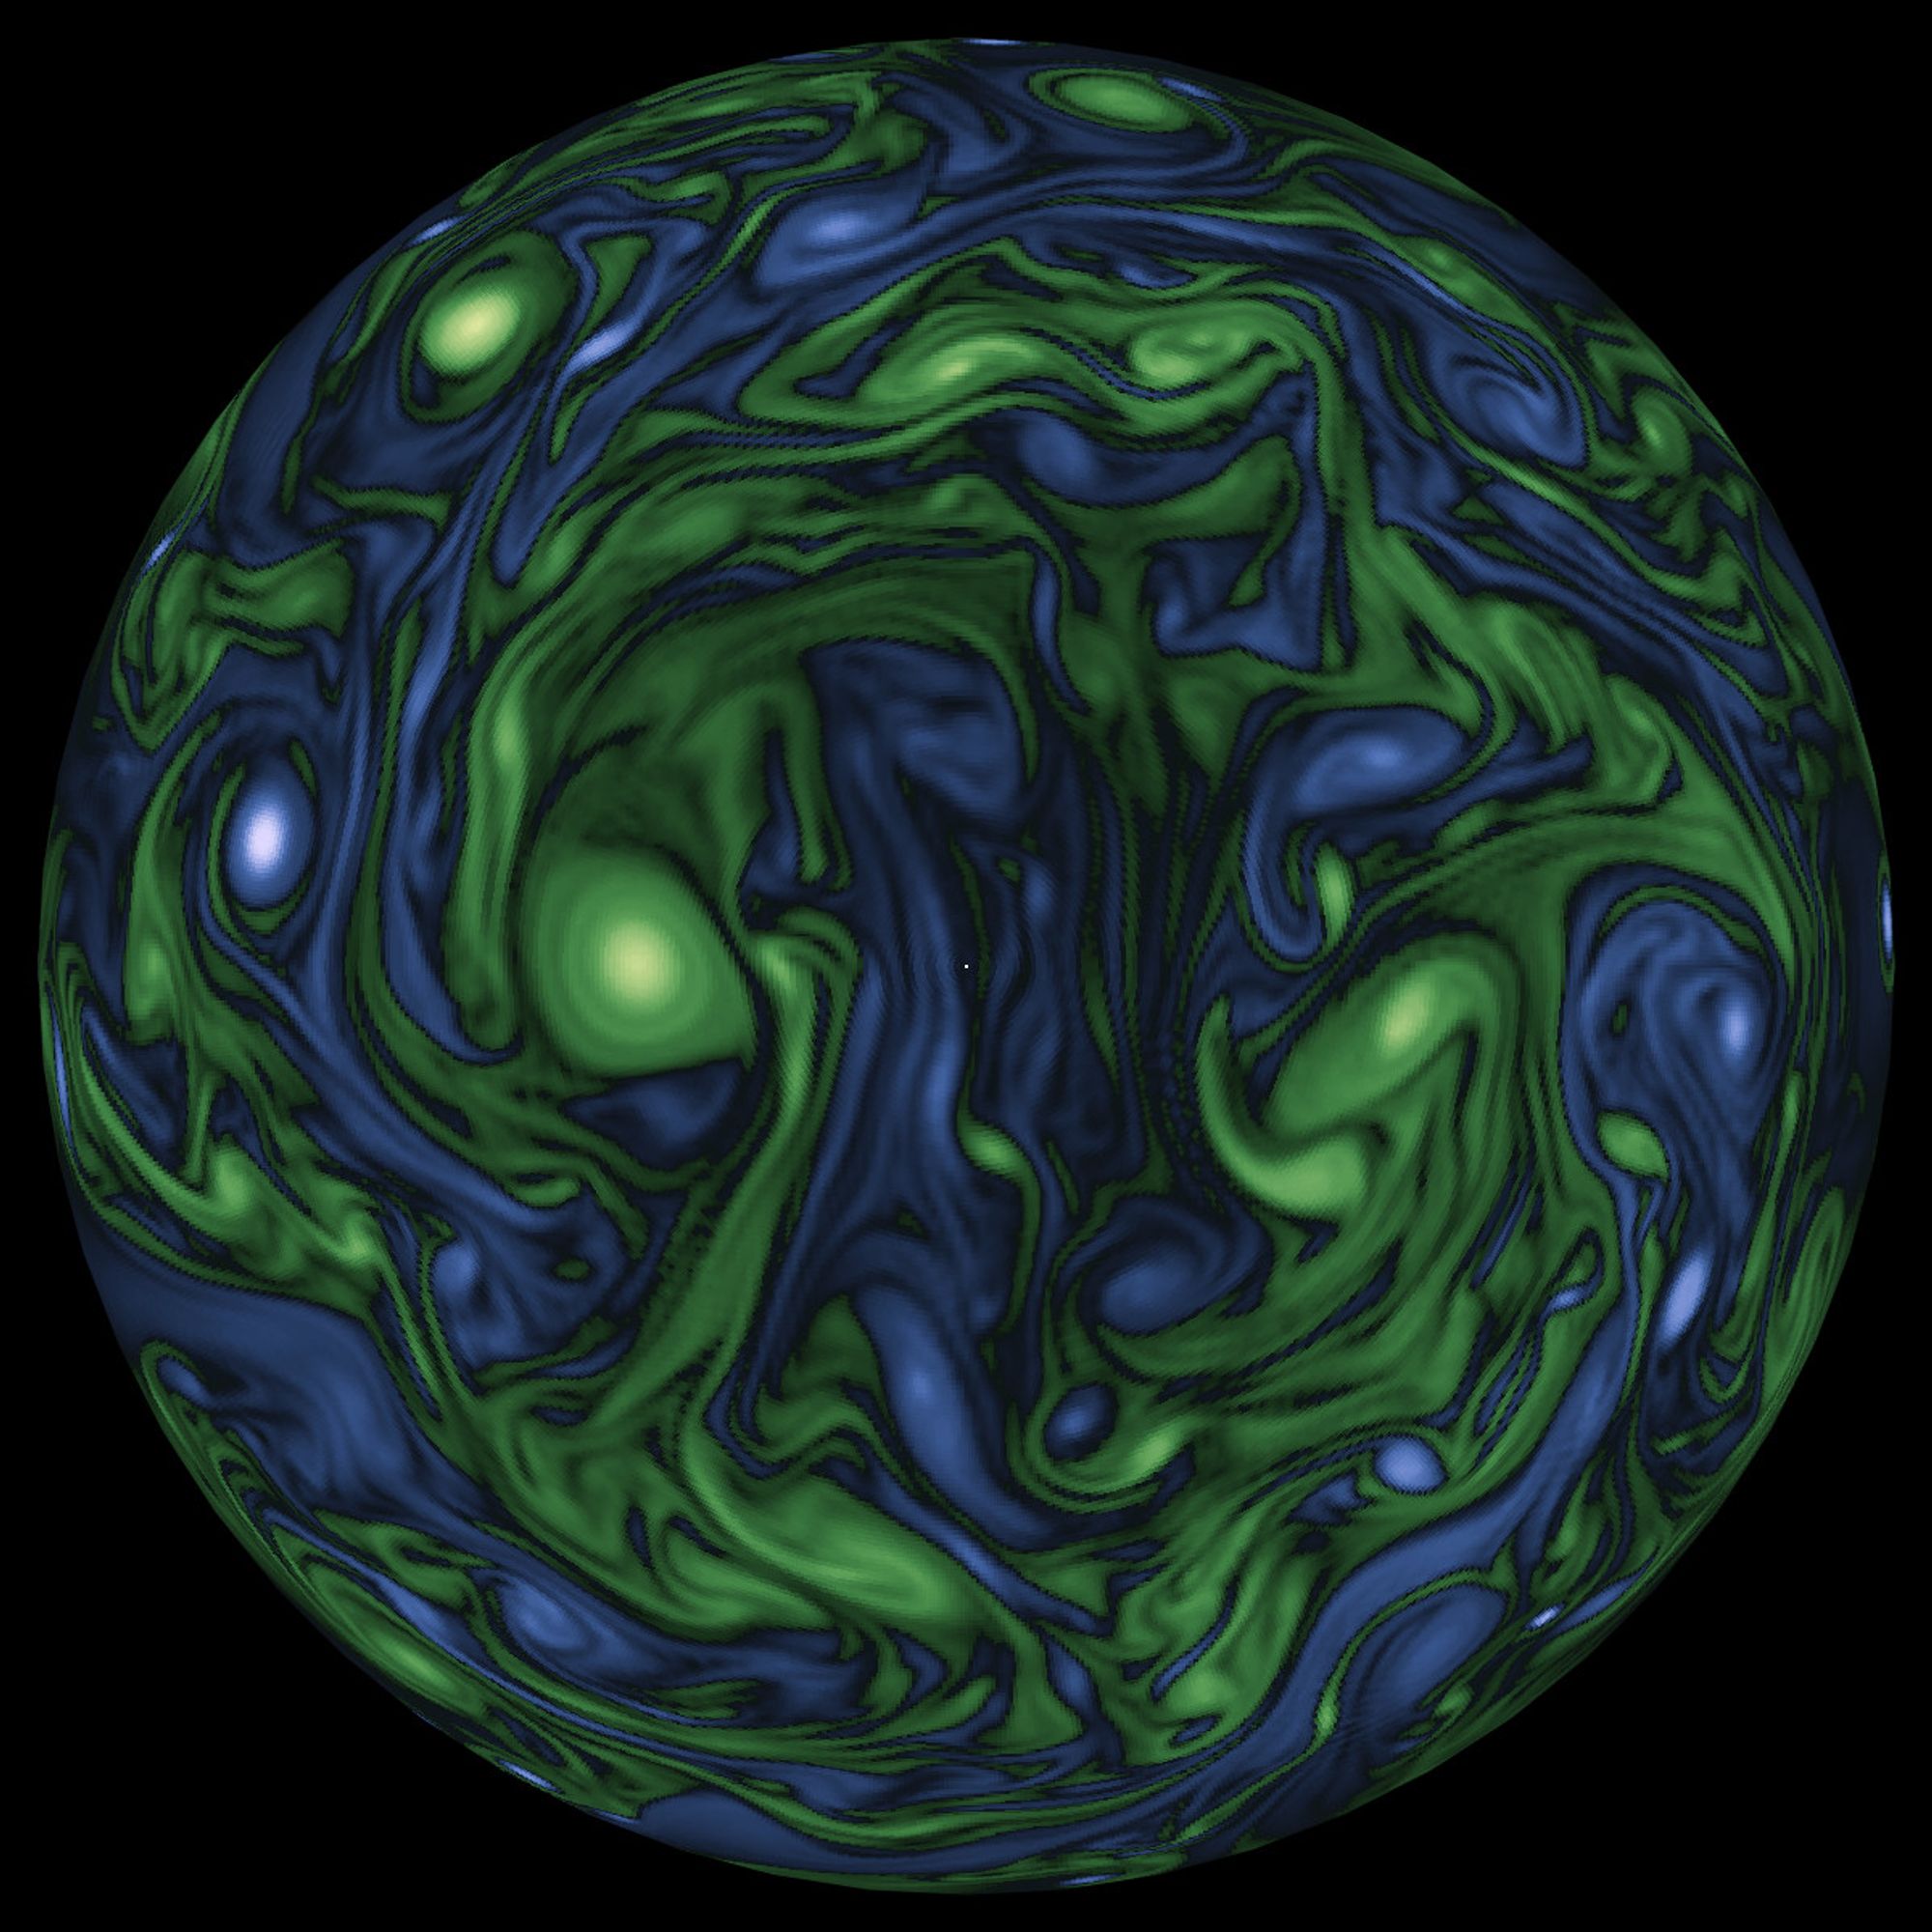
Celebrating SpeedyWeather.jl v0.7, our new atmospheric general circulation model! Here just some stochastically stirred barotropic vorticity at T341 resolution (40km global) looking straight down on the north pole! Check out the video in our gallery! github.com/SpeedyWeathe...