BLUE
Profile banner
EA
Elmera Azadpour
@eazadpour.bsky.social
45 followers30 following5 posts
EAeazadpour.bsky.social

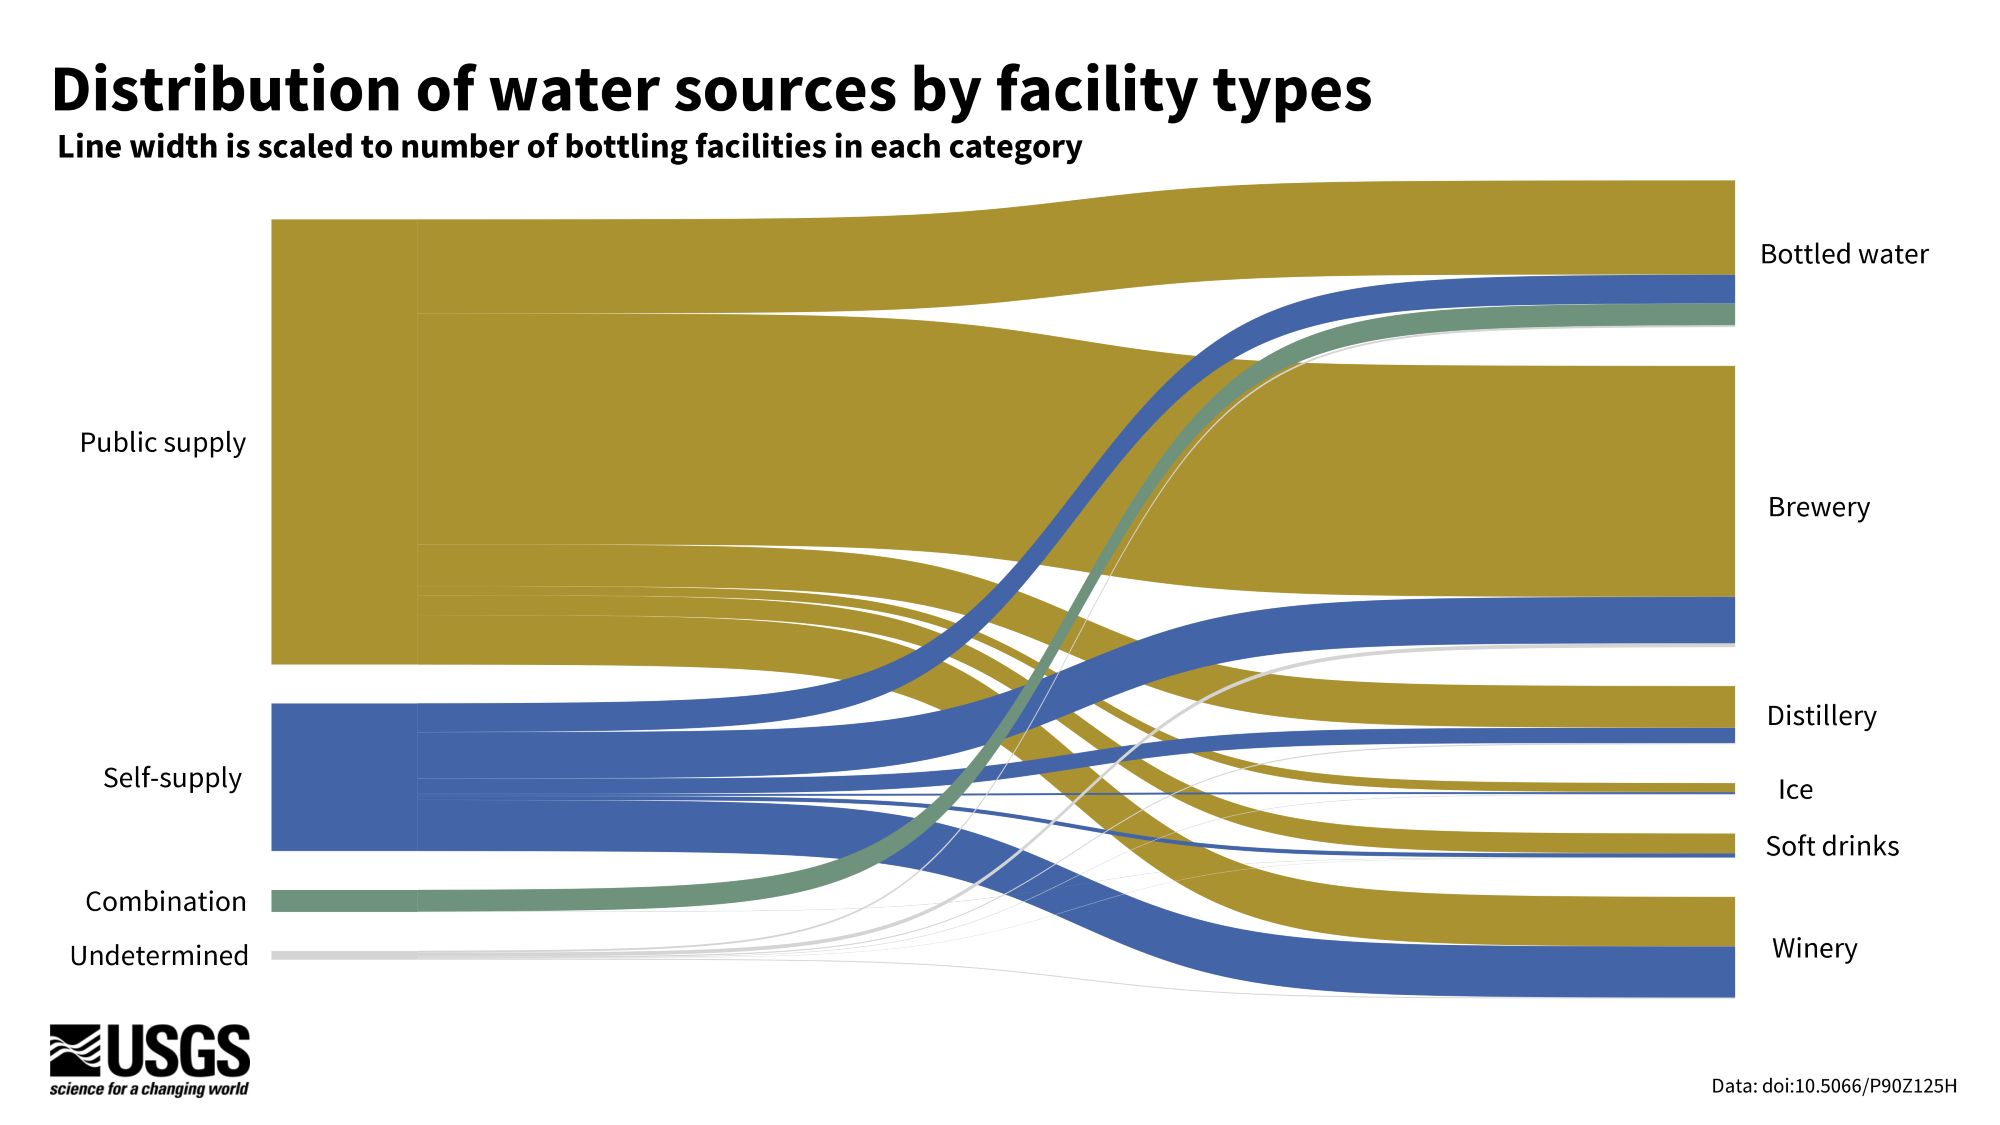
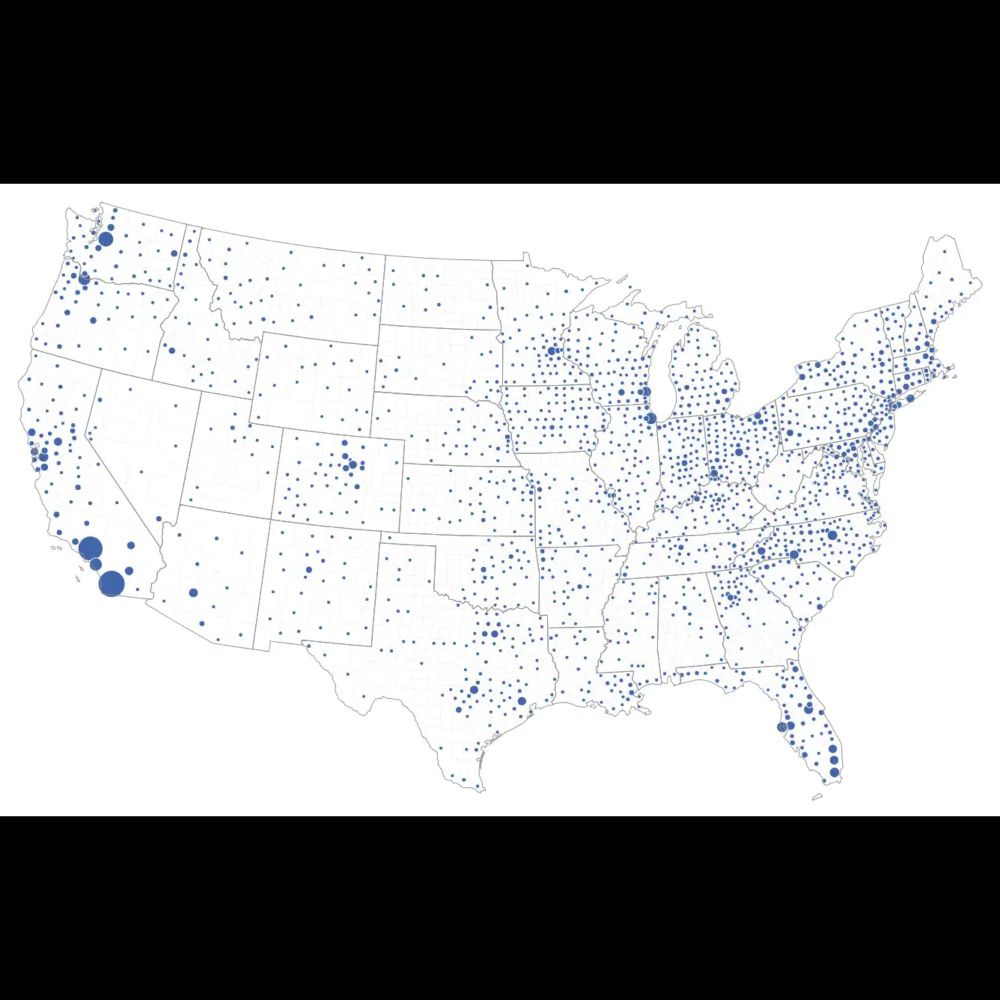
Public supply is the source of water for many beverage facilities, but water source varies by facility type. Here we show water sources across facility type for the U.S. where line thickness is scaled to the # of facilities in each category. Learn more at: labs.waterdata.usgs.gov/visualizatio...

Sankey diagram showing proportions of water source types reported by bottling facilities in the U.S. Source categories are public supply, self-supply, combination, or undetermined. Combination can be defined as a mix of sources. Bottling facility types include bottled water, brewery, distillery, ice, soft drinks, and winery. Public supply is the source reported by the largest number of facilities (30,965) with the respective order of brewery, bottled water, winery, distillery, soft drinks, and ice. Self-supply is the source reported by the second largest number of facilities (10,267) with the respective order of winery, brewery, bottled water, distillery, soft drinks, and ice. Data available at doi:10.5066/P90Z125H.
0
EAeazadpour.bsky.social

Access the inventory and water use data here: www.sciencebase.gov/catalog/item...

0
EAeazadpour.bsky.social

Learn more about water availability impacts from extraction of water for bottling with next steps including regional assessments and changes to local groundwater and water quality:  www.usgs.gov/mission-area...

1
Reposted by Elmera Azadpour
Cceenell.bsky.social

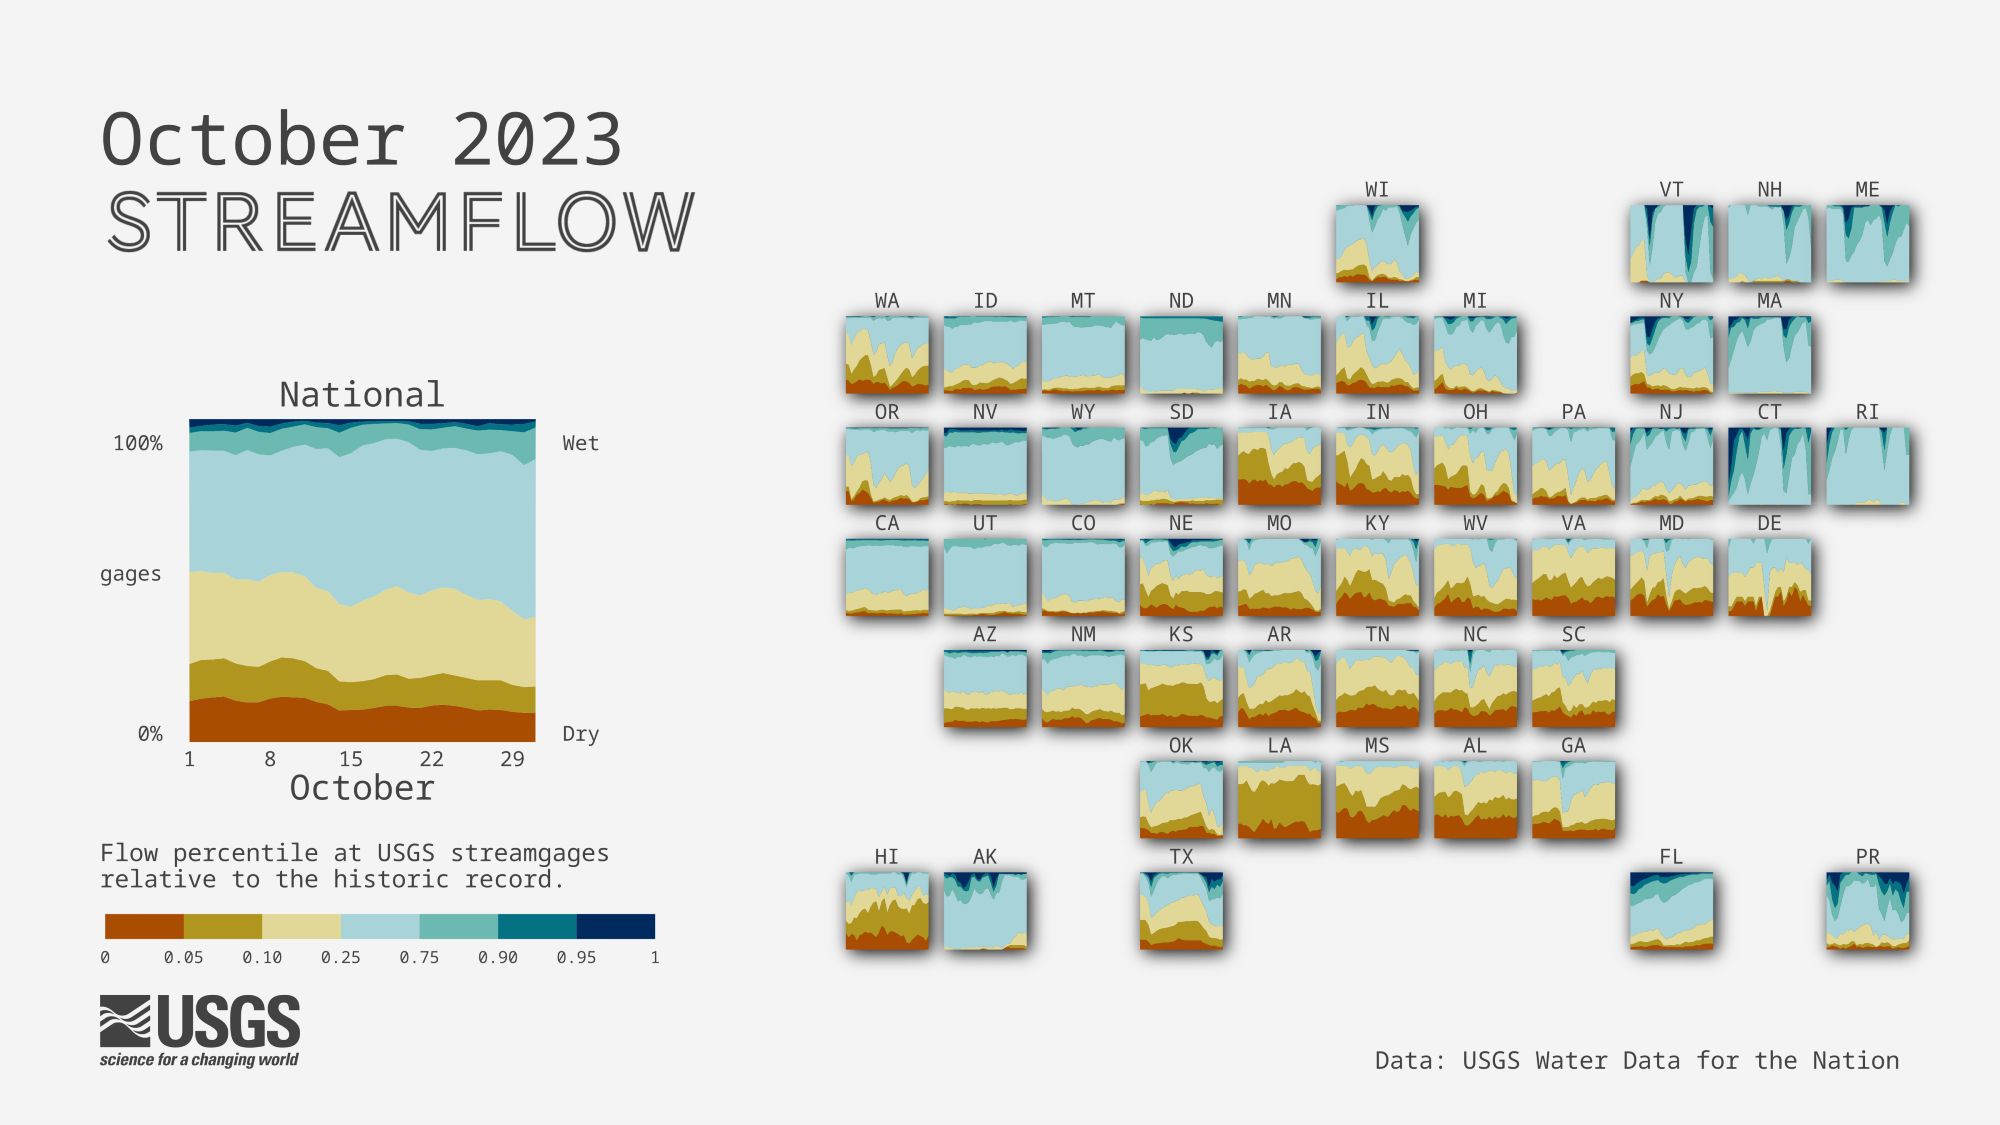
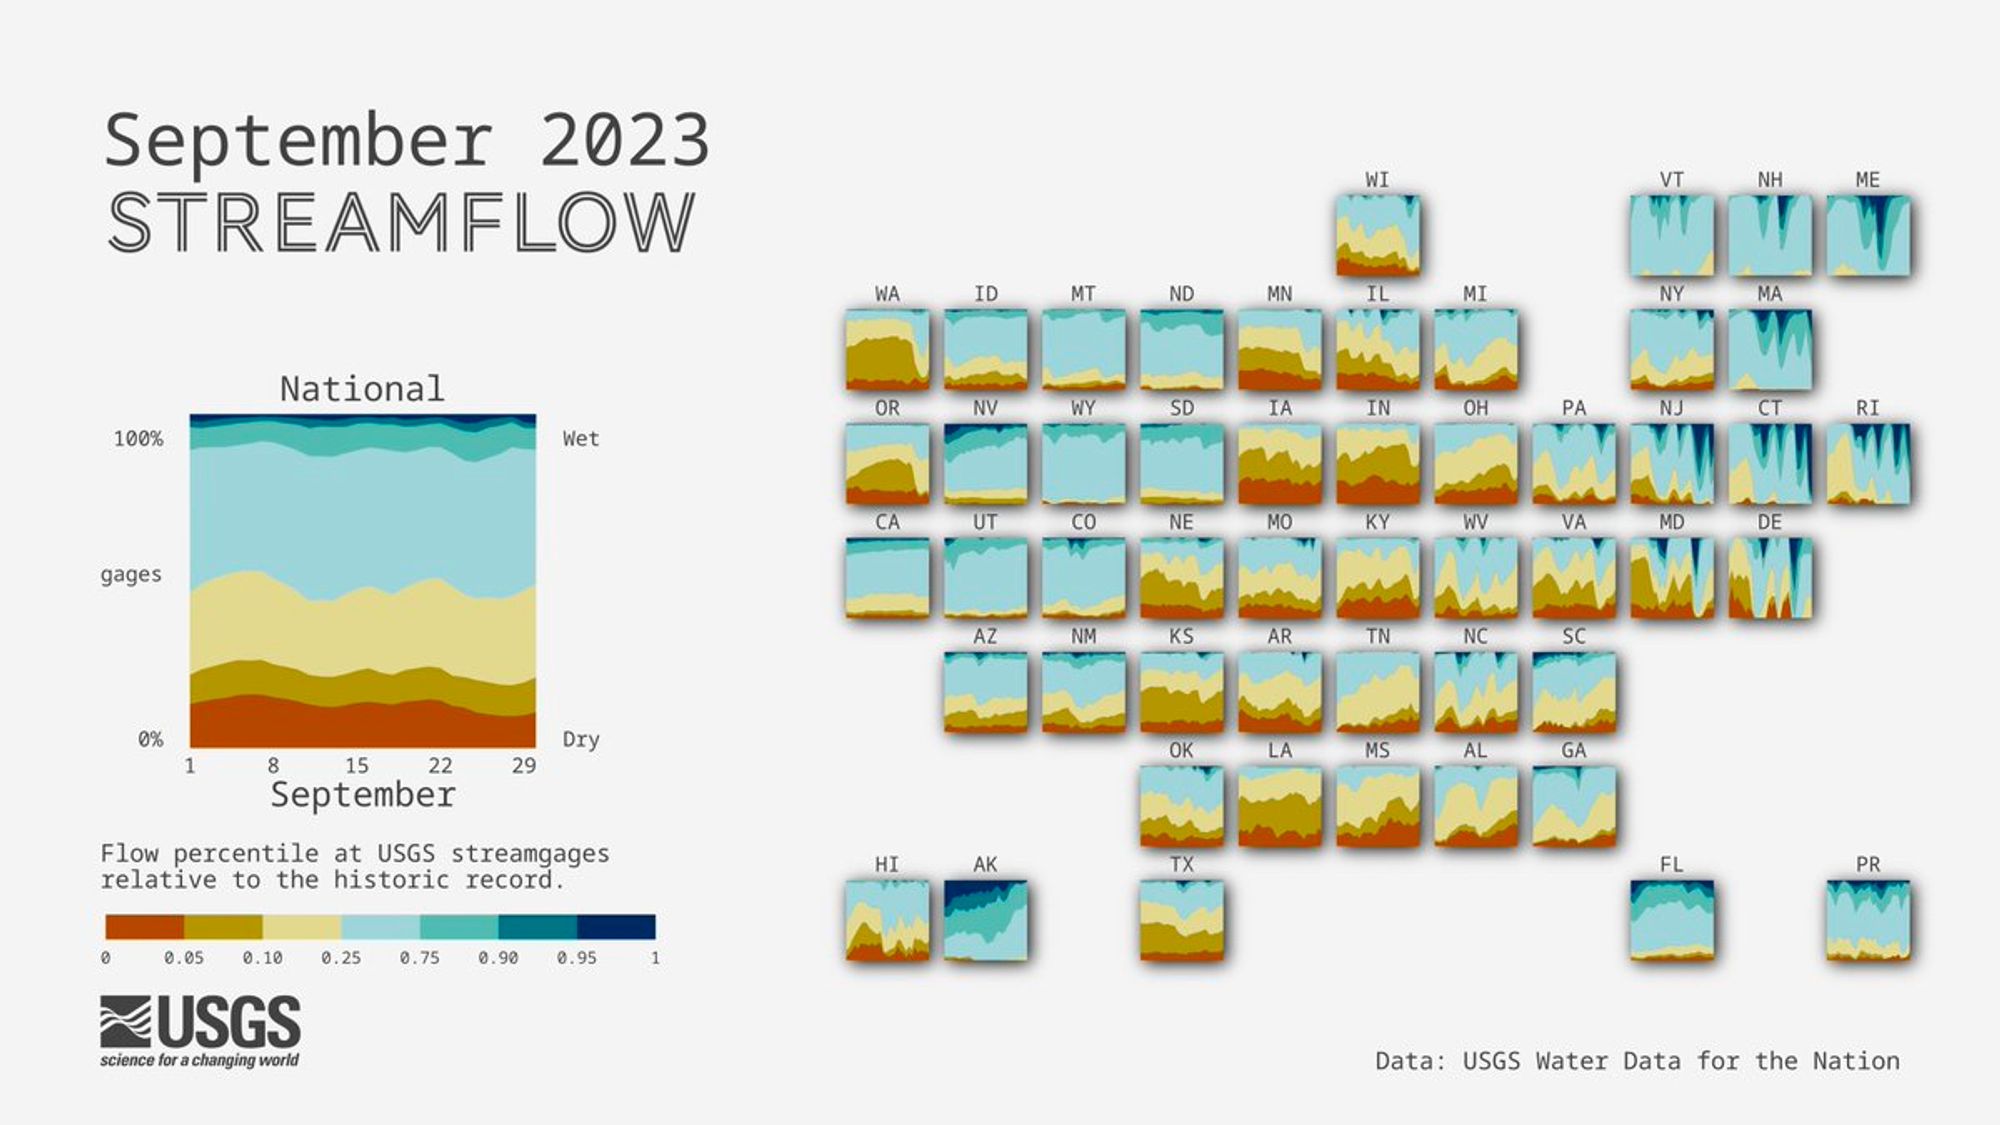
September #streamflow conditions across the U.S. 💧 Dry conditions persisted across much of the U.S., while parts of New England saw wet conditions. 📊🌎 made with #rstatsgithub.com/DOI-USGS/flo...@eazadpour.bsky.social

A tile map of the US showing streamgages by flow levels through the month of September 2023. For each state, an area chart shows the proportion of streamgages in wet, normal, or dry conditions. Streamflow conditions are quantified using percentiles comparing the past month’s flow levels to the historic record for each streamgage. During the month of September, much of the Central U.S. and parts of the Pacific Northwest, such as Oregon and Washington, saw dry conditions. Later in the month, parts of New England experienced wet conditions for states such as Maine, Massachusetts, Connecticut, Rhode Island and Delaware.
2
Reposted by Elmera Azadpour
AHallisonhorst.bsky.social

Teaching intro data science or stats in environmental sciences / ecology this fall? The lterdatasampler package is now on CRAN, with curated real world datasets from the US Long Term Ecological Research program! Check it out: lter.github.io/lterdatasamp...

A hexagonal design with the words lterdatasampler at the top. Within the border are plants, animals and weather patterns representing the different datasets currently in the package.
2
Reposted by Elmera Azadpour
Cceenell.bsky.social

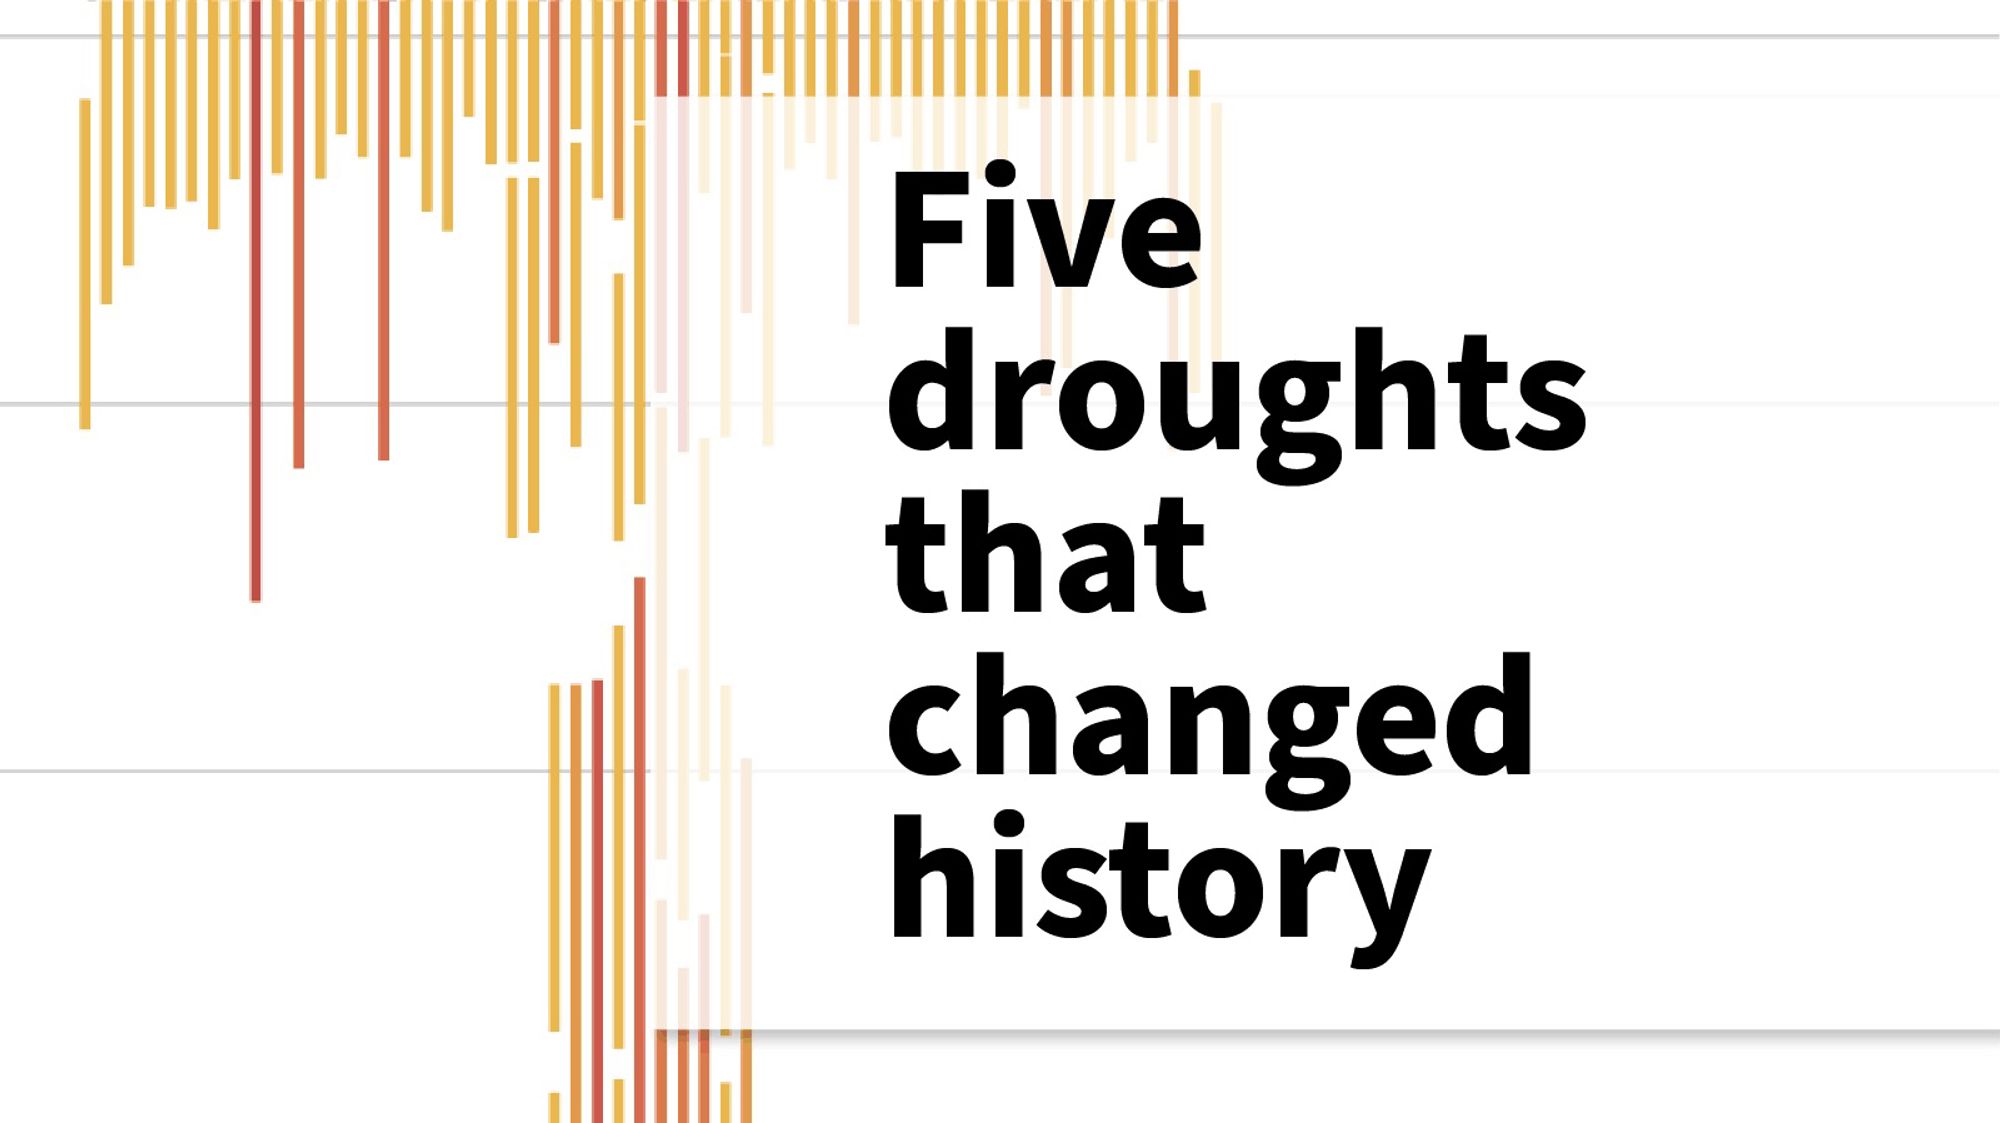
The U.S. has a long history of drought. But in the last 100 years, five drought periods stand out from all the rest. Learn about the 5 droughts that changed history in this new data viz 📊📈from the USGS VizLab labs.waterdata.usgs.gov/visualizatio...

A snippet of the drought timeline data visualization, showing red, orange, and yellow vertical bars clustered together, scrolls with text that reads, “Five droughts that changed history: The U.S. has a long history of droughts, but in the last 100 years, five droughts stand out from all the rest. Explore the droughts that changed history. Click the link in our post”
2
Profile banner
EA
Elmera Azadpour
@eazadpour.bsky.social
45 followers30 following5 posts