working title for next edition of Chartography is THIS CHART KILLS FASCISTS It will be a feat that I’m honestly still trying to pull off. subscribe: charts.substack.com
Anyone in digital humanities doing work with folklore? I'd love to see some mythology/folklore data visualization examples.
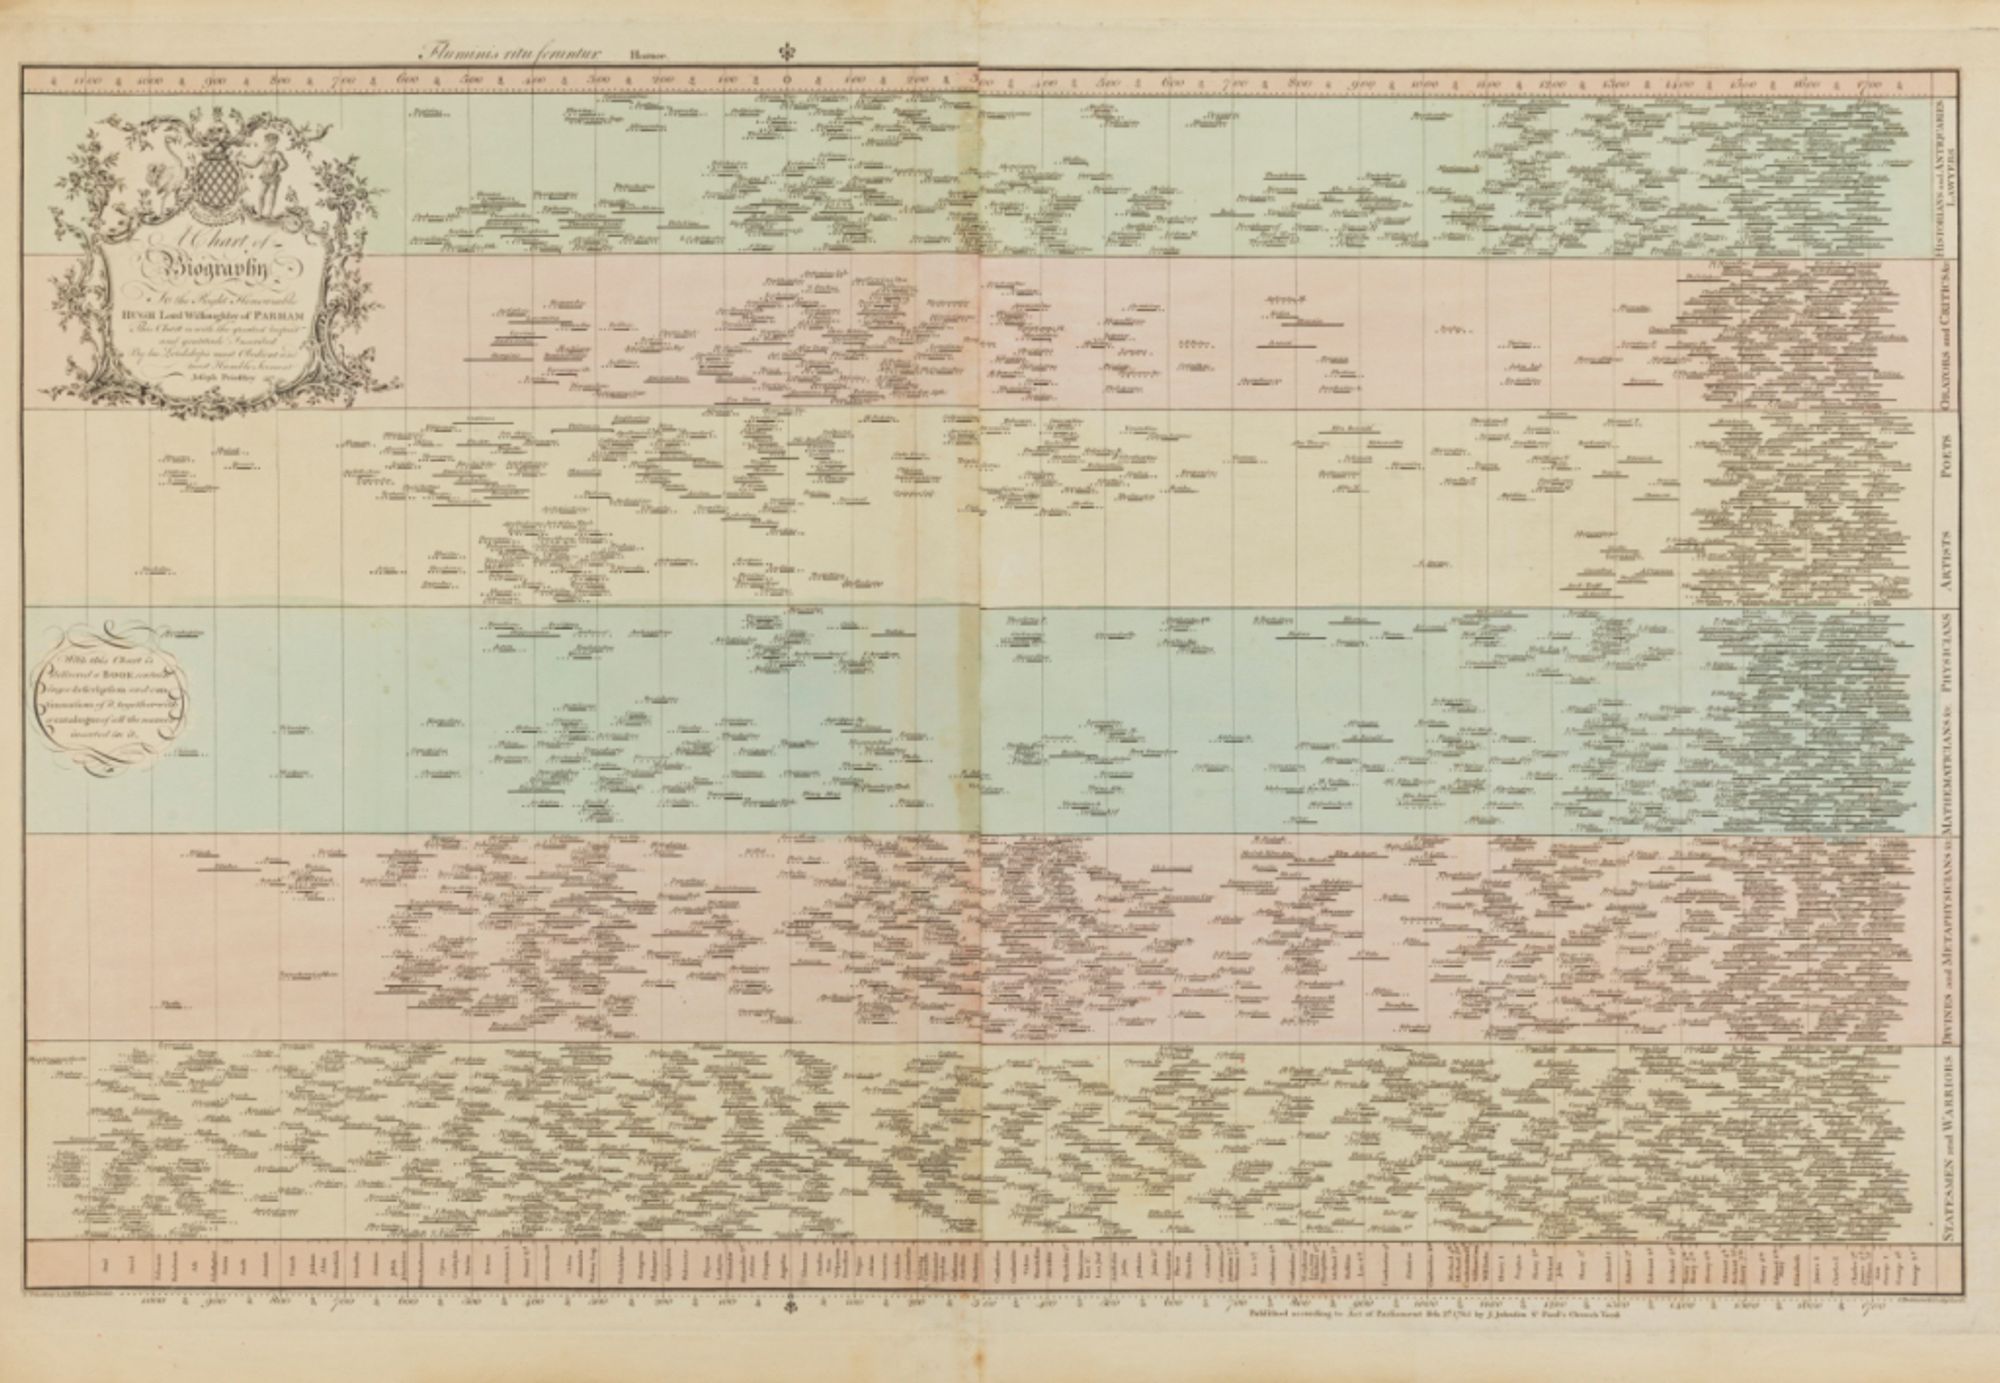
Some of my favorite work! It's, like, 100 years old so I should go back and modernize it.
Anybody out there doing slick data visualization with realtime data?
Apply to be a speaker at Outlier Conference (Chicago or virtual June 12-14) by February 24th! www.outlierconf.com

So, I'm a Principal Software Engineer now, which is weird because 15 years ago I was studying environmental history of Sandai Chin. I started using ArcGIS and MySQL to make stuff like this and I guess that's the ??? of the Step 2 Profit meme.
Sure, I have a diversified portfolio. I have Apple stock, I have Netflix stock and I have Noteable stock.
I’ve always been struck at how Priestley’s timelines were simultaneously information dense (a lot of ink) and sparse. Six very general buckets and other than lifespans (frankly who cares) and coincident existence of famous people there’s really not much there.