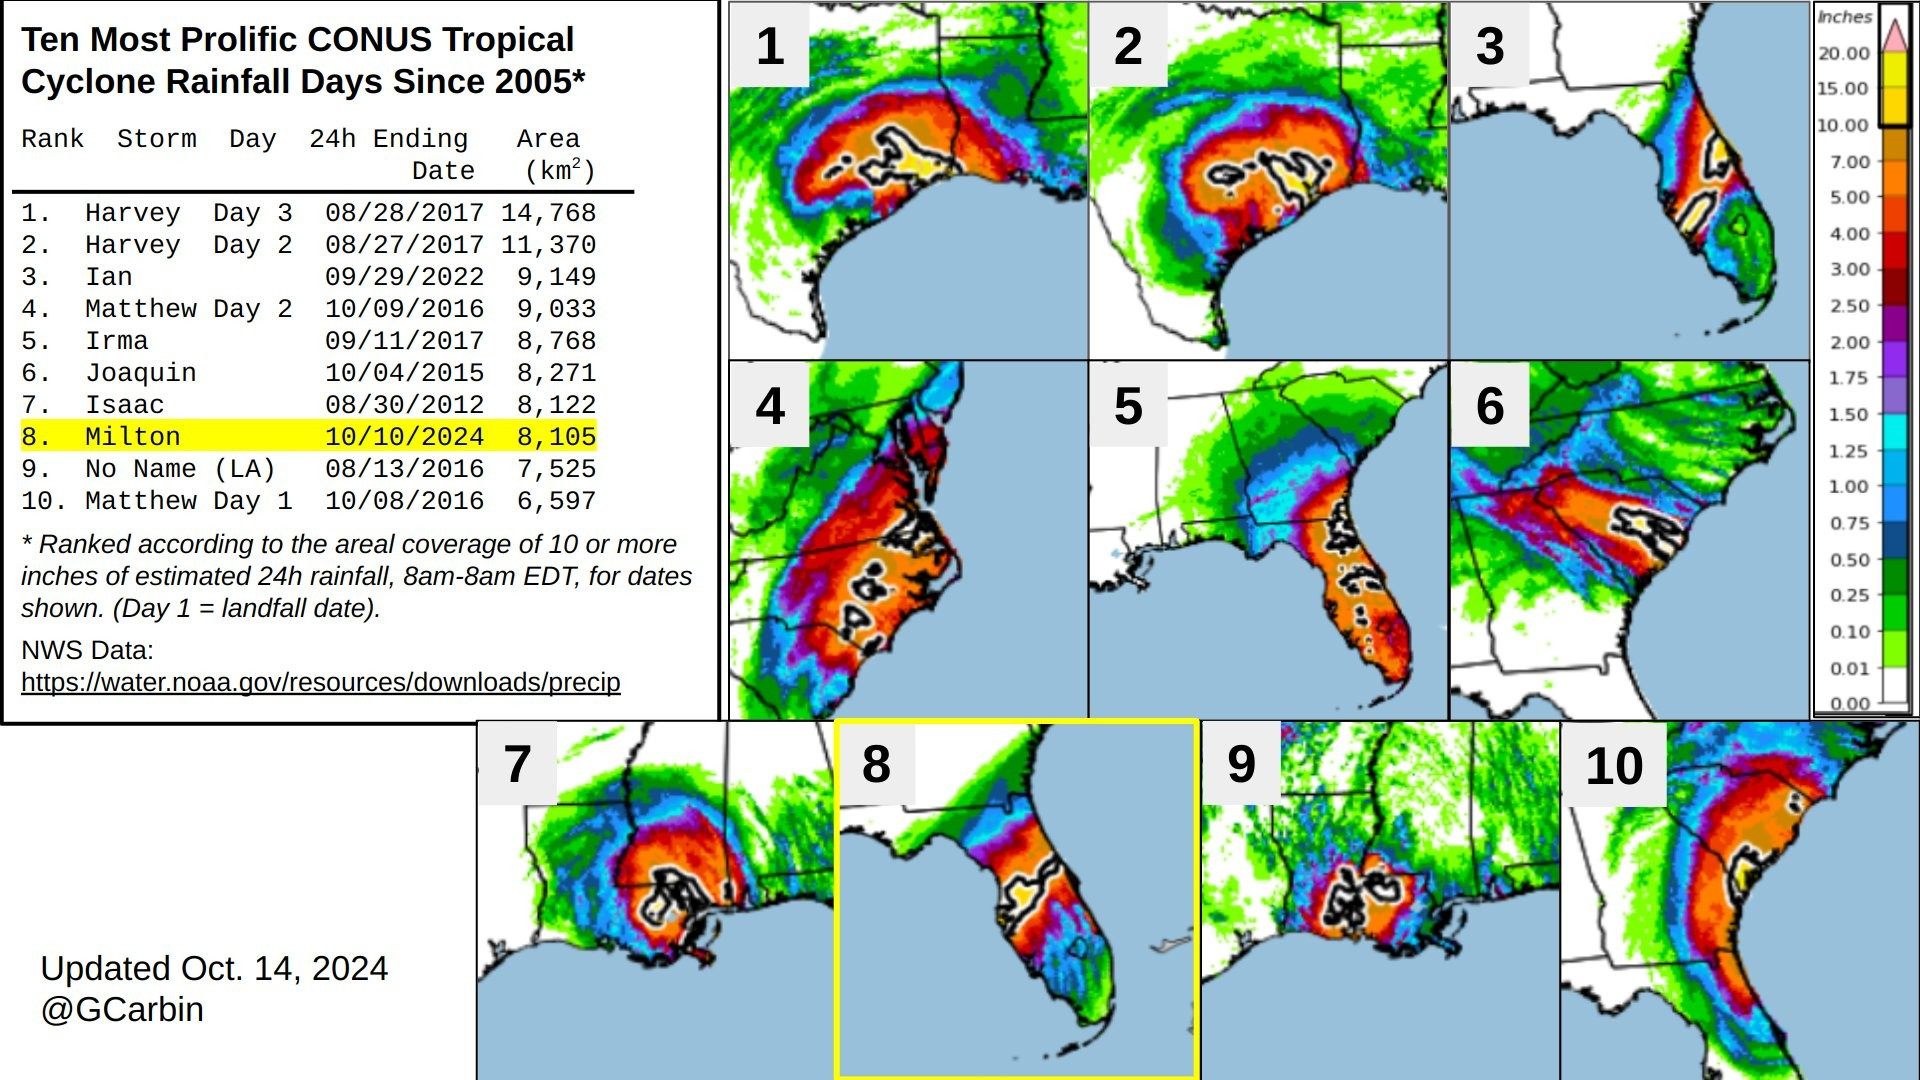
Yes, this is a basic approach to quantifying these events. However, it does seem that an accumulation of 10 inches of rainfall in ~24 hours, just about no matter where you are, is usually associated with a flooding impact. And, conceptually, the larger that 10-inch footprint, the greater the impact.
Hi Tomer, this analysis uses Stage III and Stage IV grids, regridded to the PRISM domain. Area calcs can be tricky with grids but that's what I've been using to come up with the rankings. I'd be interested in other ways of looking at the concept of a "prolific TC rainfall day".
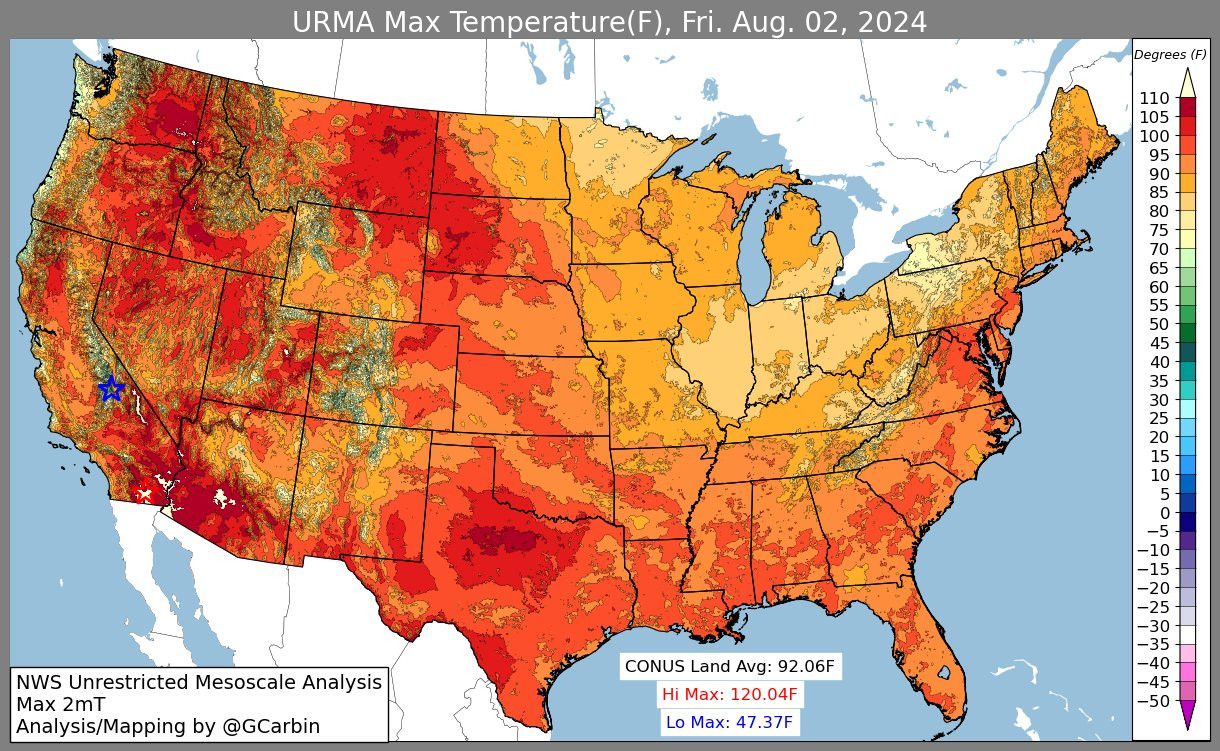
Here are the number of summer days with an average CONUS maximum temp exceeding 90F, by year: 2017: 2 days 2018: 0 days 2019: 0 days 2020: 0 days 2021: 0 days 2022: 7 days 2023: 6 days 2024: 8 days URMA daily temperature grids go back to 2017. (2/2)
The hottest day of the past Summer, August 2, 2024, with an average high temperature of 92.06°F. There were 8 days during the summer of 2024 when the average high temp (over the CONUS) exceeded 90°F. This is the greatest number of summer days in the daily data back to 2017. (1/2)