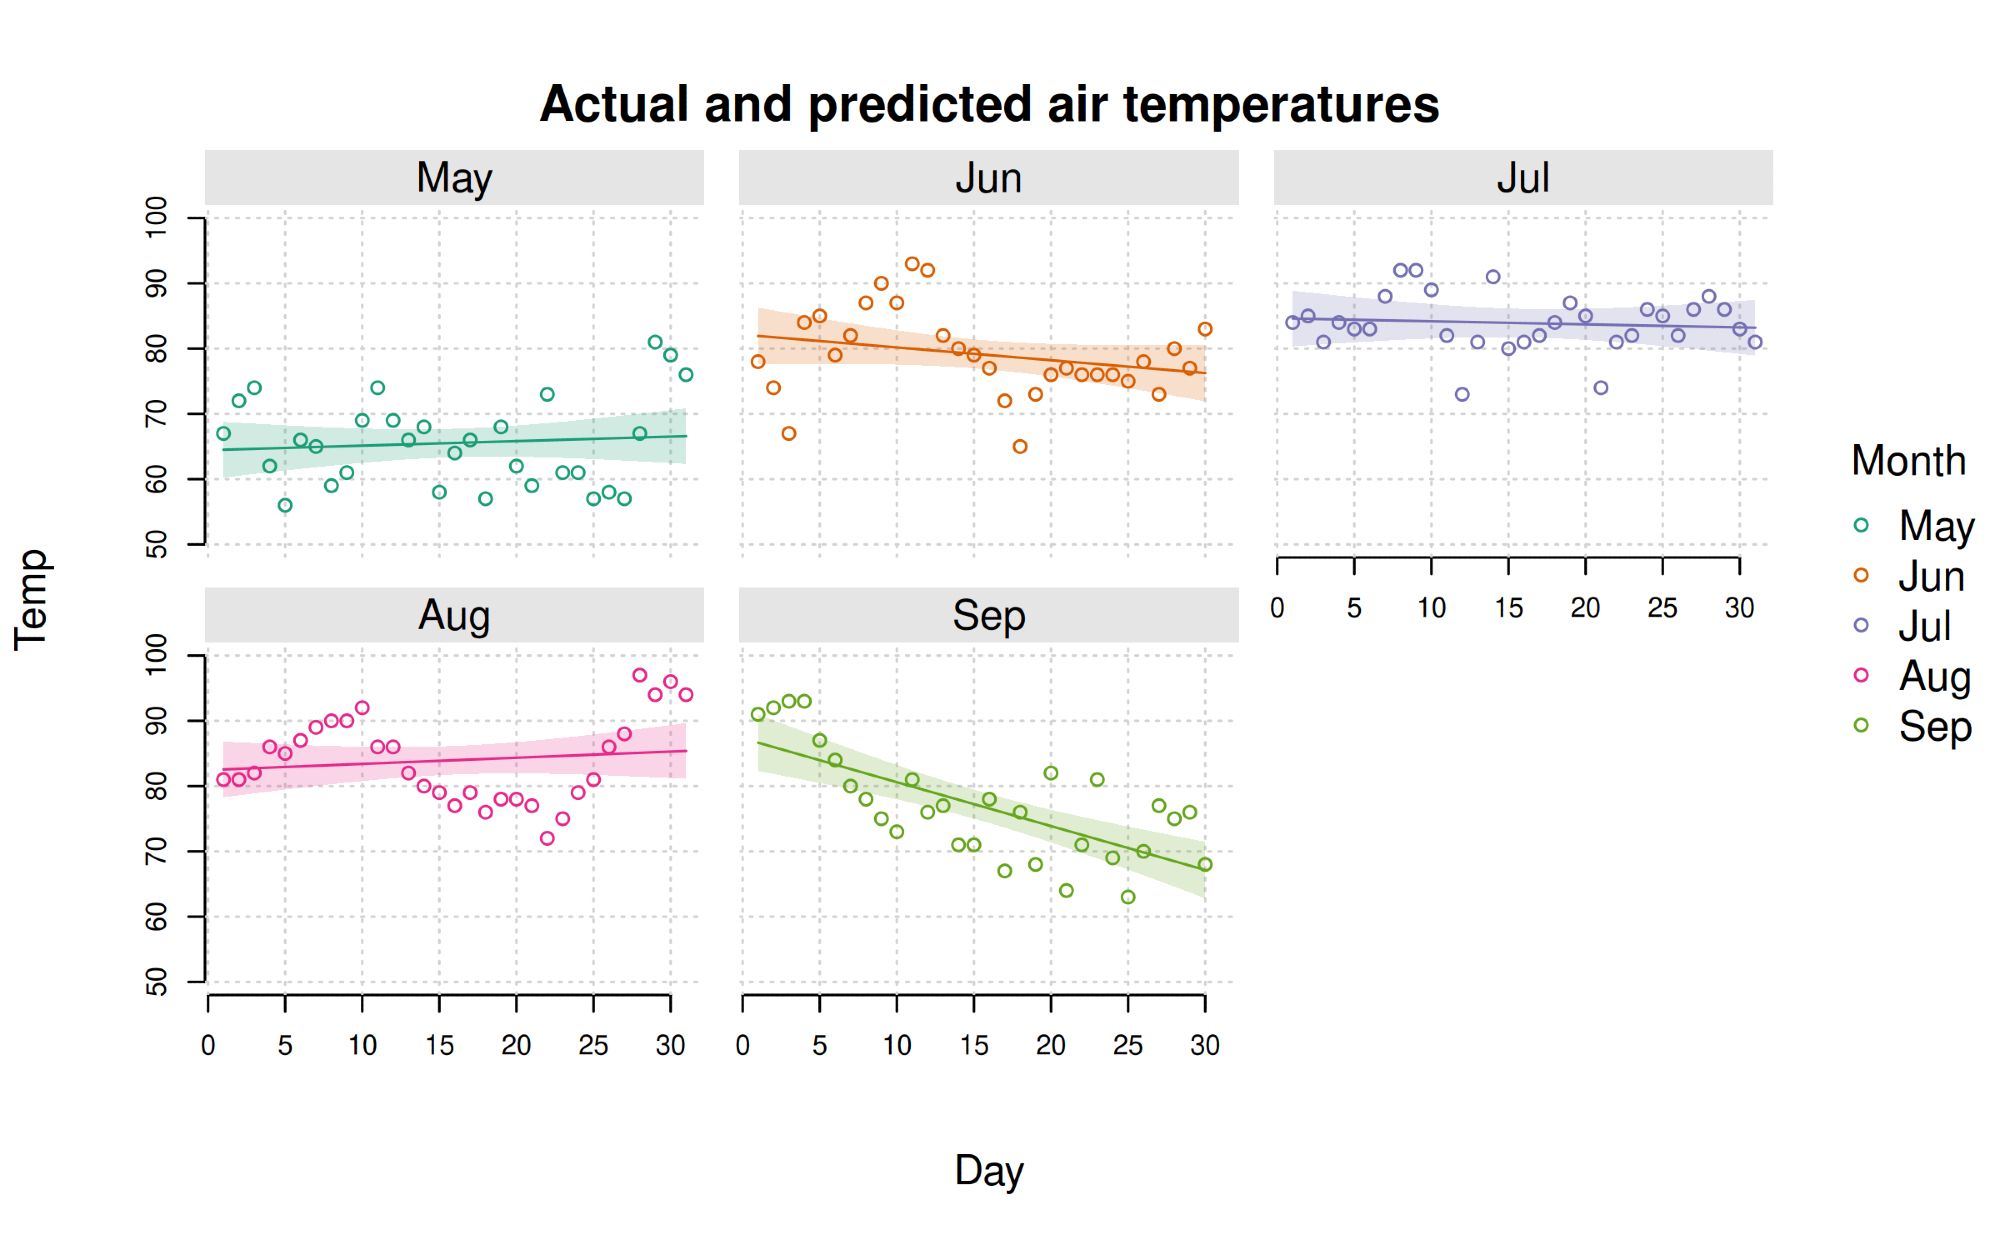
Stoked to announce a new release of `plot2`, the powerful and lightweight (0-dep) extension for #rstatsgithub.com/grantmcdermo... What's new? A bunch of things, including area plots and facets. Draw plots like the below with simple function calls.
Grab it from R-universe. ``` install.packages("plot2", repos = "grantmcdermott.r-universe.dev") ``` And then follow along with the intro tutorial on our shiny new website: grantmcdermott.com/plot2/#/vign... (CRAN submission coming soon.)
plot2 is an exciting development. One reason I use ggplot2 even for a simple plot is its defaults for tick mark and axis label spacing, which do not waste space. I found this hard to tweak with plot’s lgp option etc. Hope you can address that in plot2 instead of using the base plot defaults.