BLUE
Profile banner
LZ
Luke Zappia
@lazappi.bsky.social
Bioinformatician, data scientist, software developer Also @_lazappi_ and @lazappi@mastodon.au
49 followers168 following19 posts
LZlazappi.bsky.social

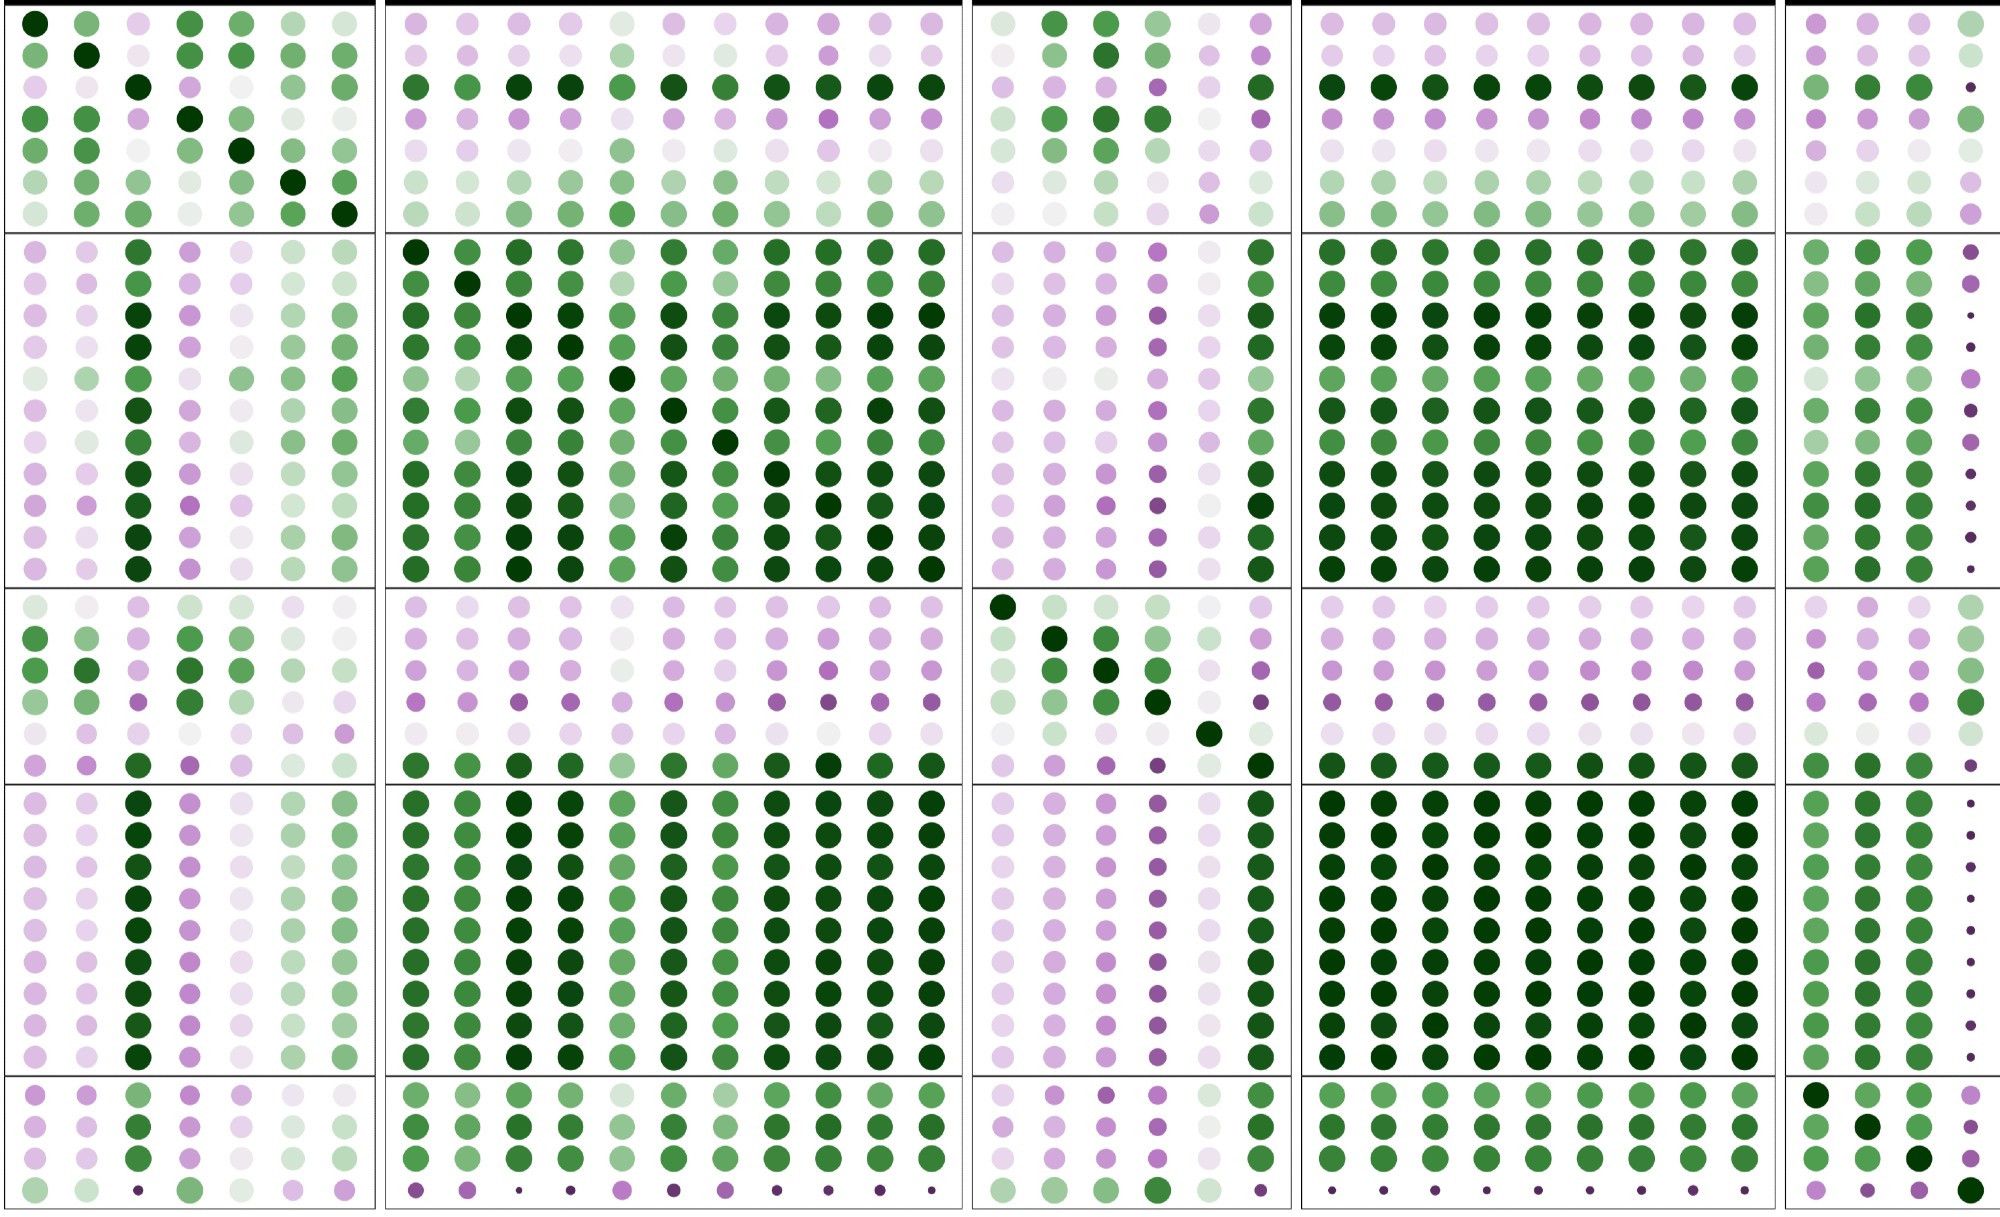
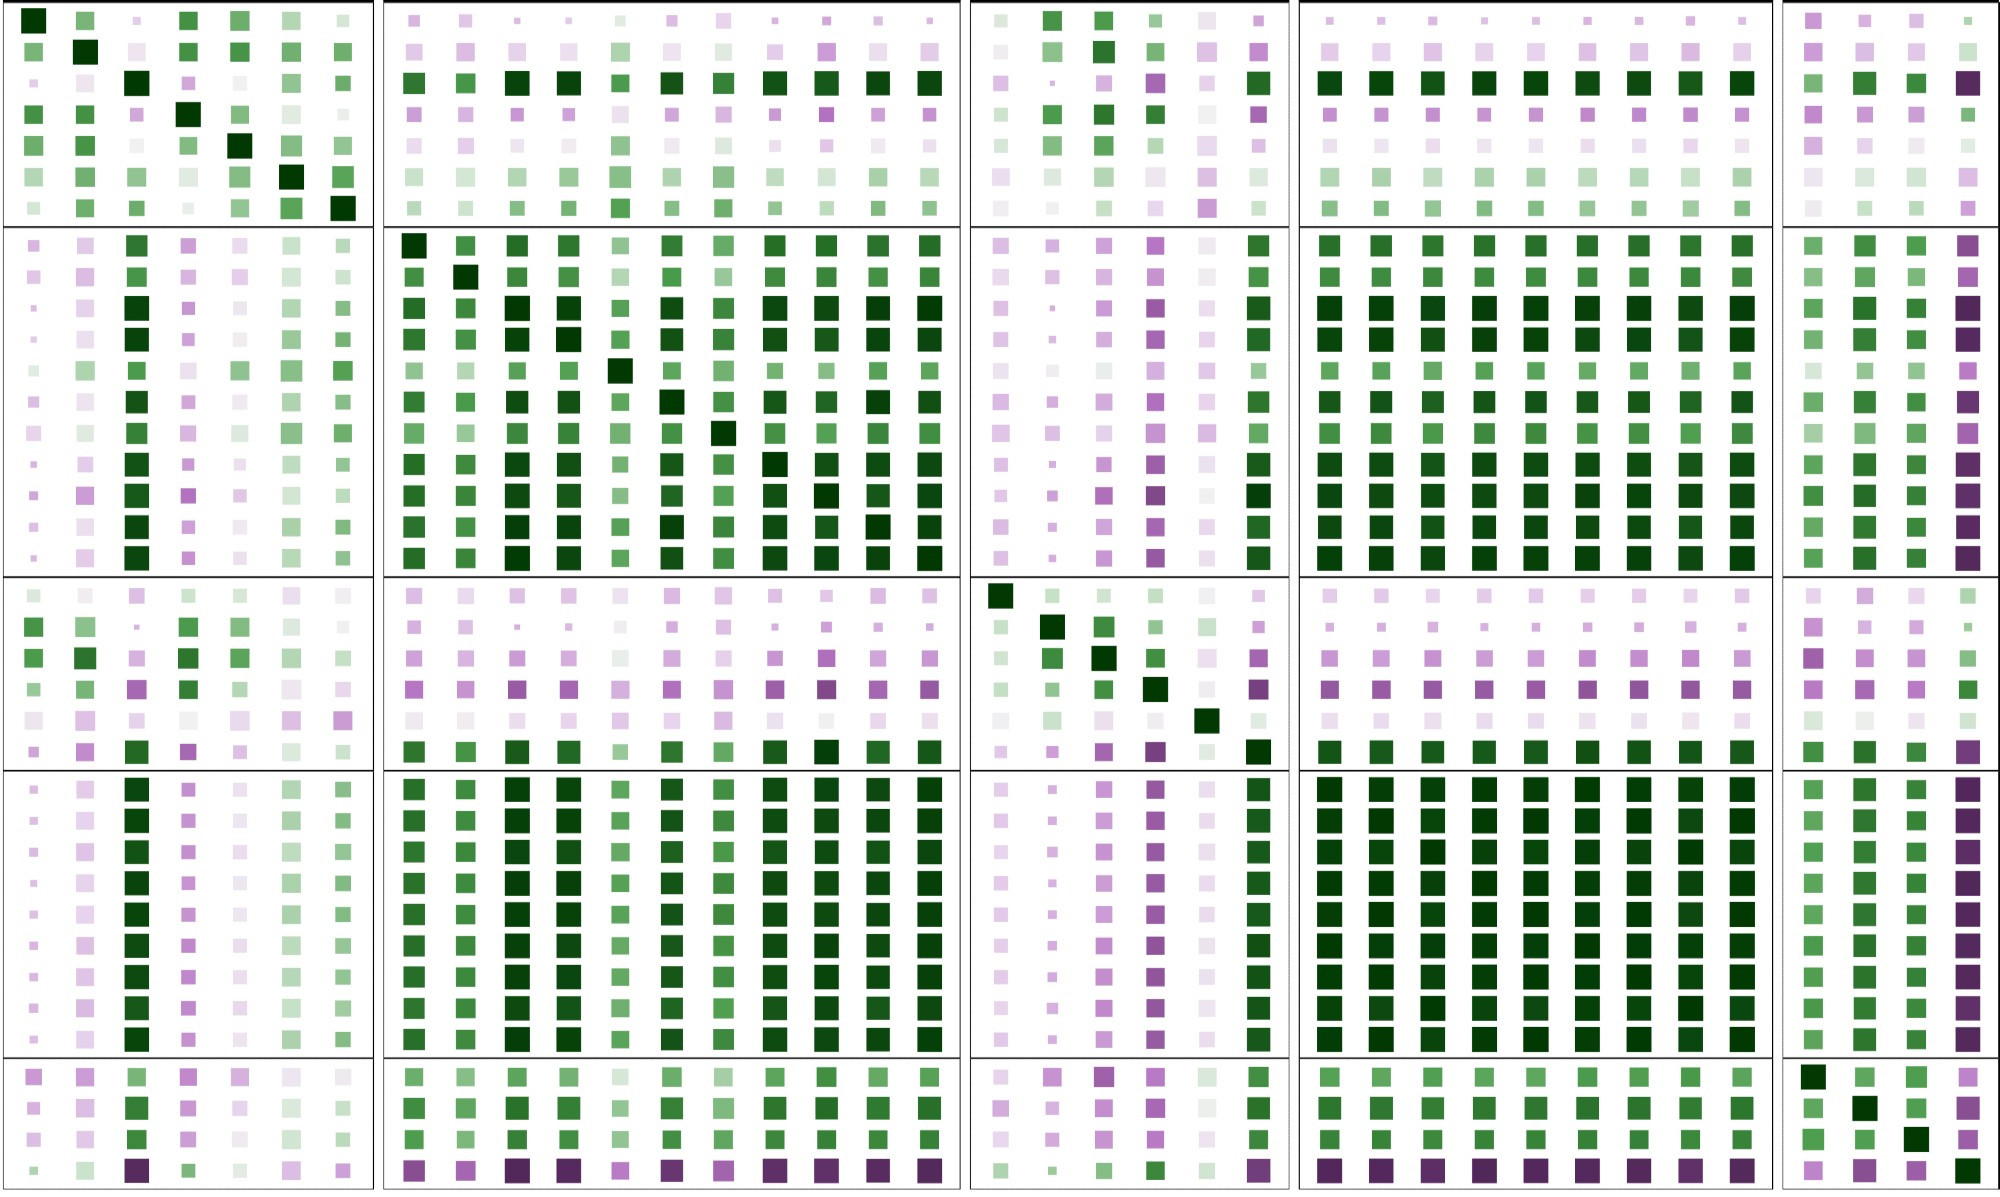
Some ideas: - Scale size by variability (circle/square) - Donuts (or squares with holes) where outside size is Mean+SD and inside size is Mean-SD

Heatmap of circles where colour shows mean and shows shows standard deviation
Heatmap of squares where colour shows mean and shows shows standard deviation
Heatmap of donuts where colour shows mean, inner radius shows Mean-SD and outer radius Mean+SD
Heatmap of square donuts where colour shows mean, inner radius shows Mean-SD and outer radius Mean+SD
1

LZlazappi.bsky.social

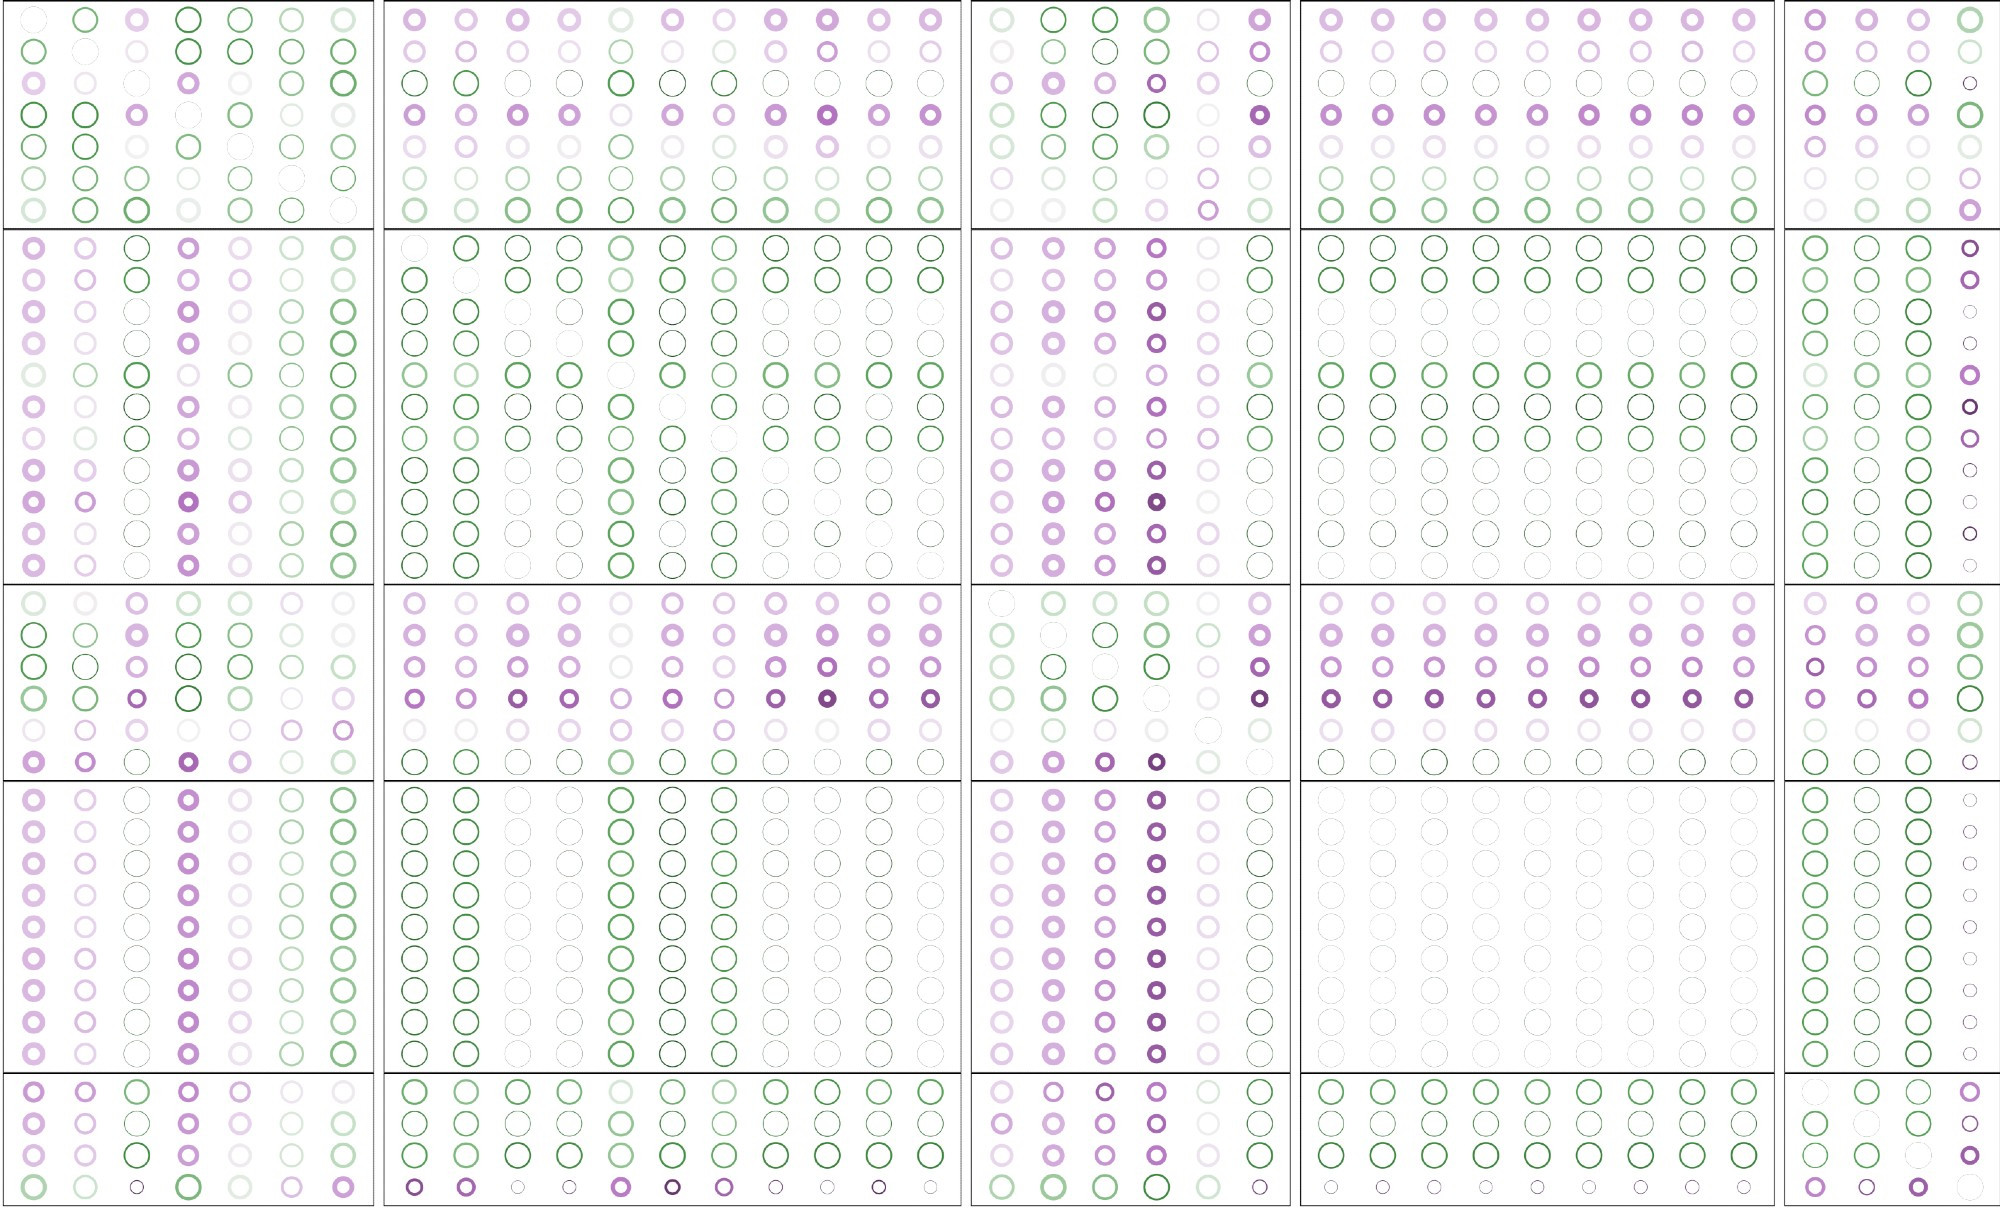
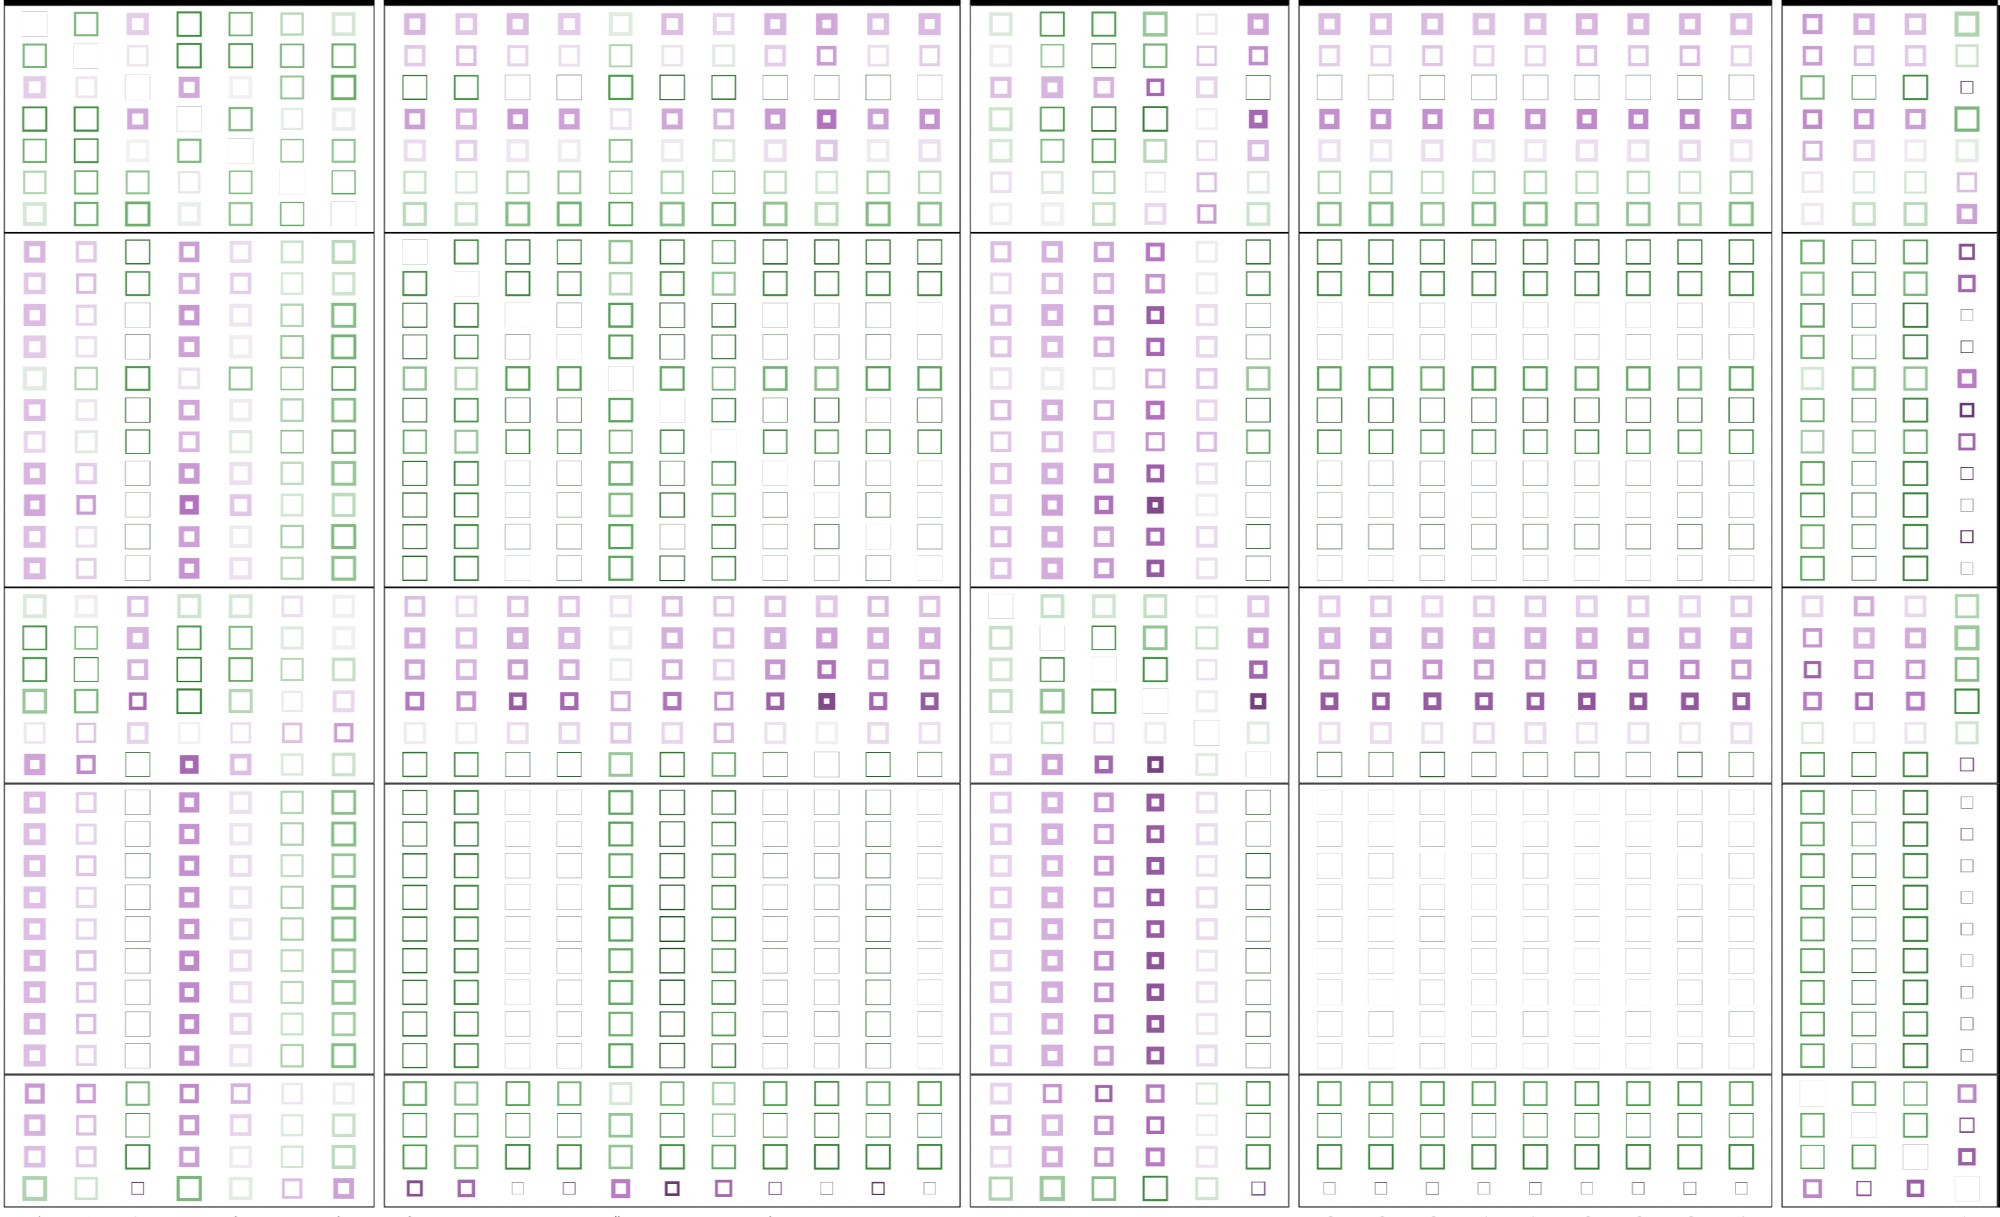
The donuts lose the heatmap effect so I don't think that works very well.

1
Profile banner
LZ
Luke Zappia
@lazappi.bsky.social
Bioinformatician, data scientist, software developer Also @_lazappi_ and @lazappi@mastodon.au
49 followers168 following19 posts