MK
Madhusudan 🦉 Katti
@leafwarbler.bsky.social
Director of Science, Tech, & Society • twice-tenured Immigrant Prof @ Land Grab Univ • Editor • Public Scientist • Reconciliation Ecologist • Humanist • Writer • Dad to ⚧️ 🏳️⚧️ kids • Alien of Extraordinary Ability with “Indian cultural baggage”
2.6k followers1.9k following1.9k posts
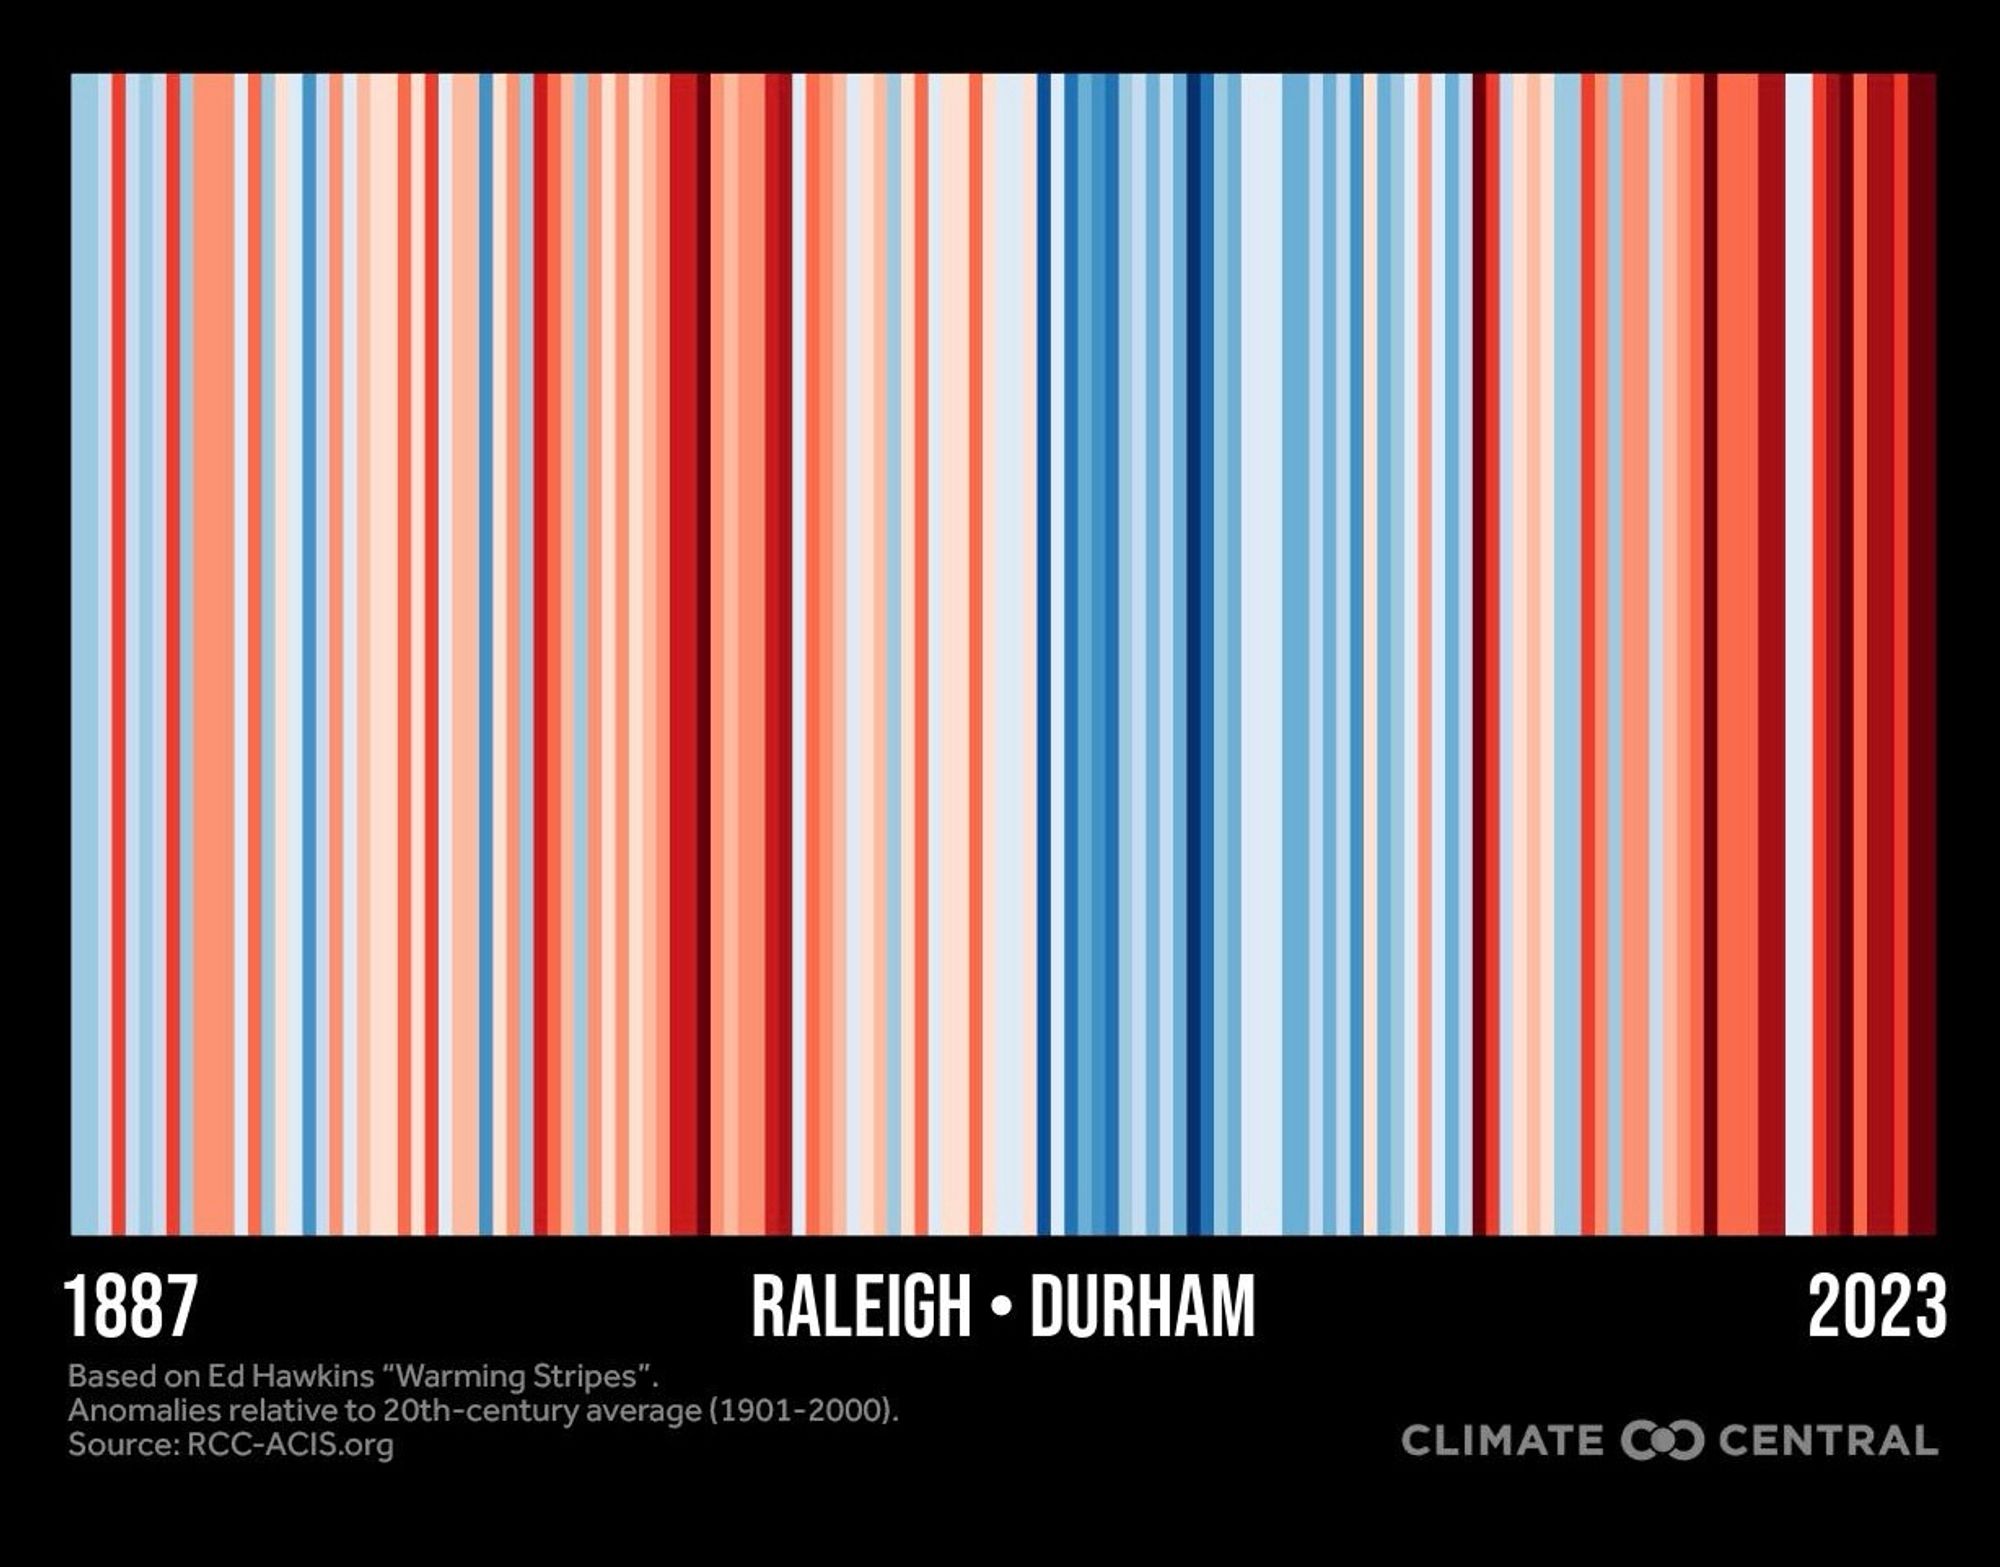
It sure is getting warmer here in my neck of the urban woods in North Carolina, like many other places. To find a "Show Us Your Stripes" graphic for cities near you in the U.S., go here: www.climatecentral.org/stripes-info...#ShowYourStripes
MK
Madhusudan 🦉 Katti
@leafwarbler.bsky.social
Director of Science, Tech, & Society • twice-tenured Immigrant Prof @ Land Grab Univ • Editor • Public Scientist • Reconciliation Ecologist • Humanist • Writer • Dad to ⚧️ 🏳️⚧️ kids • Alien of Extraordinary Ability with “Indian cultural baggage”
2.6k followers1.9k following1.9k posts