LS
Lily-belle Sweet
@lilybellesweet.bsky.social
PhD student at UFZ - interested in explainable machine learning, agriculture and food security, compound climate events 🌾
78 followers99 following13 posts
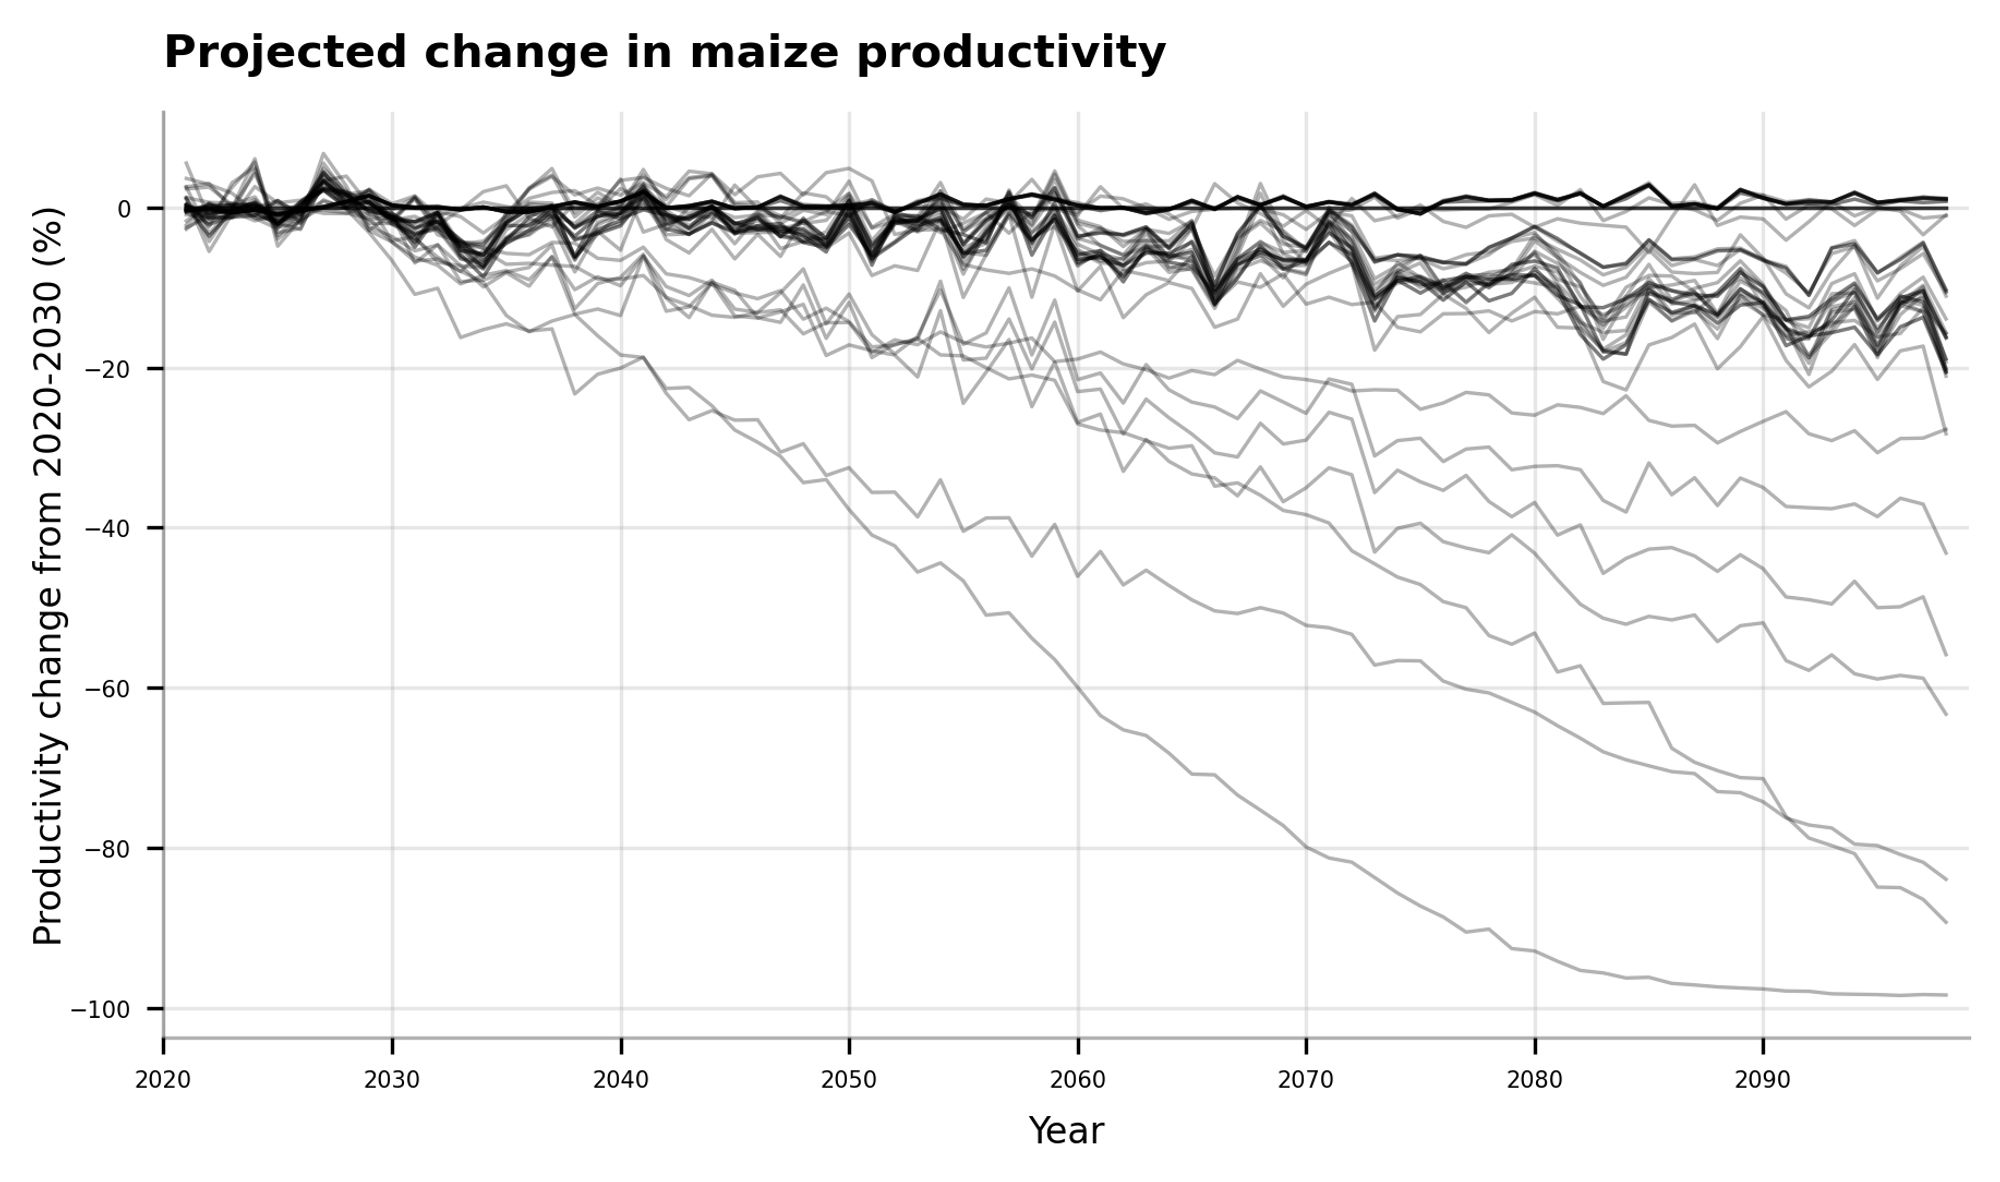
Can you learn from the past to predict future climate impacts? Our Kaggle competition has been running for 3 weeks, with 45 submissions so far. Despite using the same training data, models vary in their projected changes in global maize productivity... www.kaggle.com/competitions...
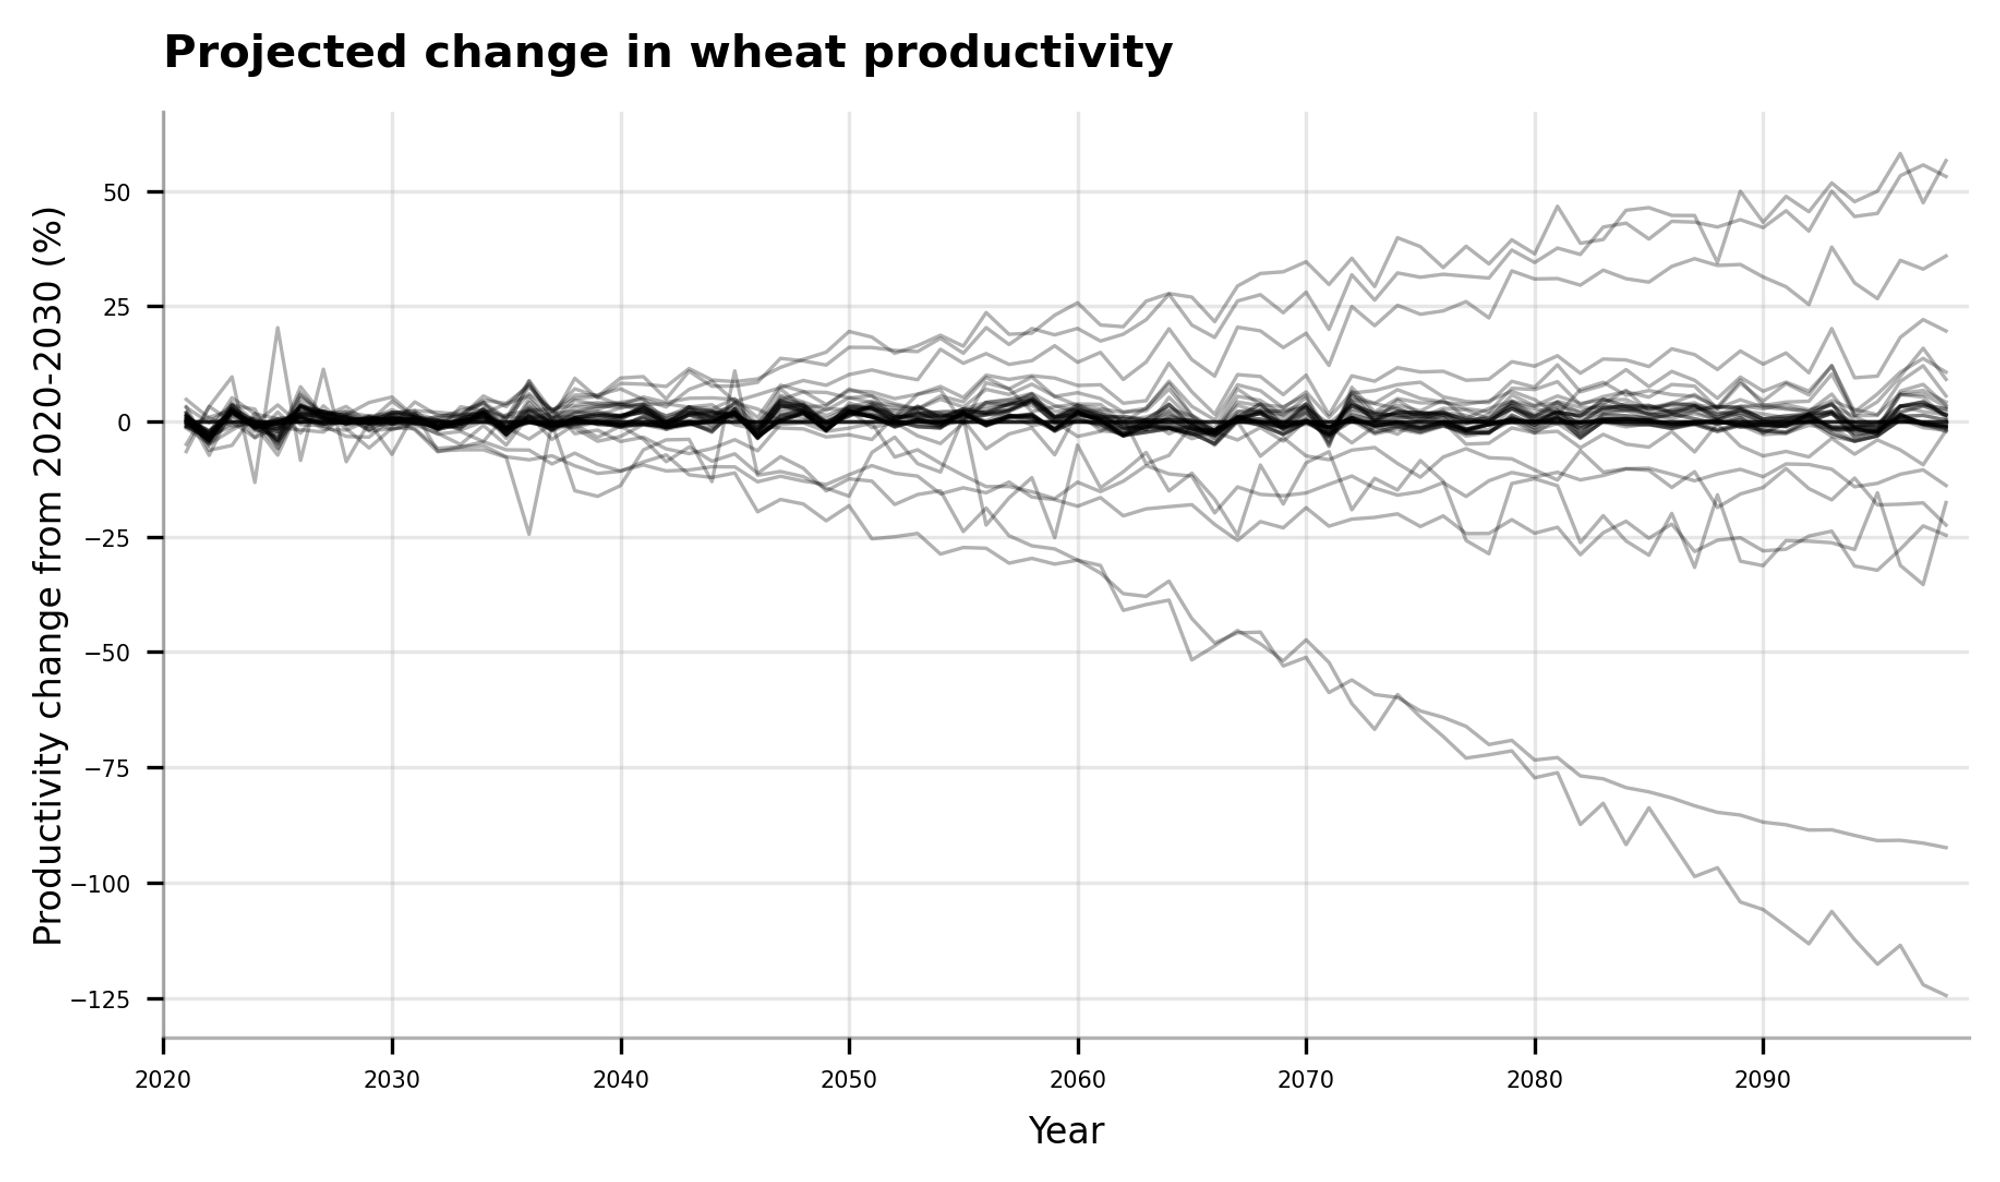
For wheat, the median estimate is zero productivity change, but some models predict large positive increases and a couple expect enormous drops. Luckily, as this experiment is based on simulated data, we have ground truth to compare to at the end of the competition. Join the competition now!
LS
Lily-belle Sweet
@lilybellesweet.bsky.social
PhD student at UFZ - interested in explainable machine learning, agriculture and food security, compound climate events 🌾
78 followers99 following13 posts