
These shocks are designed to be orthogonal to each other. For example, they deactivate the endogenous relationships between short-term interest rates, long-term rates, and exchange rates. Hence, allowing to add the effects of each shocks.
This decomposition is achieved using Basic Model Elasticities of Eurosystem macro forecasting models (BMEs). BMEs represent the impulse response functions to various shocks (commodity and food prices, exchange rates, interest rates, foreign demand, public finance, etc.).
A nice job that was done by ECB staff colleagues: Mohammed Chahad, Anna-Camilla Hofmann-Drahonsky, Adrian Page and Marcel Tirpák www.ecb.europa.eu/pub/economic...

The European Central Bank (ECB) is the central bank of the European Union countries which have adopted the euro. Our main task is to maintain price stability in the euro area and so preserve the purch...
I'm really proud to see this work come to fruition, I'm so lucky to be able to work with such a great team. Claire, Hervé and I are currently finishing the French paper, it should be available soon!
Non non, je veux dire c’est juste une corrélation ! Il y a d’autres regresseurs dans une courbe de Phillips …
Puis là c’est vraiment un scatter plot plus qu’une vraie courbe de Phillips… je sais qu’il y a un mec qui fait ce genre de graphiques en prétendant que la courbe de Phillips n’existe pas, donc je précise
Les courbes de Phillips n’ont généralement pas des R2 monstrueux (ce qui d’ailleurs n’est pas un problème en soi).
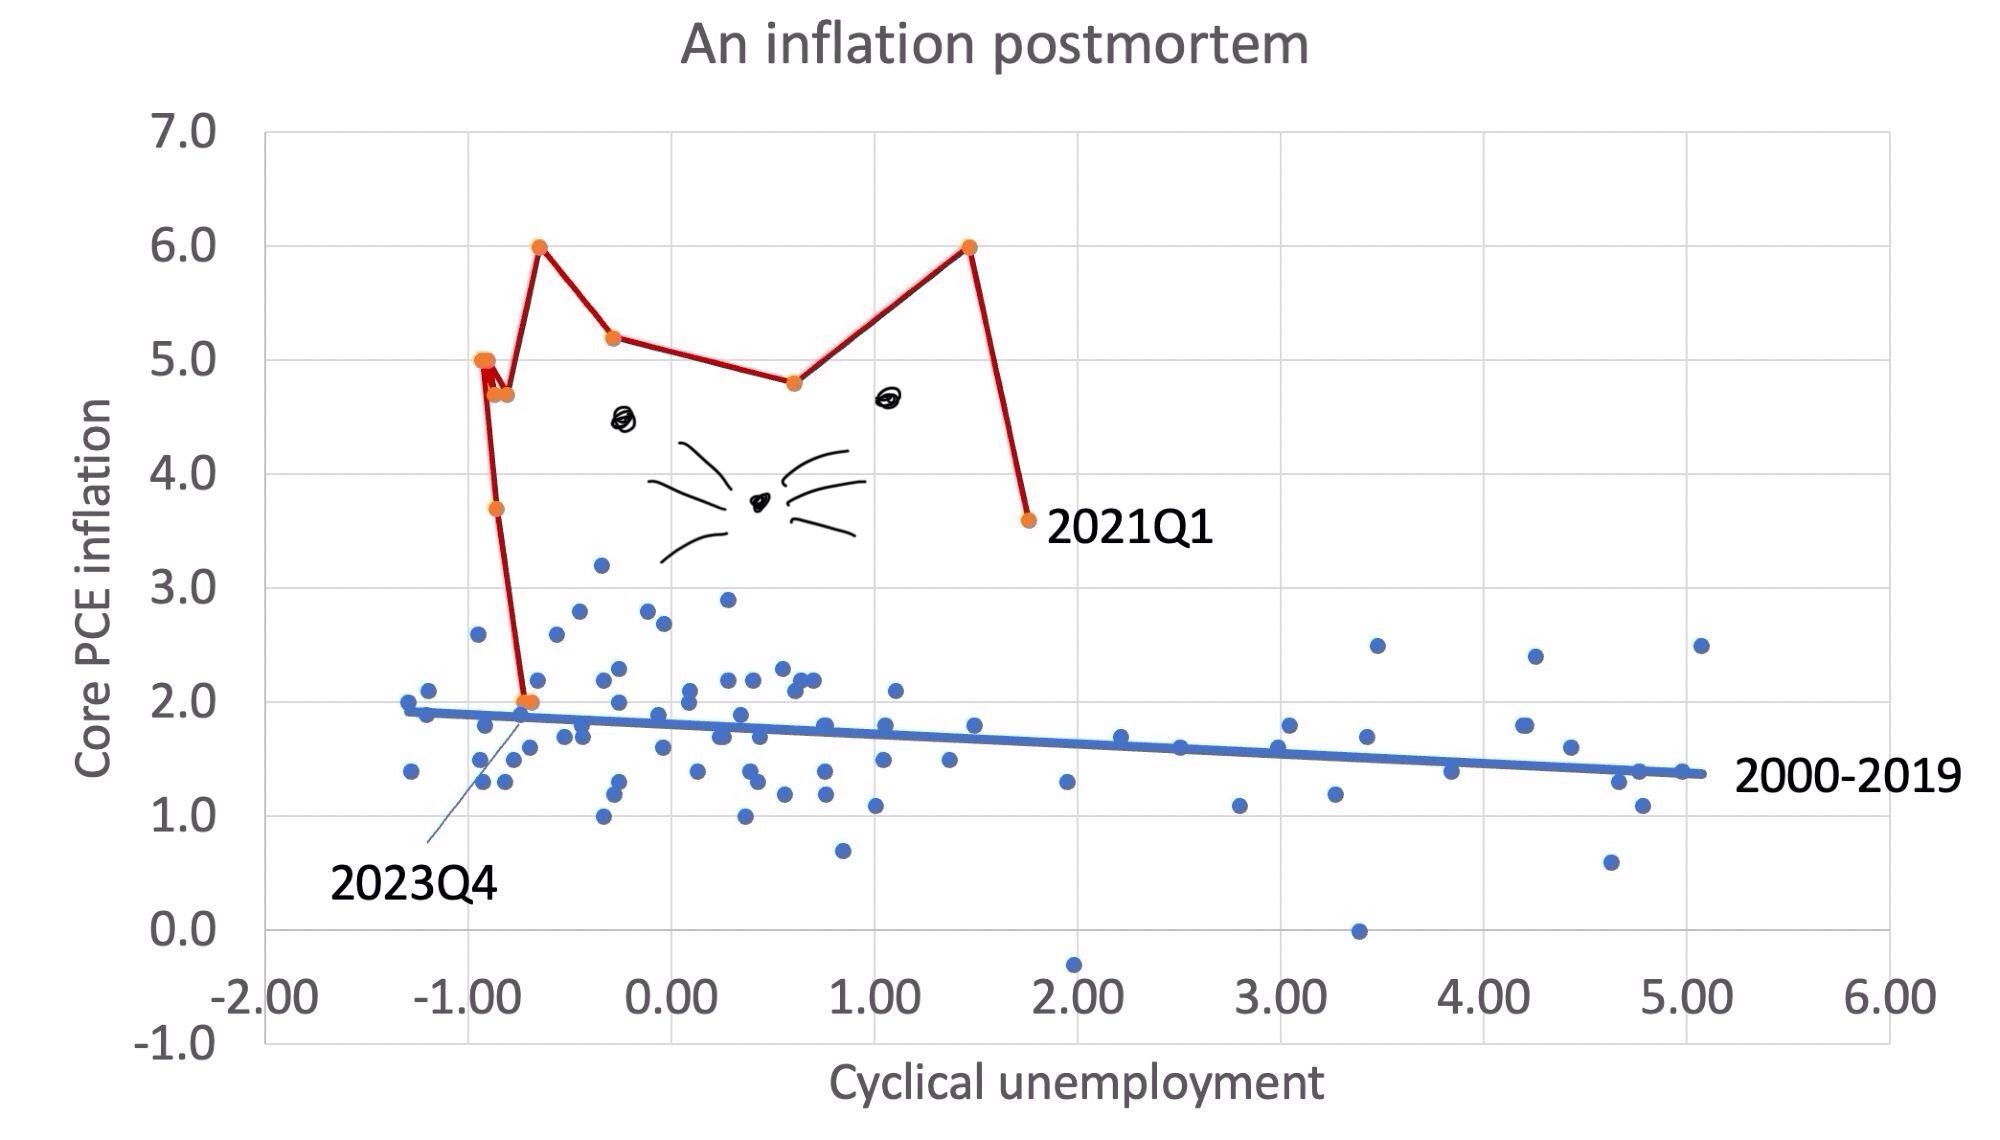
Parce que la courbe de Phillips est très plate ?
Ça ressemble beaucoup à certains débats d’aujourd’hui (l’impression de perdre de son temps) 🙄