Get started with Pavlovia Surveys over at https://pavlovia.org/ We're just a bunch of scientists trying to make low cost tools for scientists 👩🔬 🧠

The place for the wide community of researchers in the behavioural sciences to run, share, and explore experiments online
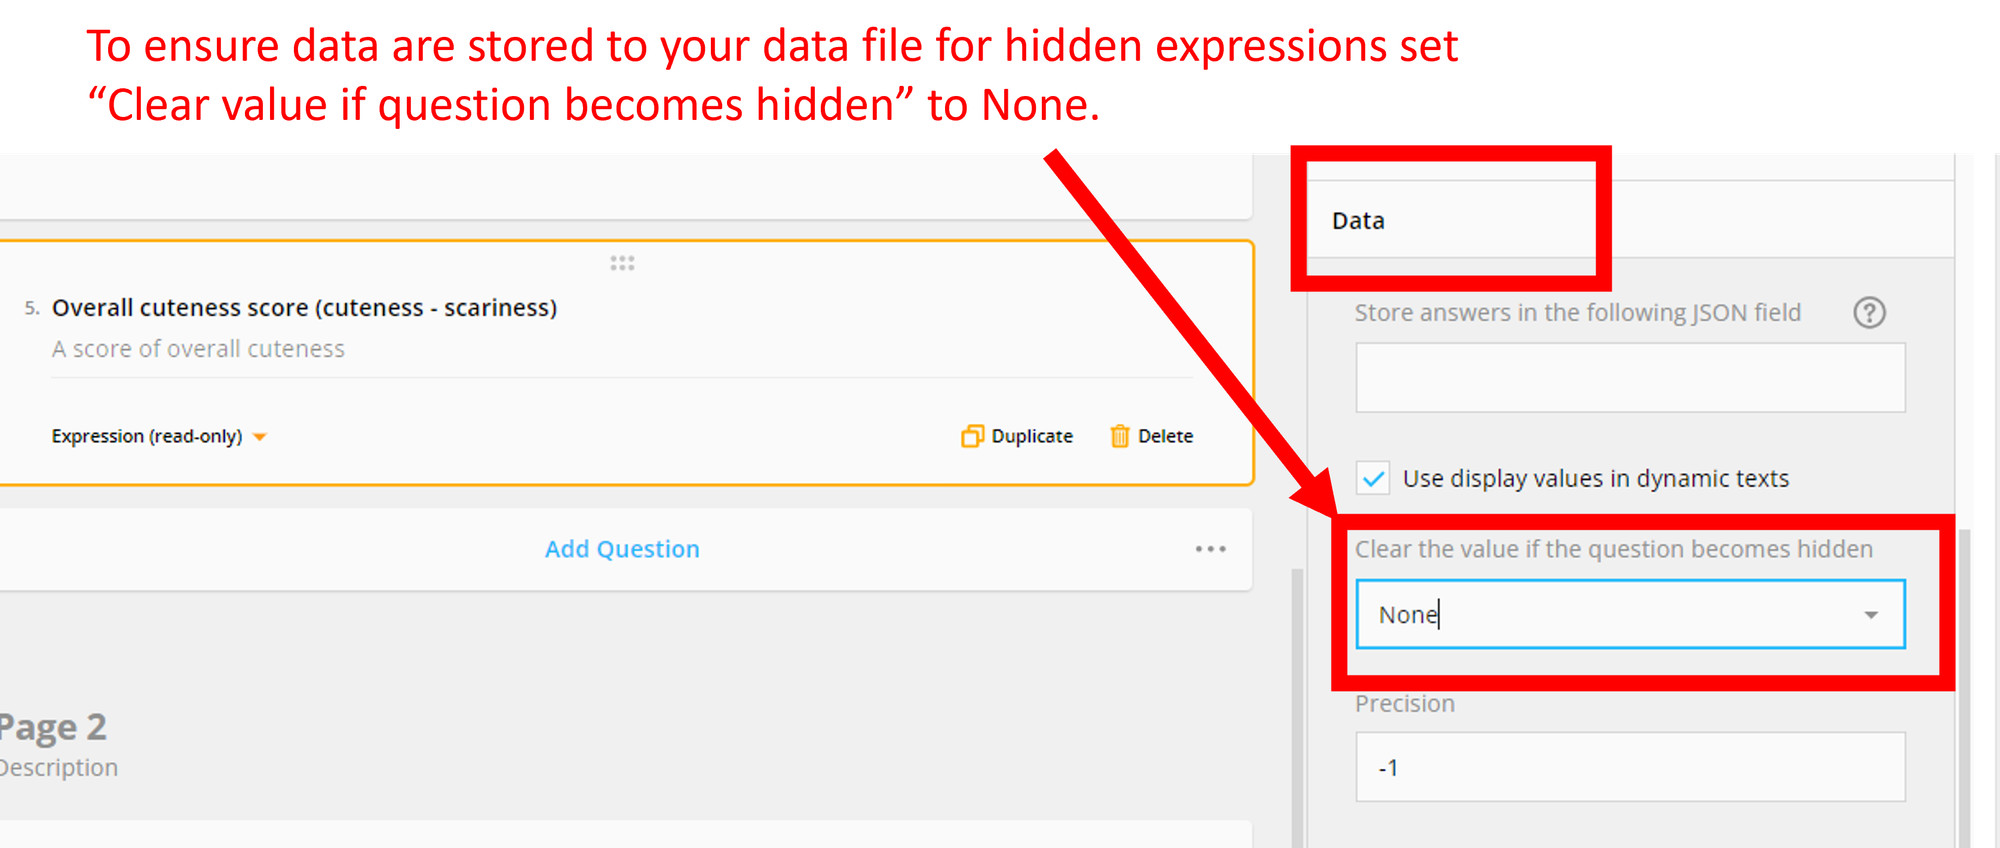
3. If I want to hide my calculated score from the participant but still save it to my data file, update the "Data" settings for the expression question
2. Add an "Expression" type question. Here the score is calculated as {block_1/cute_matrix.cute} - {block_1/cute_matrix.scare} (block_1 = what block this question is in, cute_matrix = name of matrix question)
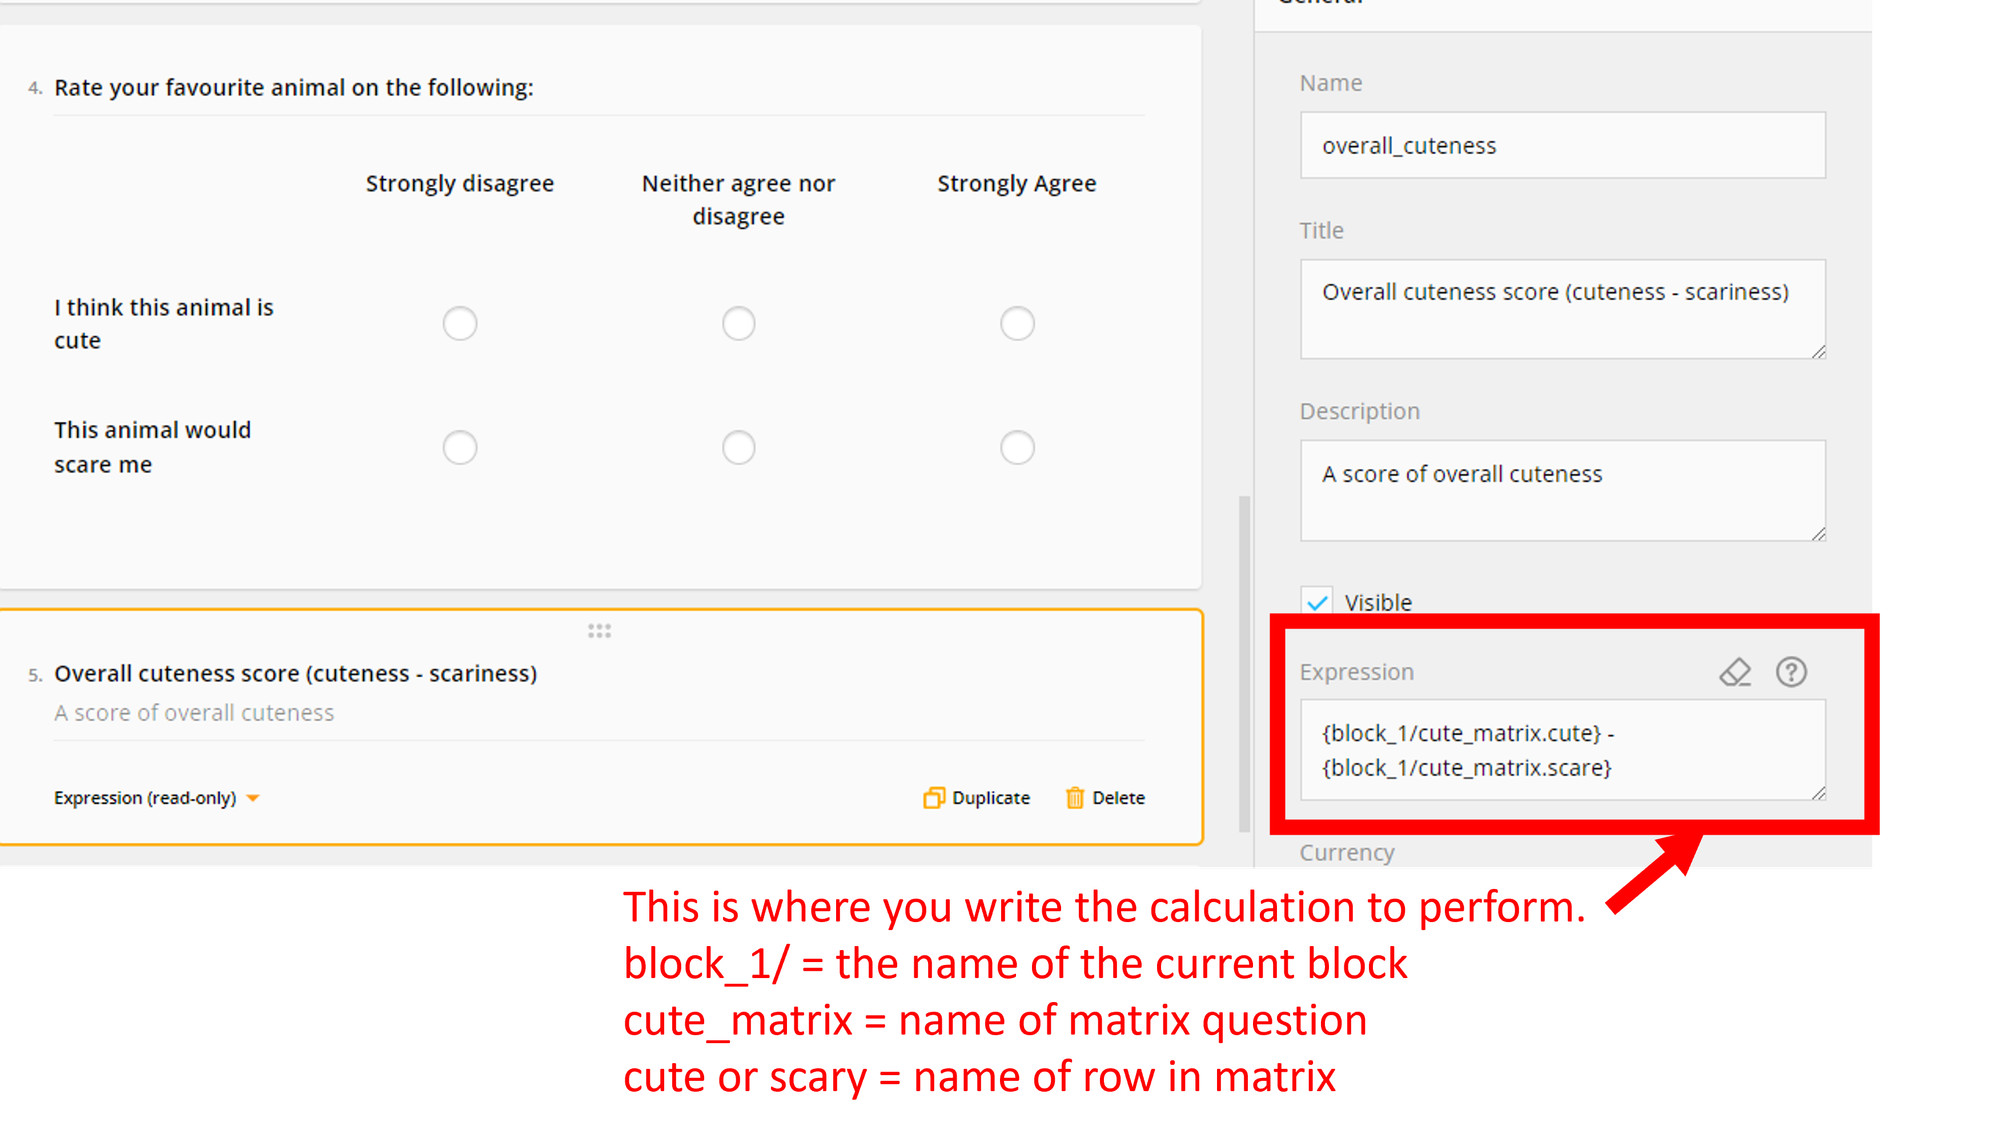
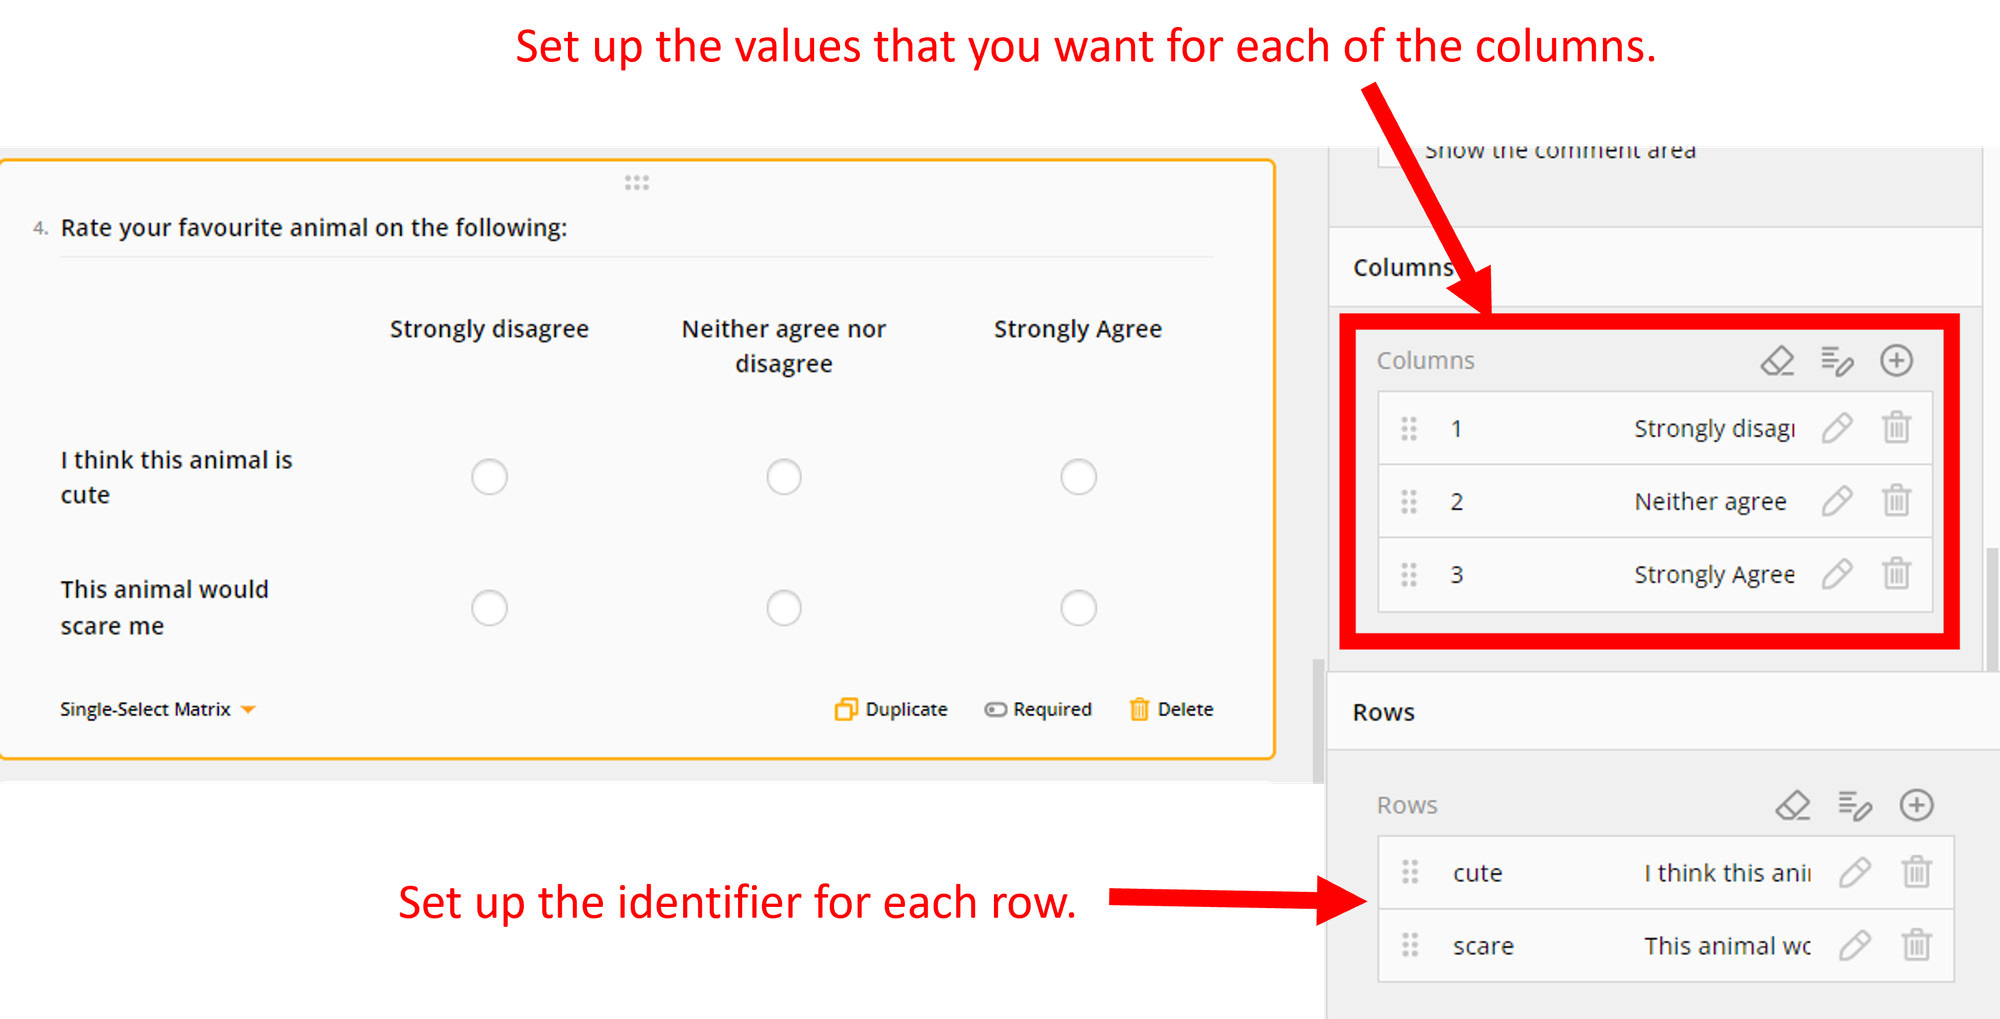
1. Set up a matrix question... asking how cute/scary an animal is. We set up the values for each column (Strongly Agree = 3, Strongly Disagree = 1) and the labels for the rows (cute and scare)
Yes, as @markhaselgrove.bsky.social points out above, Pavlovia Surveys come as part of a Pavlovia license (without a need for PsychoPy) and has a lot of the features of Q. It can even import QSF files from Qualtrics so you can export/import your previous surveys!
Being taught by your students. Living the dream! ❤️
Of course, analysing your data with a script (in R or Python, for instance) means that it doesn't matter how many extra rows and columns you have. That said, we do understand that for teaching especially visualising data in a spreadsheet can help, so keep these tips in mind! ❤️
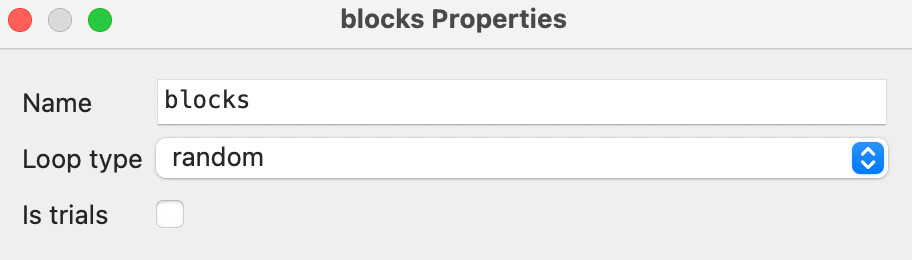
Reduce irrelevant rows Loops all have an "is trials" setting. That advances the data file by one line. Turn it off if you have a loop controlling stimuli within a trial, or blocks of trials, to reduce rows:
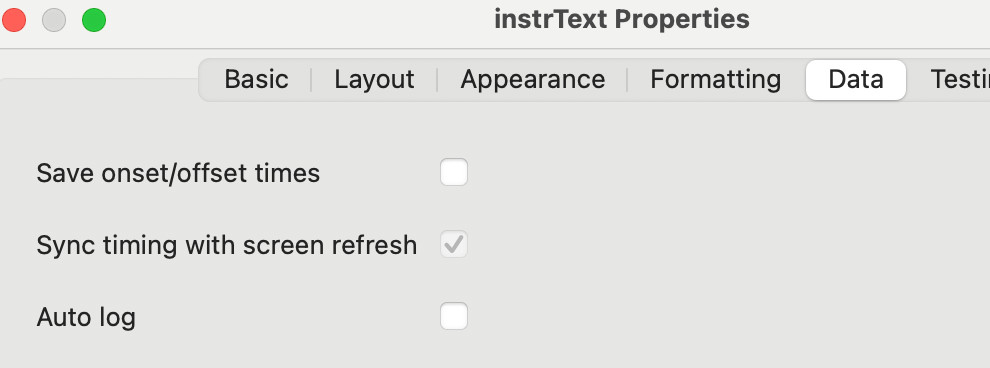
Deselect data saving for irrelevant Components Components that aren't important to your study execution (like the timing info for your instructions) can be turned off in their data tab: