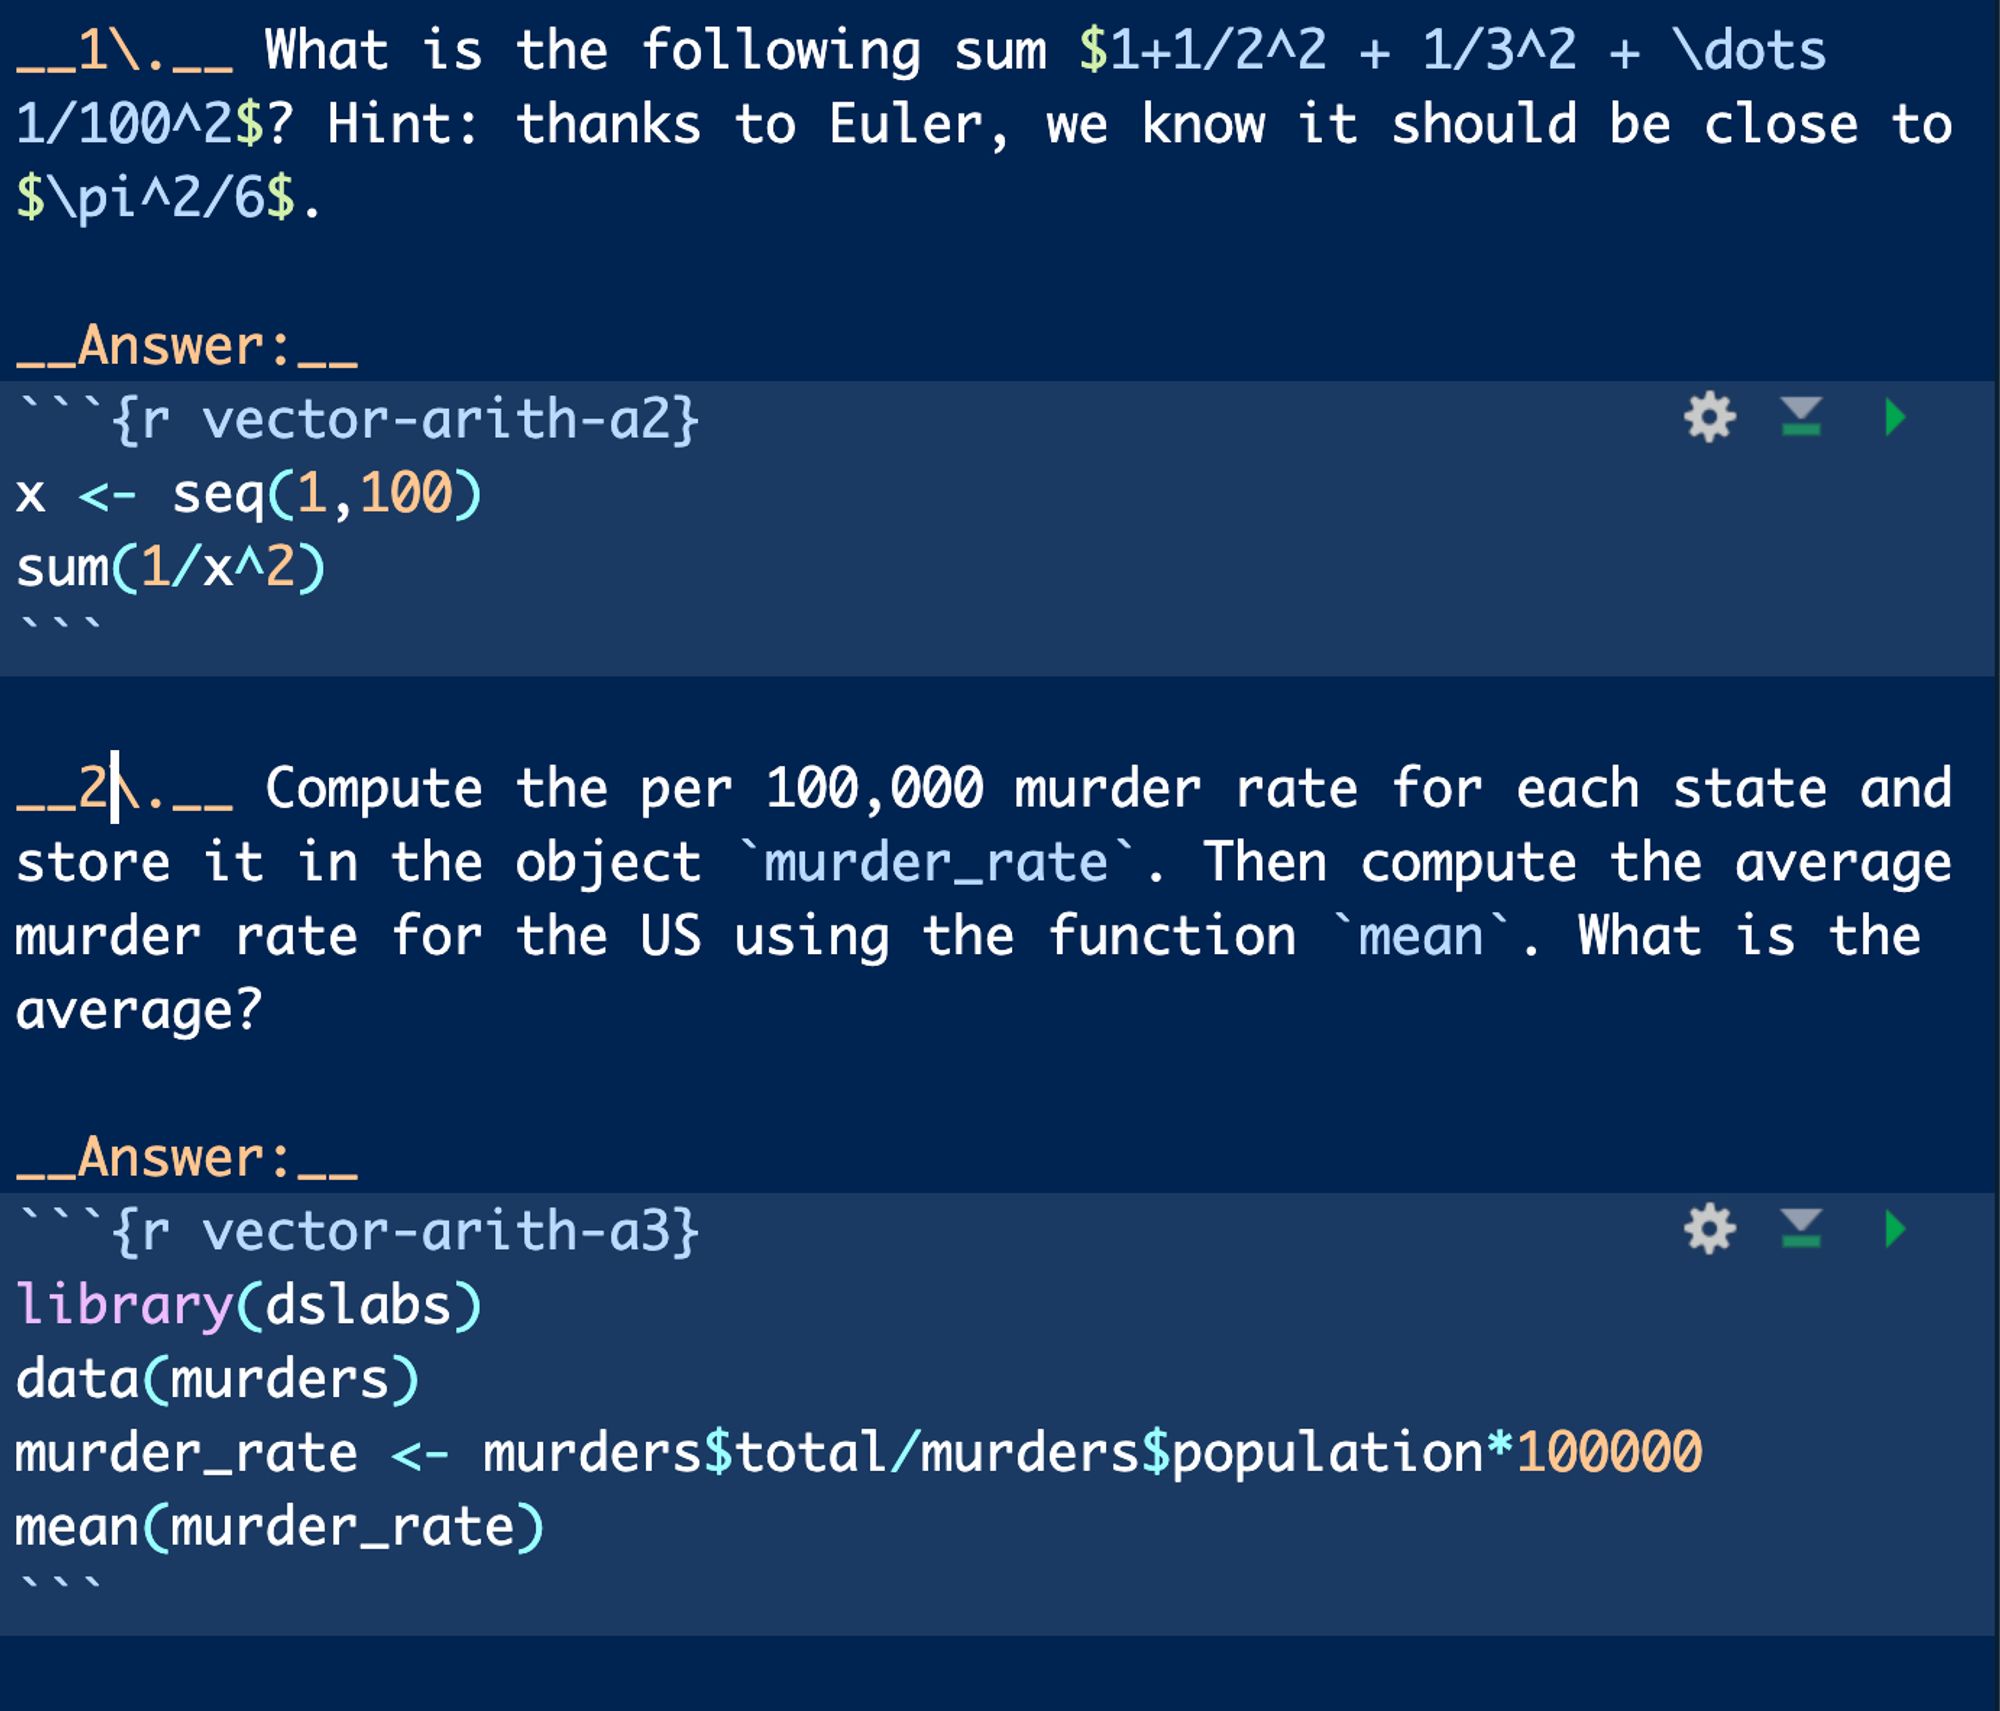
Hoy inicia nuestro Curso en español de Ciencia de Datos: Fundamentos de R en HarvardX! Aprenderás desde los básicos hasta data wrangling, conceptos de programación e importación de datos. La versión gratis y en línea te da acceso a los videos, textos y ejercicios. t.co/TGID4IwTSQ
Starting to work on it 😅
Data visualization is used in two ways in data analysis: 1) Communicating data insights. 2) Guiding analysis and spotting data issues. While modern courses and books focus on the first, it's the second - exploratory data analysis - that is more important and harder to teach.
Introducing the Data Science Postdoctoral Fellows Program at Harvard/DFCI! - Join a research group in our department - Co-mentoring opportunities with 2+ faculty - Collaborate with DFCI investigators beyond our department - Salary starts at $75K Apply here: ds.dfci.harvard.edu/postdocs/
