BLUE
Profile banner
RS
Robert Stewart
@robertstewart.io
Minnesotan in Maryland via Owatonna, St Paul, & UMN Asst Prof at UMD Criminology (criminal records, collateral consequences, civic engagement, public policy, data) "Funny here and there," according to one student robertstewart.io
189 followers638 following226 posts
RSrobertstewart.io

But first, I'm grateful to have been able to contribute to this work alongside the incomparable team of @chrisuggen.bsky.social@sarahksshannon.bsky.social (UGA), and Molly Hauf (Hamline) with support from Olivia Nesgoda (Hamline) and Caleigh Lueder (UMN).

1

RSrobertstewart.io

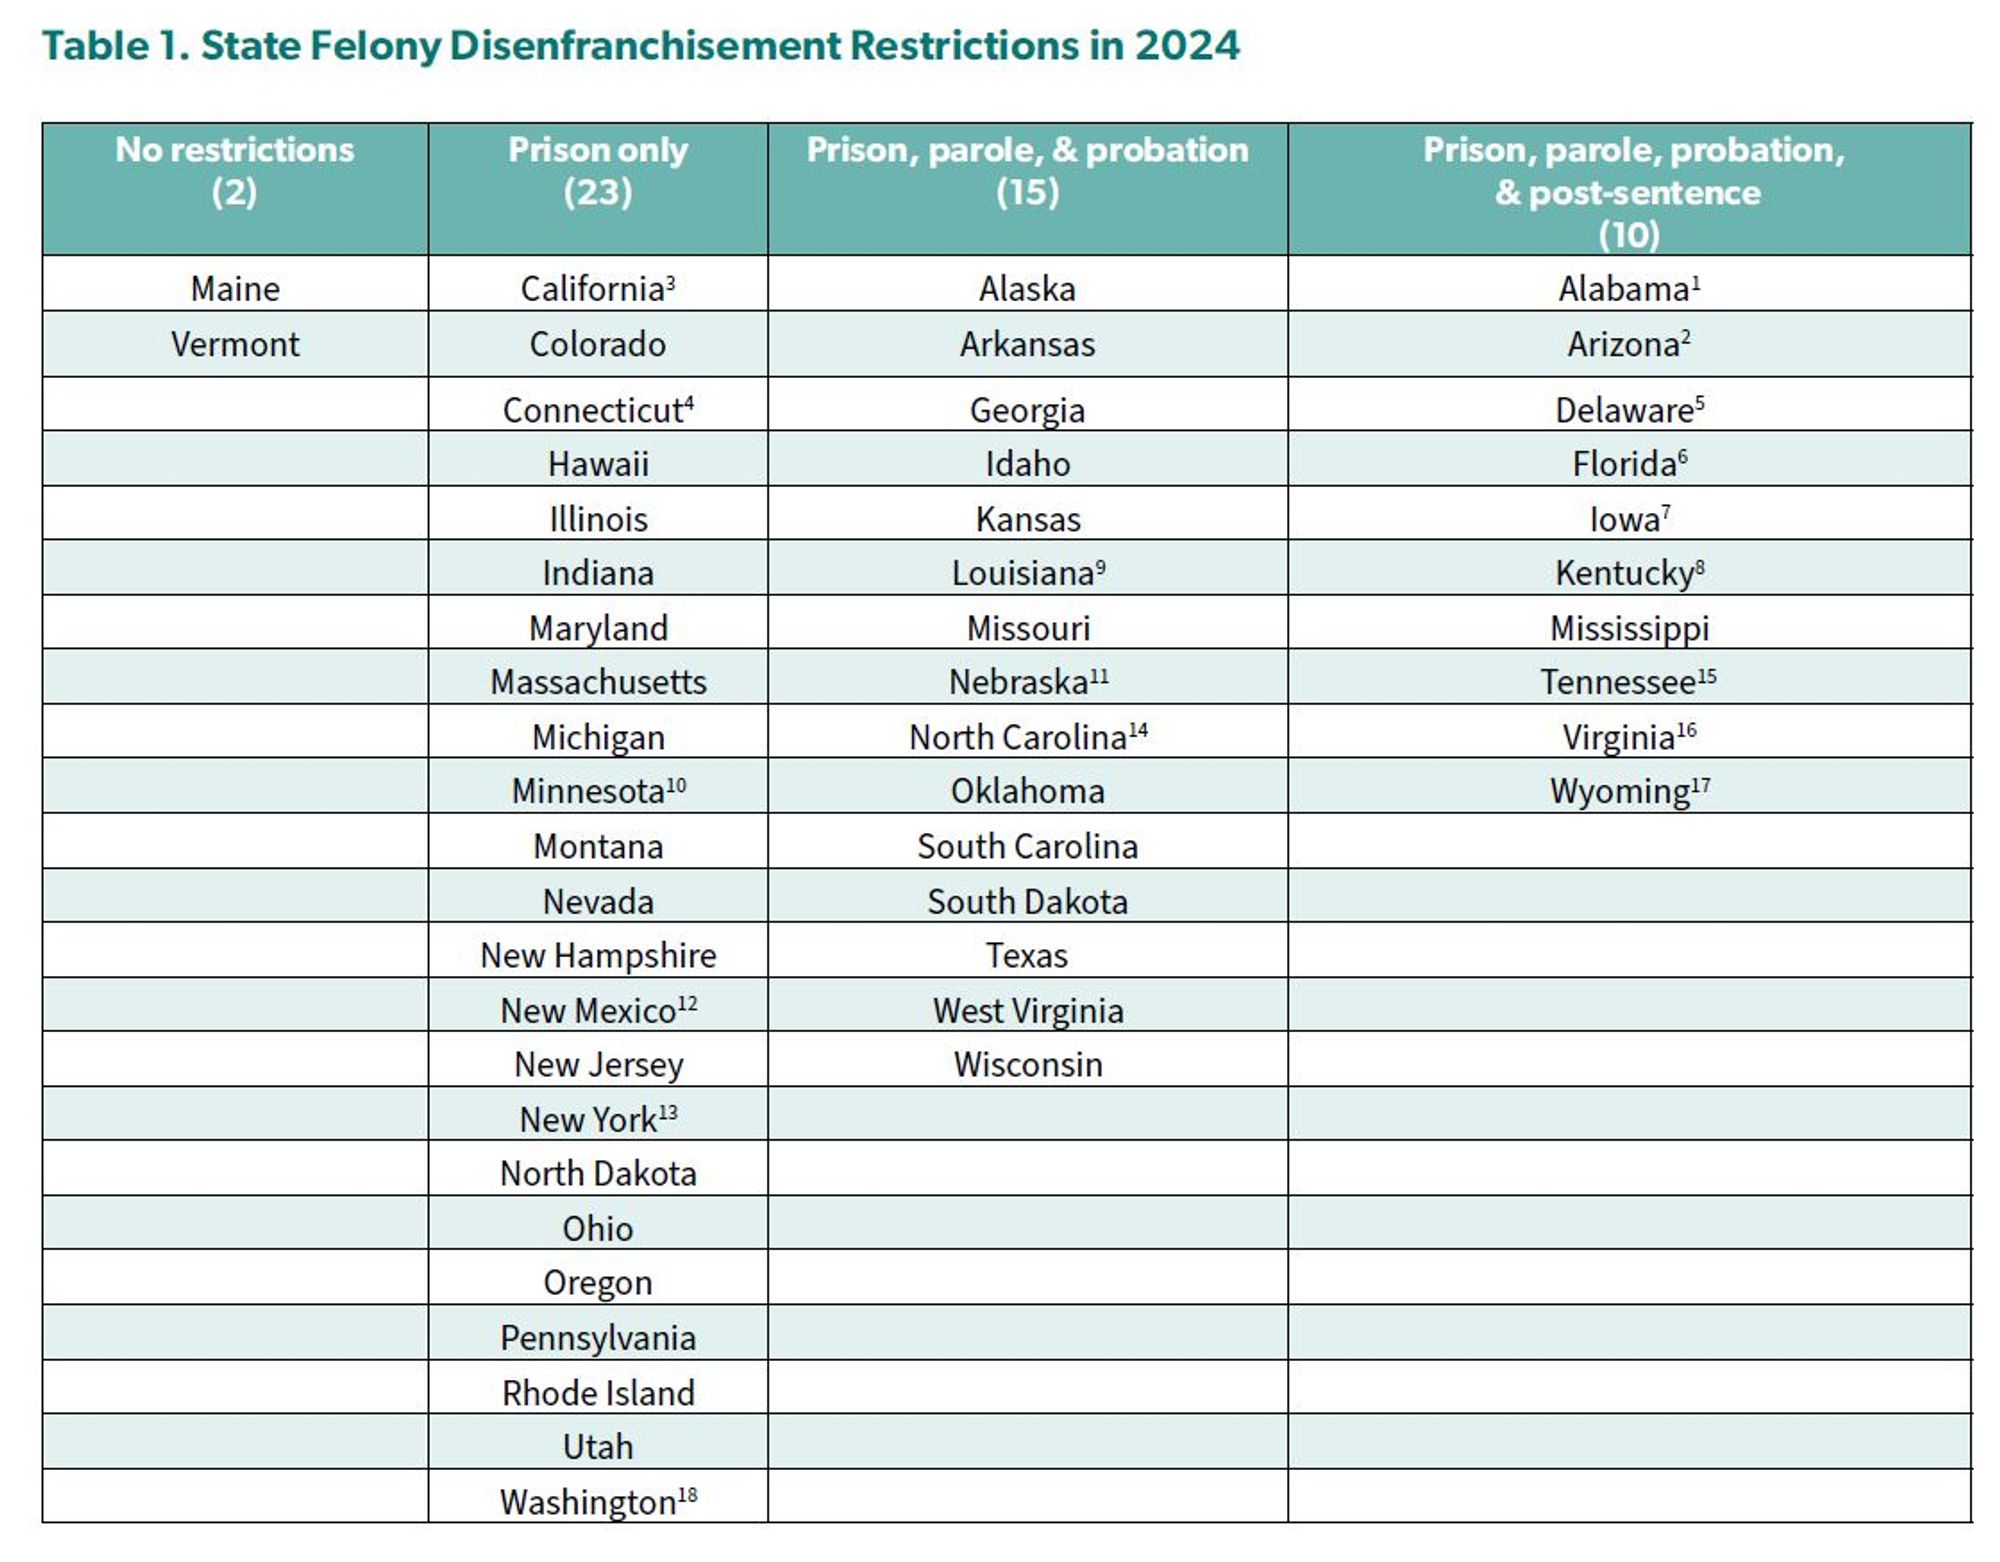
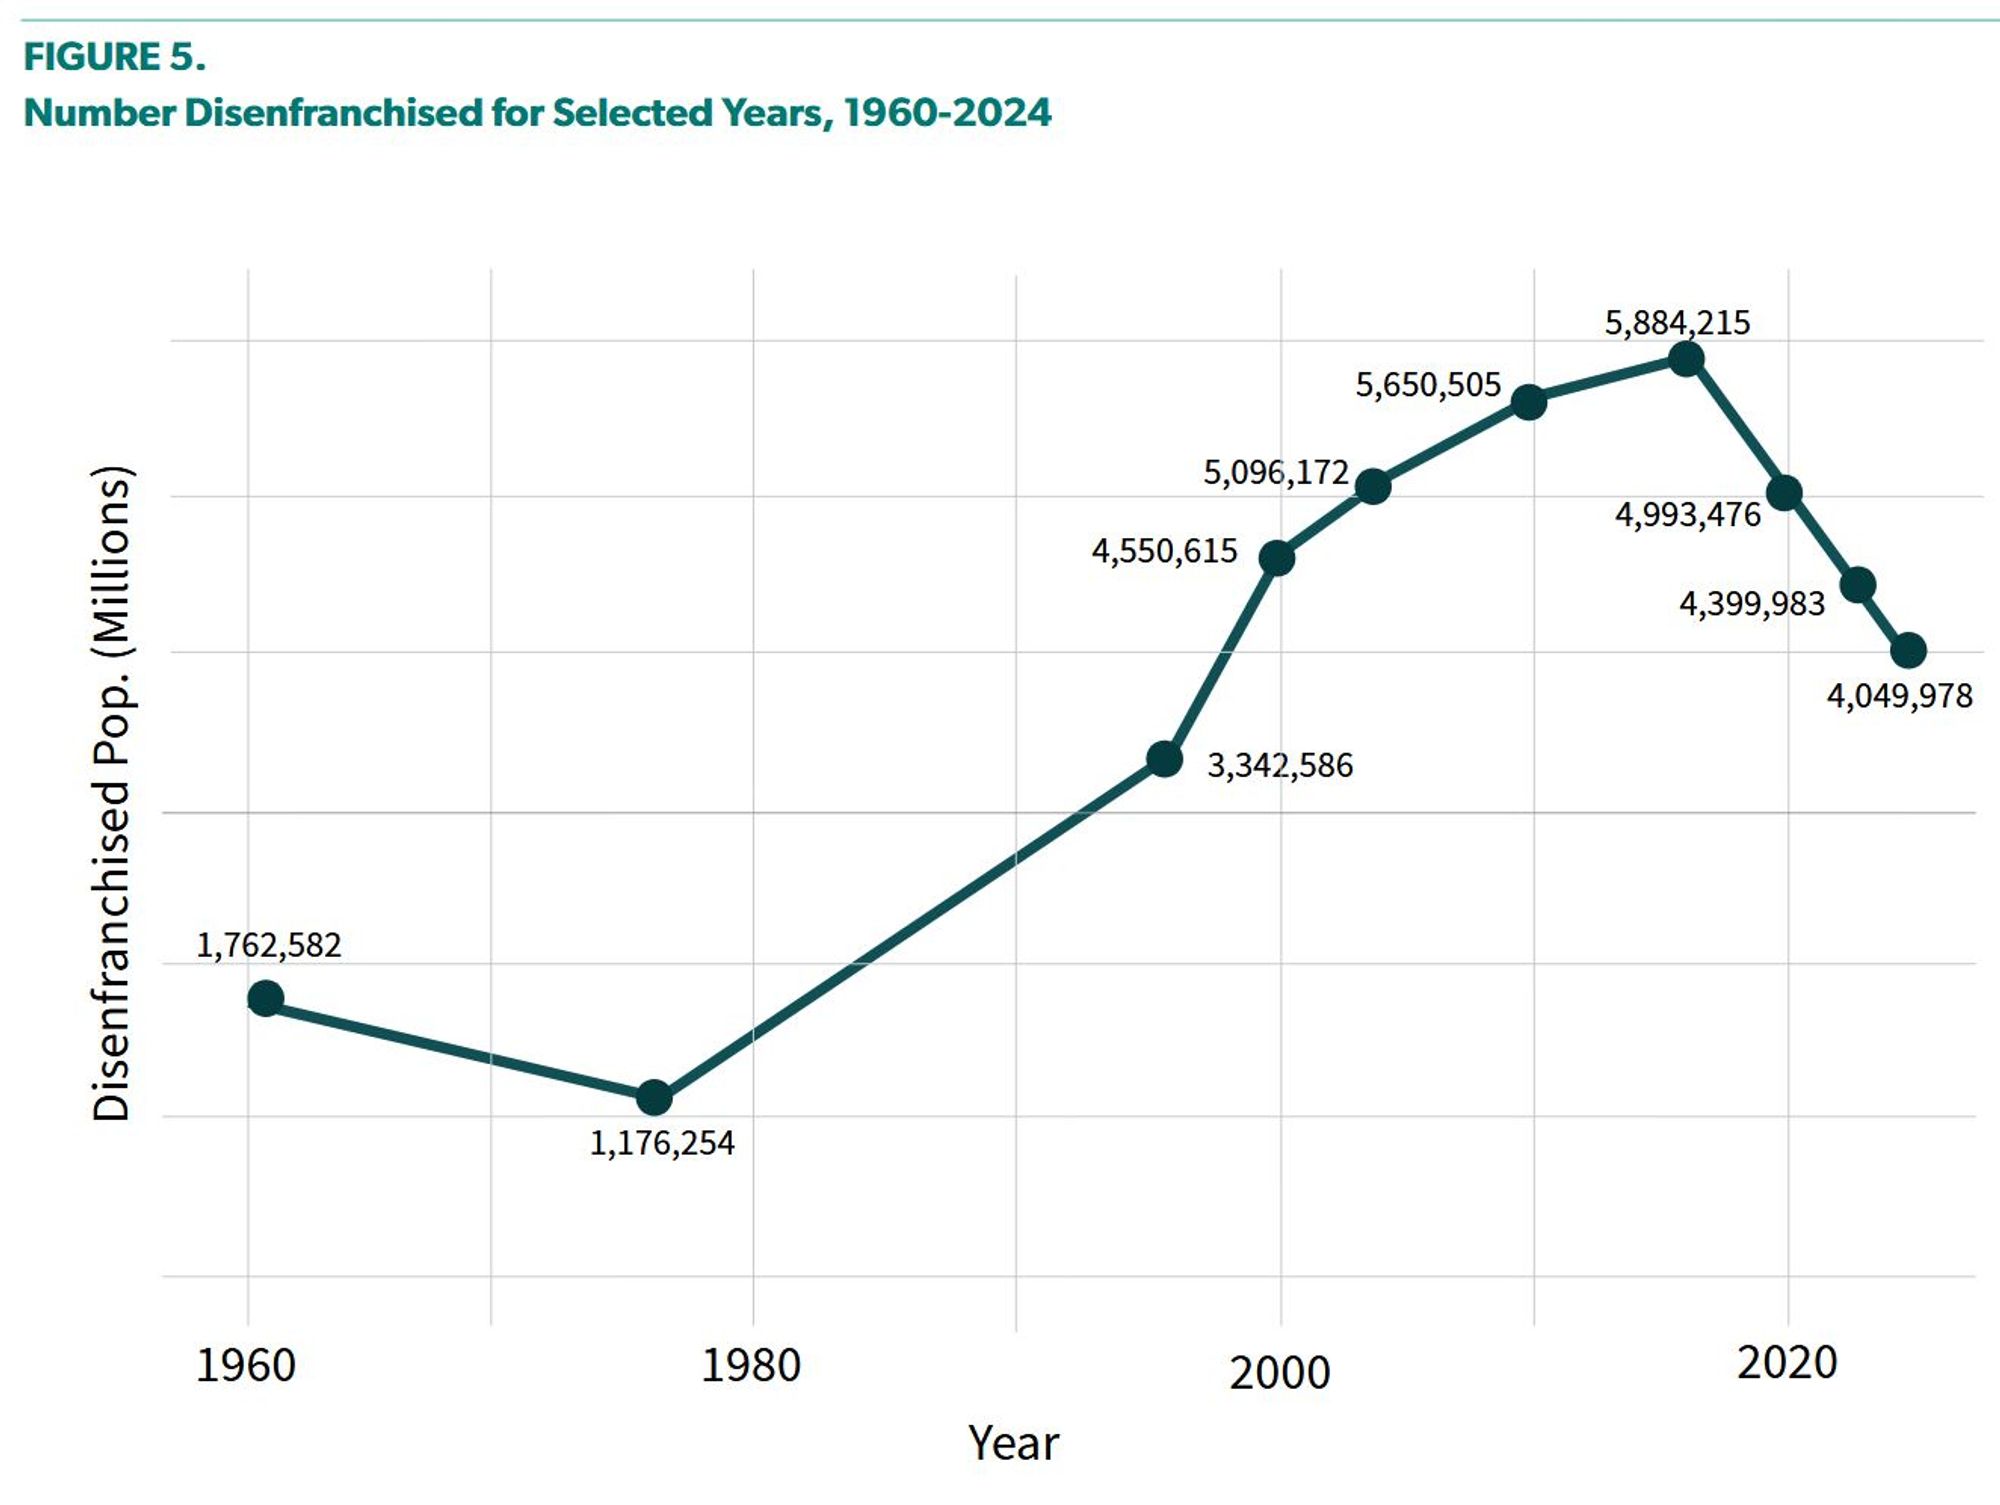
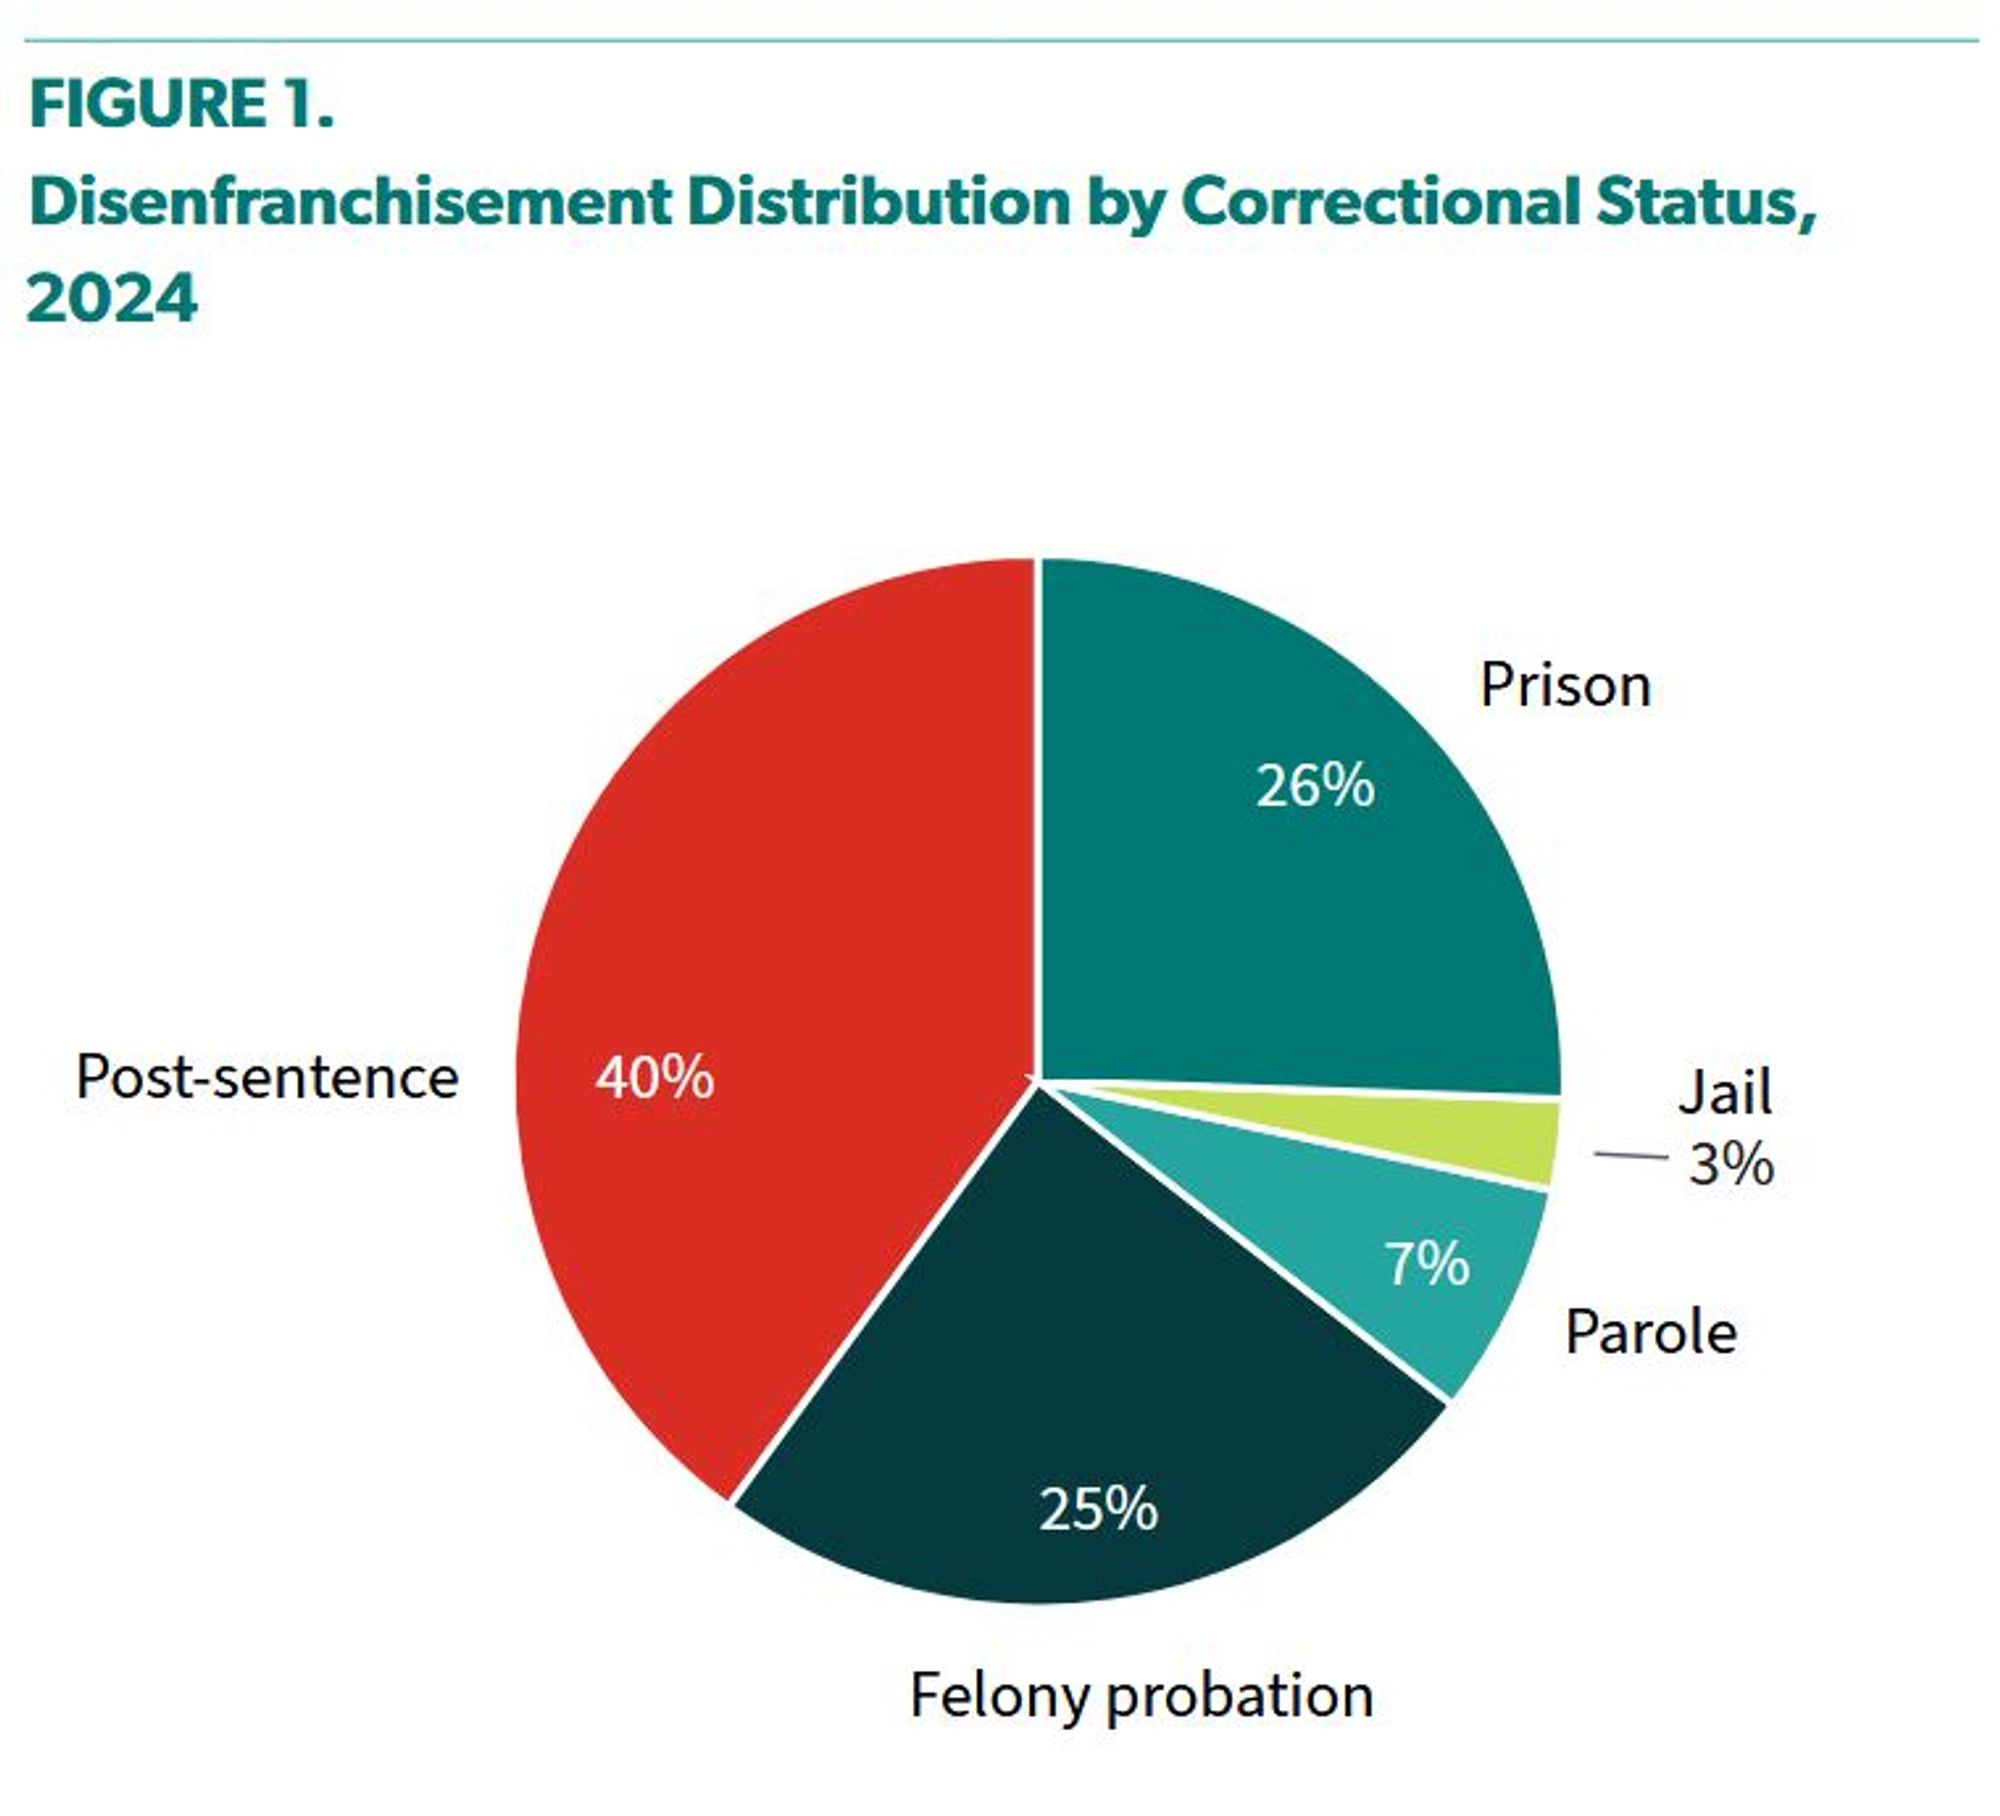
States have moved toward more narrow disenfranchising restrictions over the last ten years, resulting in a significant decrease in the disenfranchised population over time. As in previous years, a plurality of the disenfranchised population are post-sentence.

Table 1. State Felony Disenfranchisement Restrictions in 2024

This table categorizes U.S. states based on felony disenfranchisement restrictions into four groups:

    No restrictions (2 states):
        Maine
        Vermont

    Prison only (23 states):
        California, Colorado, Connecticut, Hawaii, Illinois, Indiana, Maryland, Massachusetts, Michigan, Minnesota, Montana, Nevada, New Hampshire, New Mexico, New Jersey, New York, North Dakota, Ohio, Oregon, Pennsylvania, Rhode Island, Utah, Washington

    Prison, parole, & probation (15 states):
        Alaska, Arkansas, Georgia, Idaho, Kansas, Louisiana, Missouri, Nebraska, North Carolina, Oklahoma, South Carolina, South Dakota, Texas, West Virginia, Wisconsin

    Prison, parole, probation, & post-sentence (10 states):
        Alabama, Arizona, Delaware, Florida, Iowa, Kentucky, Mississippi, Tennessee, Virginia, Wyoming
Figure 5. Number Disenfranchised for Selected Years, 1960–2024

This line graph shows the trend in the number of disenfranchised people (in millions) in the United States over selected years from 1960 to 2024:

    1960: 1,762,582
    1980: 1,176,254
    1996: 3,342,586
    2004: 4,550,615
    2008: 5,096,172
    2012: 5,650,505
    2016: 5,884,215 (peak)
    2020: 4,993,476
    2022: 4,399,983
    2024: 4,049,978

The graph shows a general increase in disenfranchised individuals, peaking in 2016, followed by a decline in recent years.
Figure 1. Disenfranchisement Distribution by Correctional Status, 2024

This pie chart displays the percentage distribution of disenfranchised individuals in 2024 by correctional status:

    Post-sentence: 40%
    Prison: 26%
    Felony probation: 25%
    Parole: 7%
    Jail: 3%
1
Profile banner
RS
Robert Stewart
@robertstewart.io
Minnesotan in Maryland via Owatonna, St Paul, & UMN Asst Prof at UMD Criminology (criminal records, collateral consequences, civic engagement, public policy, data) "Funny here and there," according to one student robertstewart.io
189 followers638 following226 posts