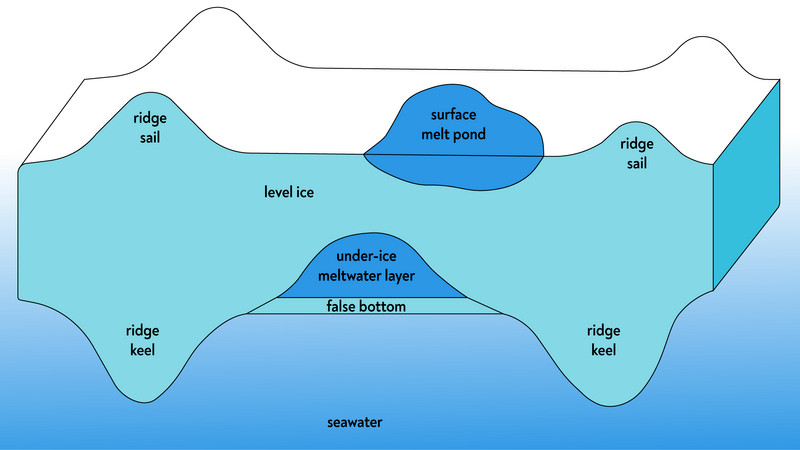
One of my guilty pleasures is updating Wikipedia about my favorite topics. I like imperfect Wiki for being neutral by design, written by hundreds of authors with diverse worldviews, and looking like scientific papers, as everything should be referenced. This is from the page about false bottoms:
Great talk and fascinating ponds. I was not expecting that we both worked with some cool products from Niklas =)
Dear Jenny, I think, you may want to update the YouTube link here.
When sea ice melts, even after snow is gone, it looks like snow because of the meltwater drainage. In the new study by @madm-ice.bsky.socialdoi.org/10.1029/2022...
Arctic sea ice drifts around twice as fast during the summer (Olason and Notz, 2014). Its drift speed correlates with ice thickness at high ice concentrations. But during the summer, ice also loses its roughness as thicker ice melts faster (color map is from @fabiocrameri.ch):
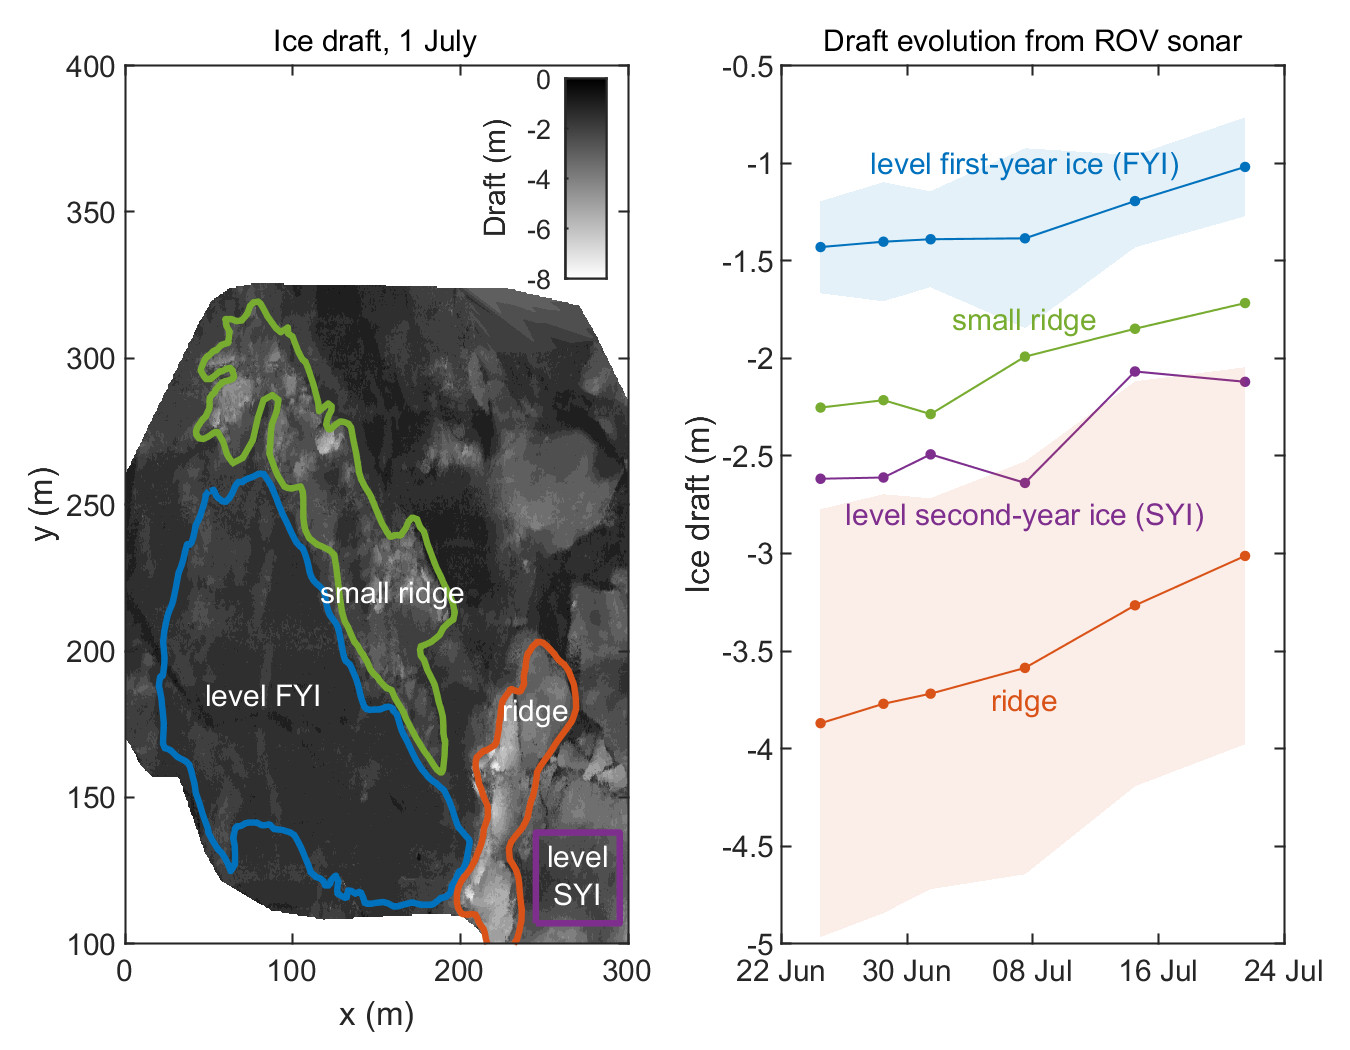
A single number is not enough to understand ridge melt enhancement. Some of our ridge cross-sections melted by only 0.2 m, while others by 2.6 m. So we also showed key characteristics defining ridge melt. Deeper, narrower, and steeper ridges melt faster. The largest melt occurs at the ridge corners.

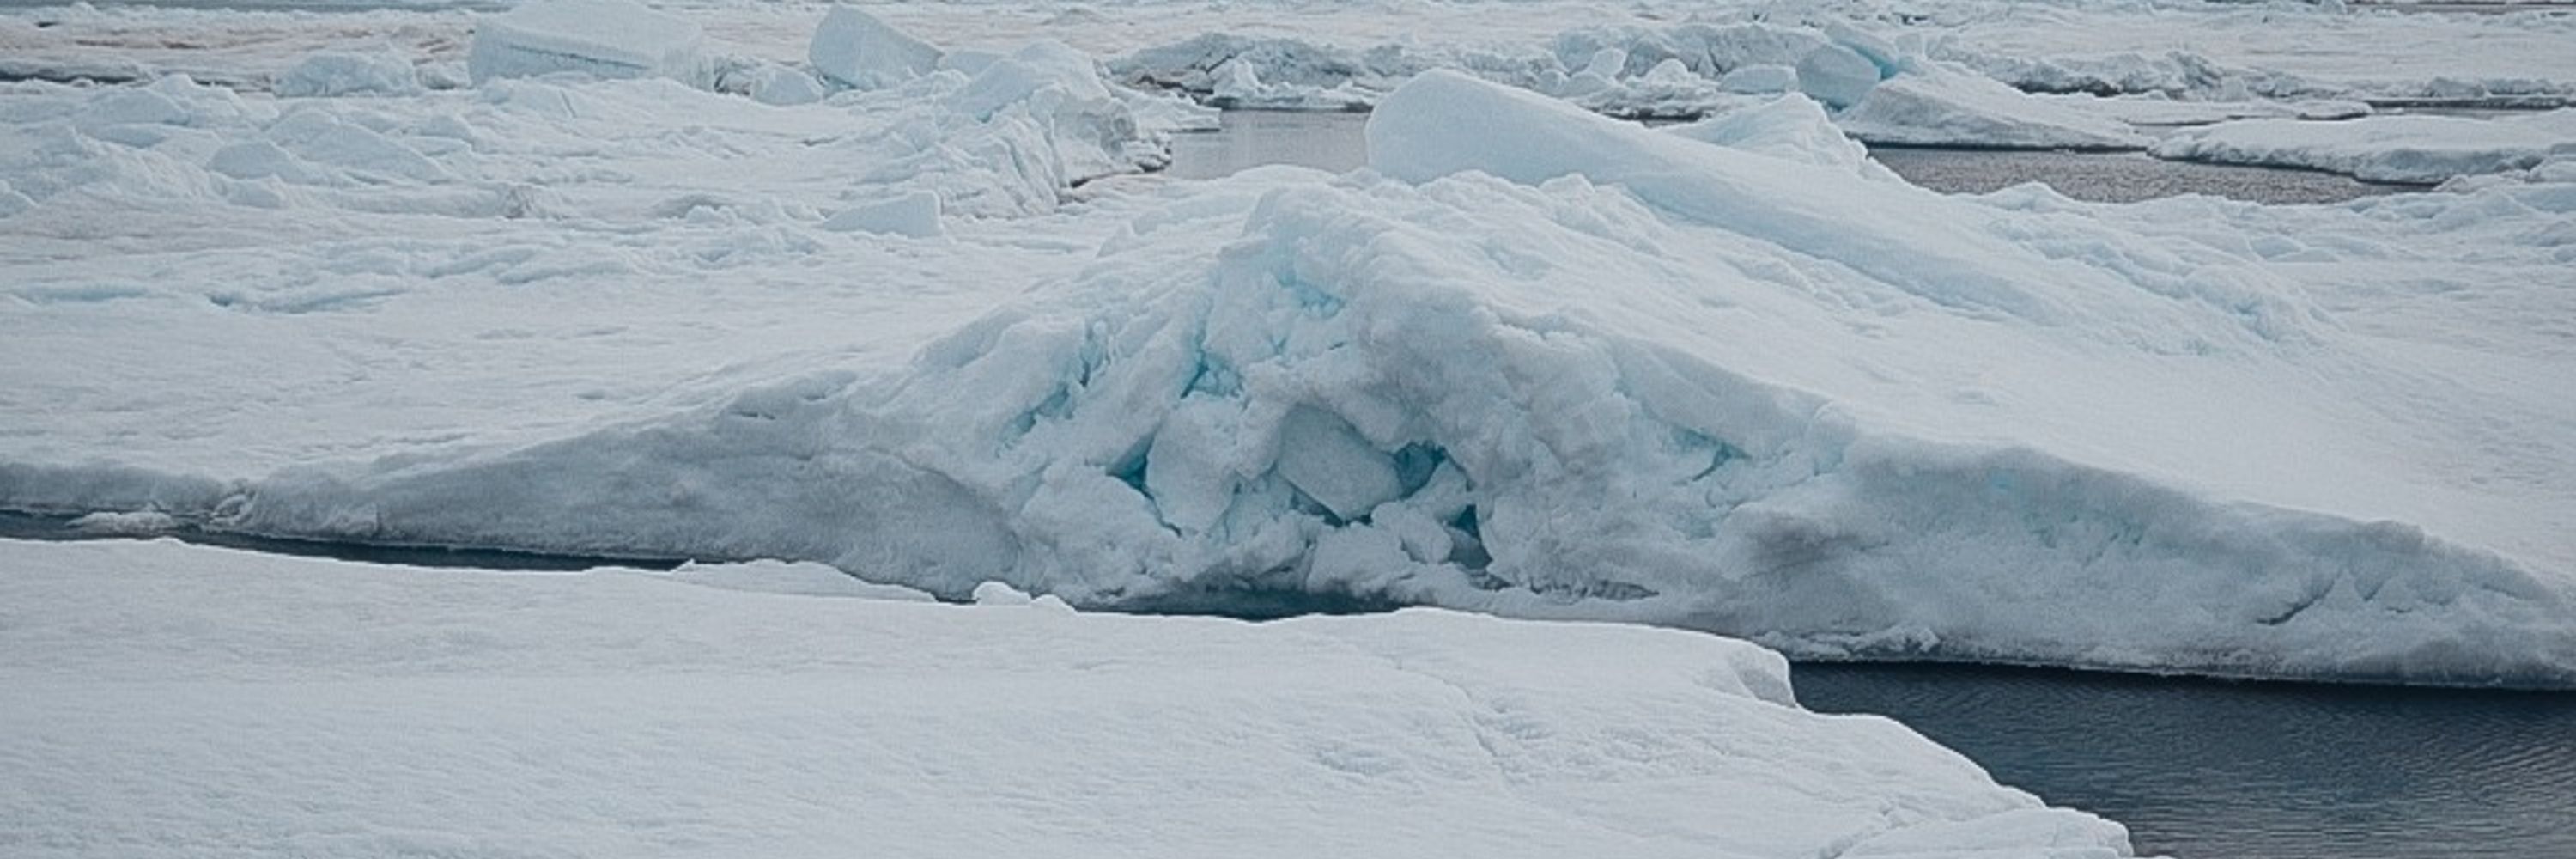
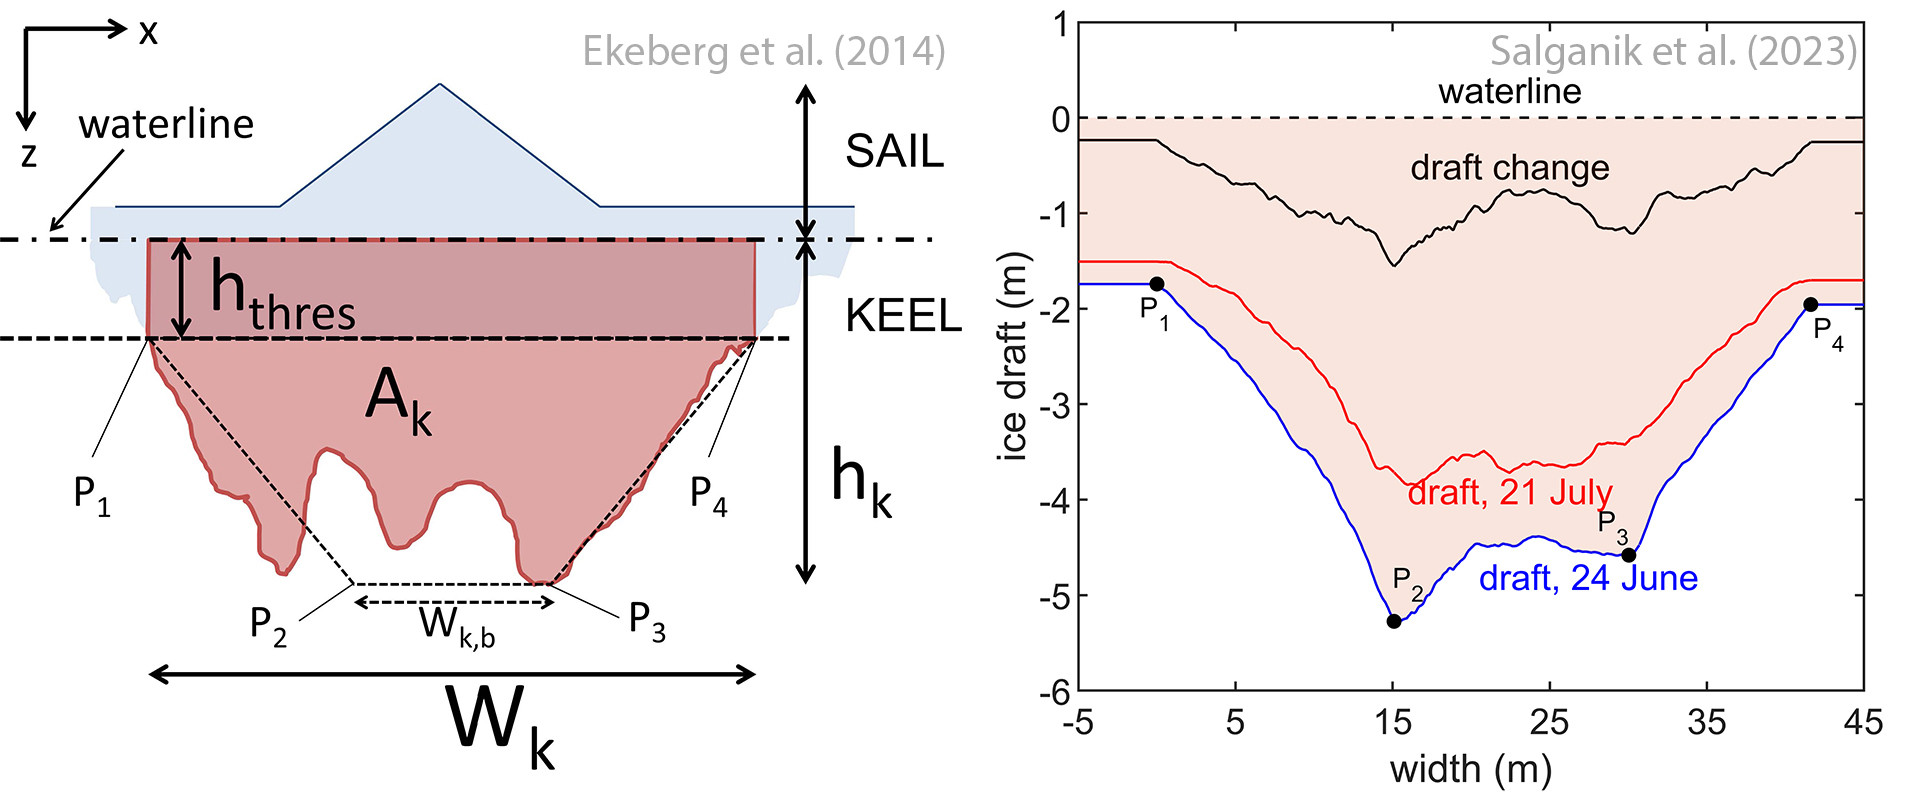
We compared Fram Strait sea-ice ridge shapes from ROV sonar with moored sonar measurements from Ekeberg et al. (2014). On average, we had a two-times wider bottom ridge width, covering 38% of the total width, yet 10% of cross-sections were absolutely not trapezoidal:
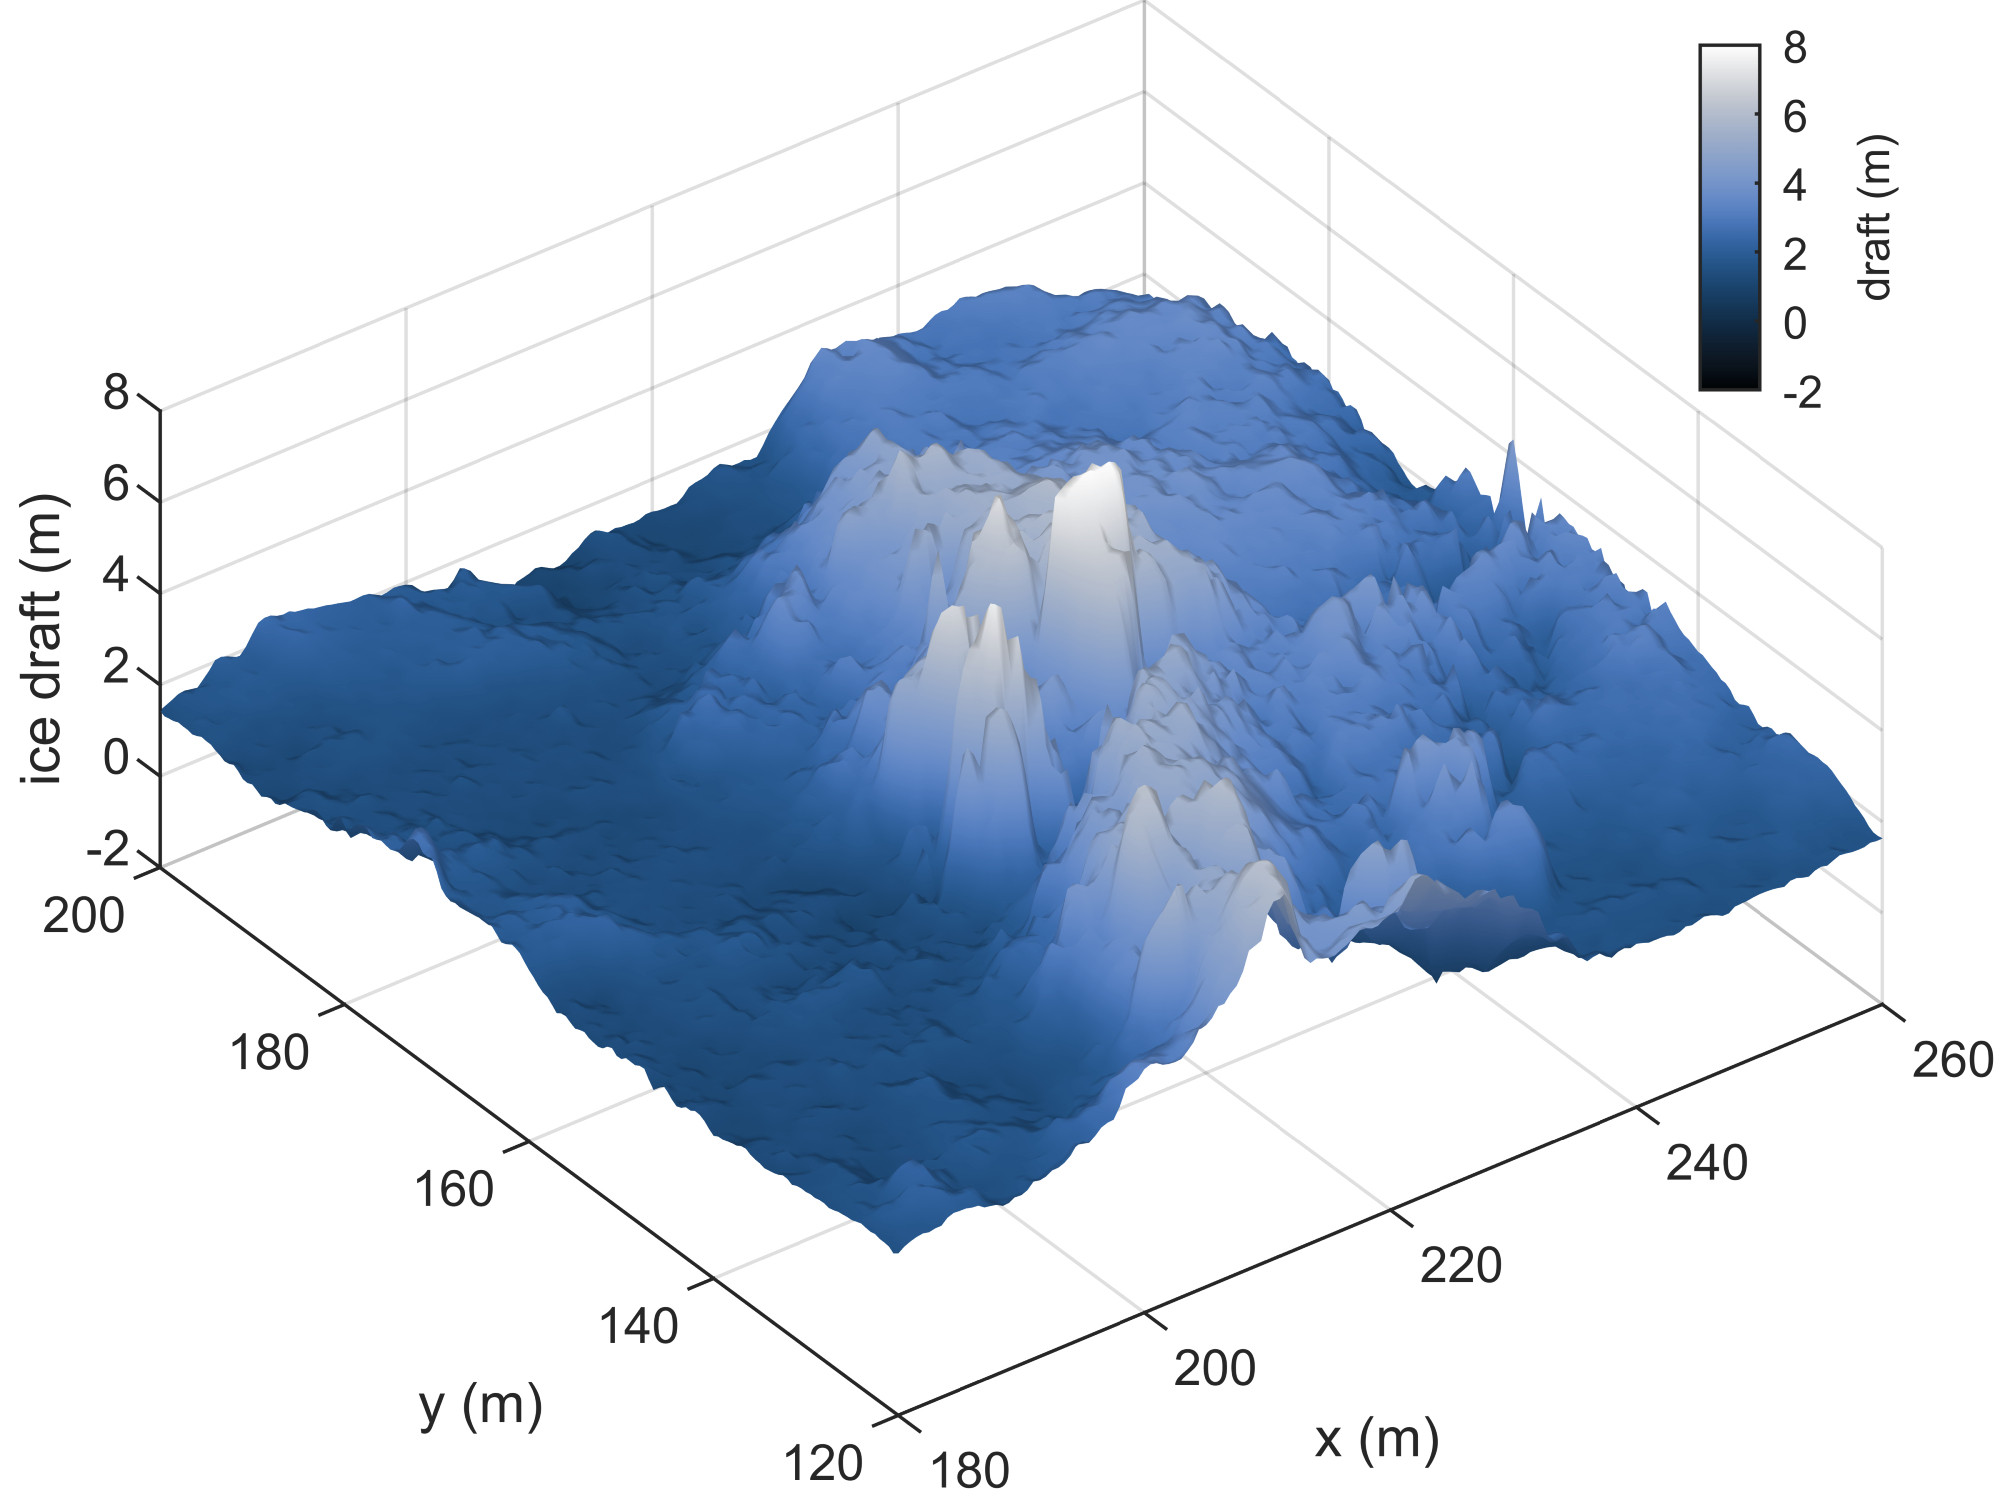
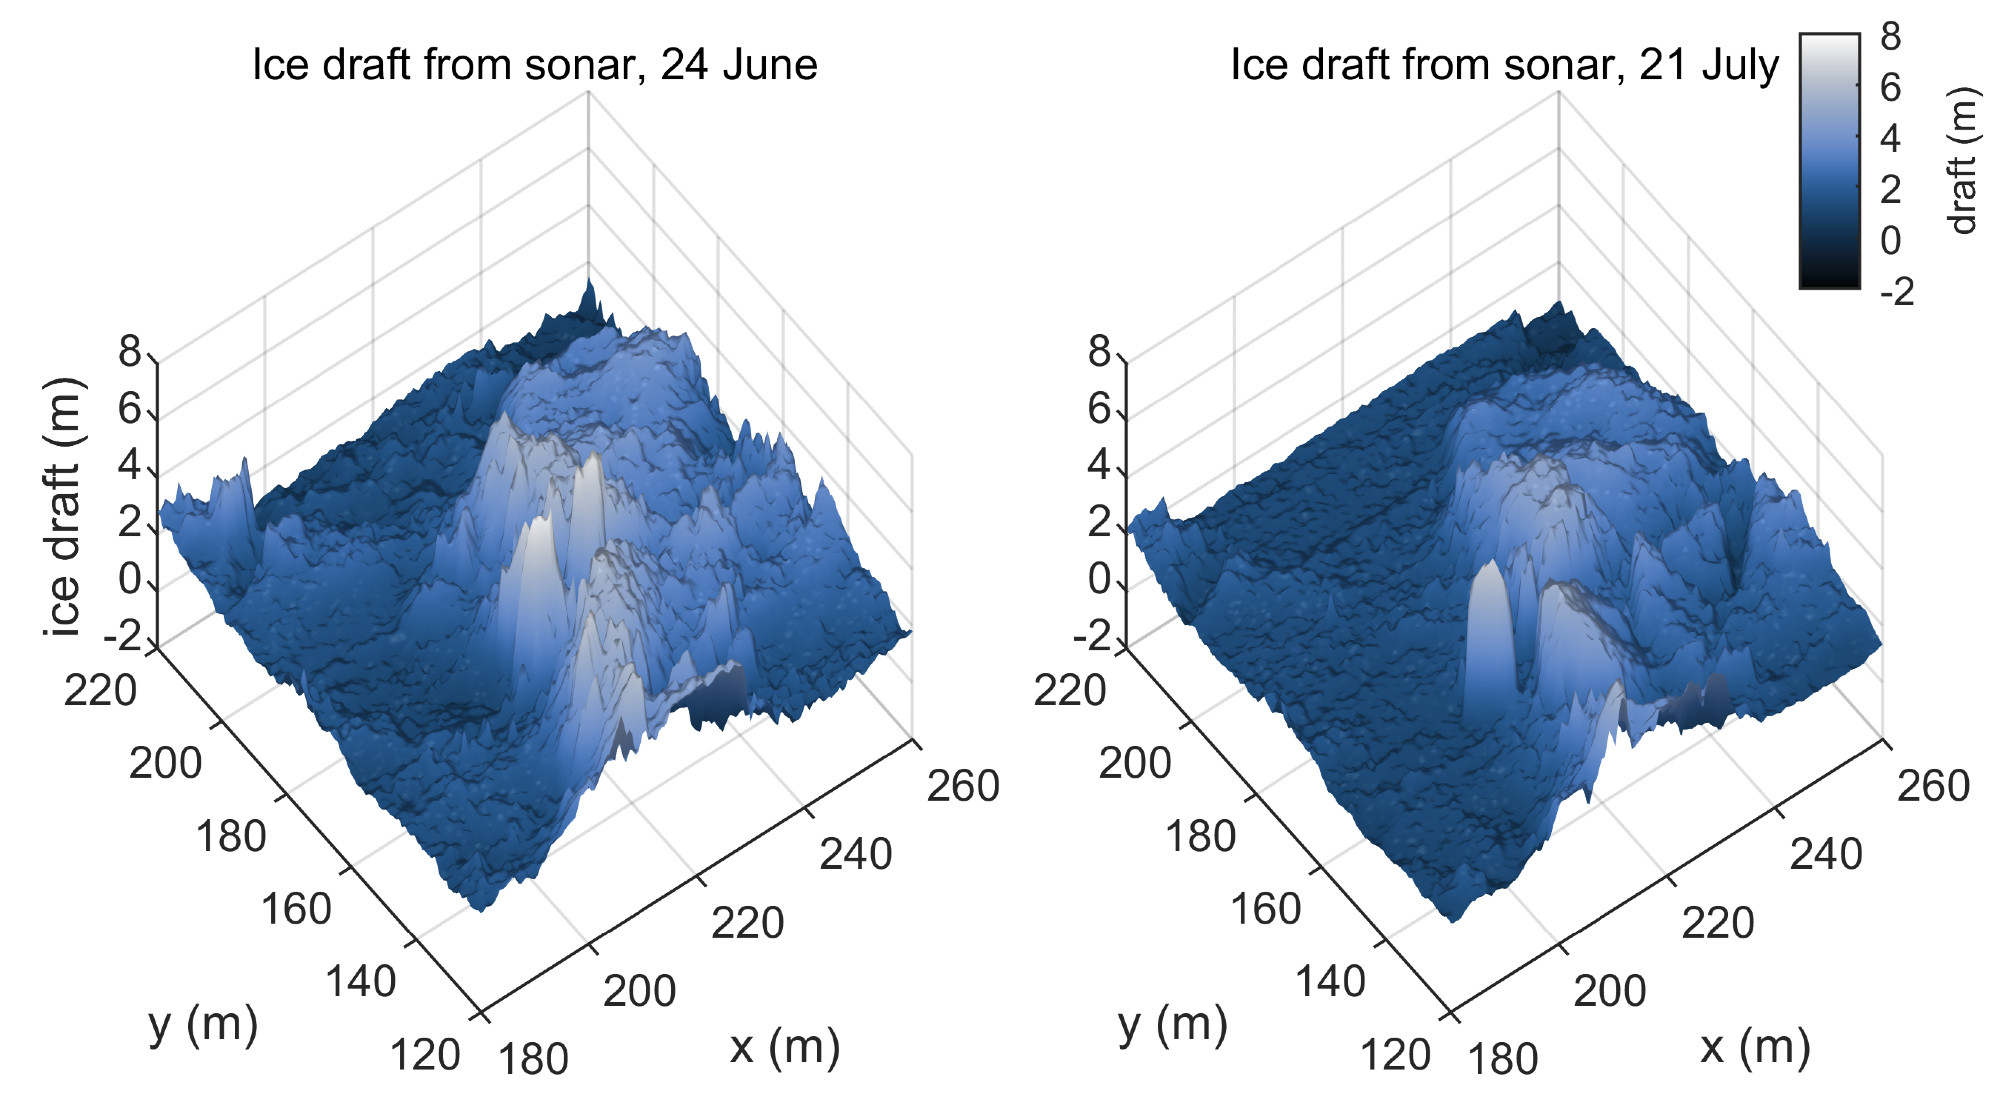
Sea-ice ridges are often thought of as lines with trapezoidal cross-sections but in 3D they look quite more complex: