BLUE
Profile banner
BS
BikeHfx stats
@stats.hfx.bike
Halifax bike stats, curated by robots. hfx.bike/bikehfxstats
65 followers0 following585 posts
BSstats.hfx.bike

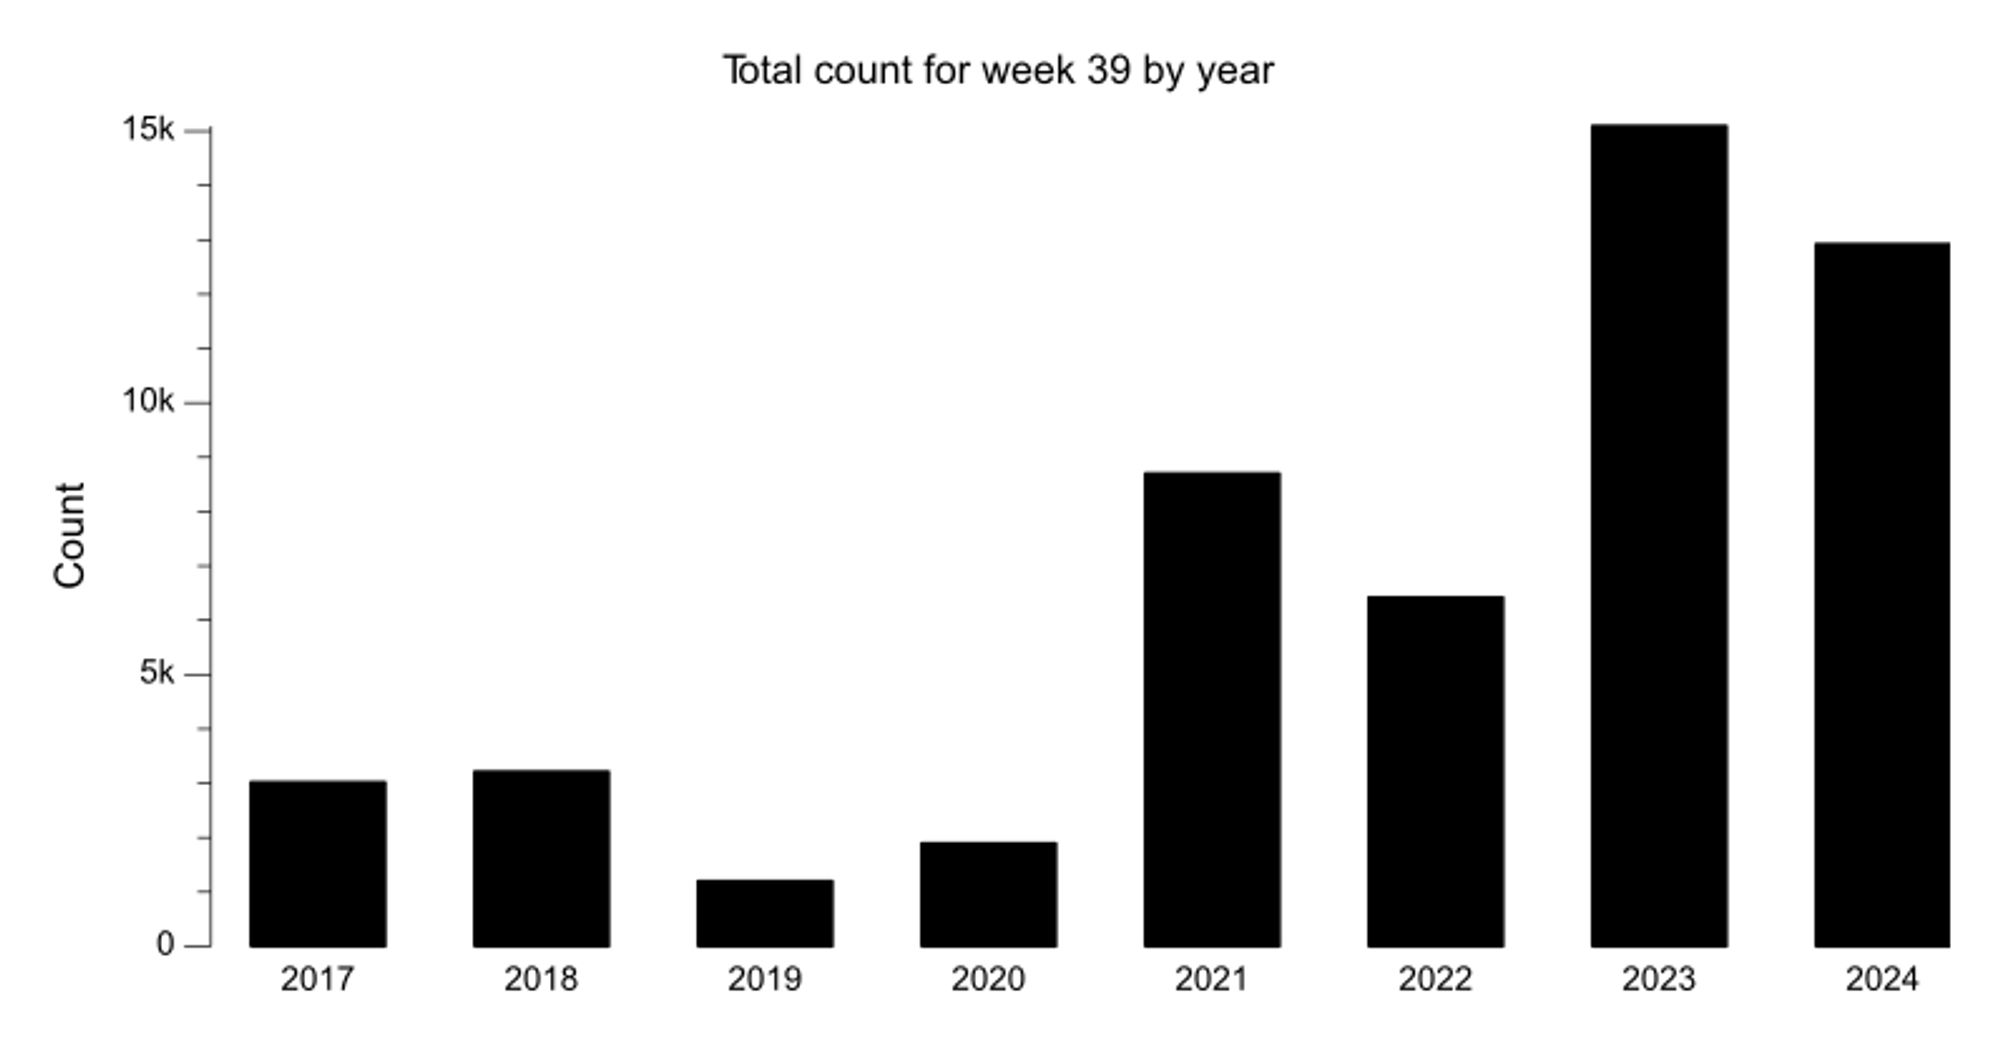
Previous year counts for week 39: 2024: 12,920 2023: 15,095 2022: 6,419 2021: 8,699 2020: 1,893 2019: 1,198 2018: 3,212 2017: 3,017

Bar chart of bikes counted for week 39 over last 8 years. The most recent year had 12,920 bikes counted, 14% fewer than the previous year.
Chart with line per year's total count by week for recent years
0
BSstats.hfx.bike

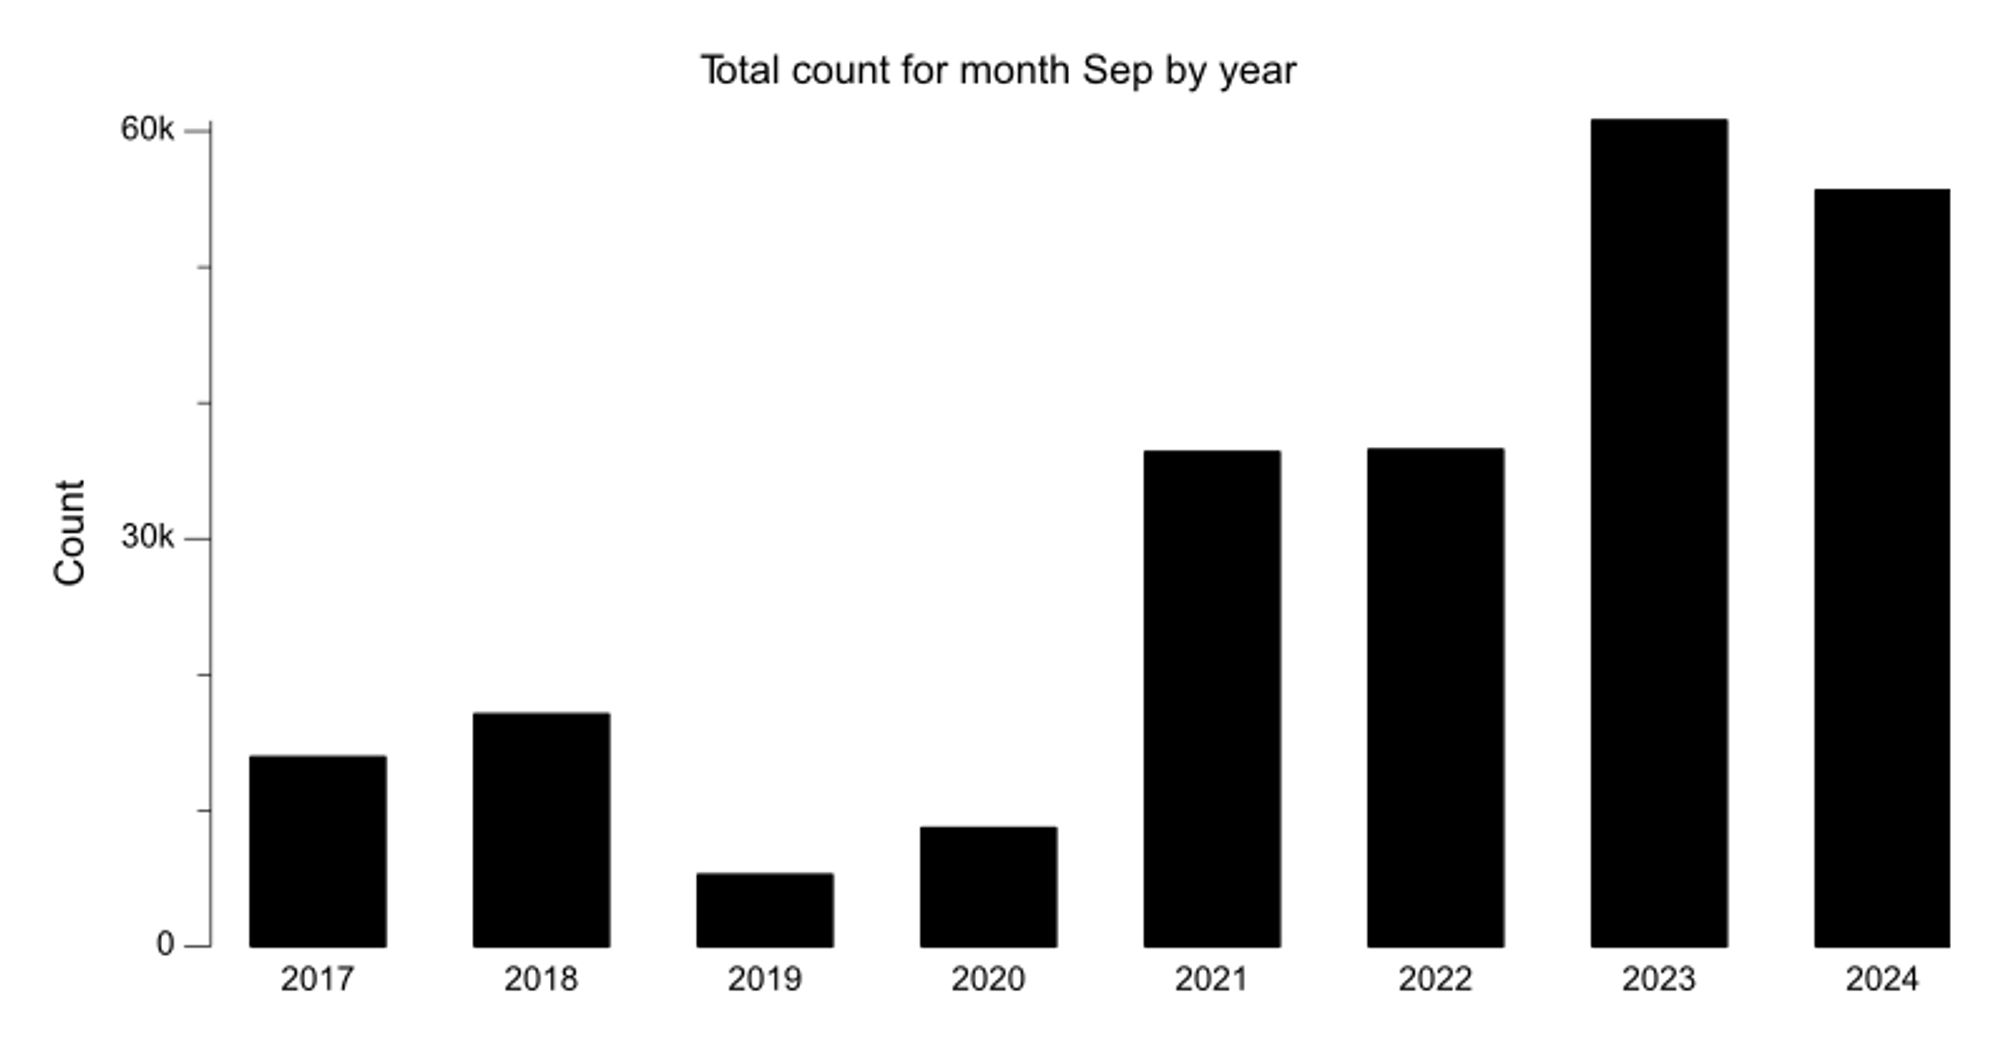
Previous year counts for Sep: 2024: 55,624 2023: 60,775 2022: 36,543 2021: 36,366 2020: 8,689 2019: 5,253 2018: 17,066 2017: 13,913

Bar chart of bikes counted for month Sep over last 8 years. The most recent year had 55,624 bikes counted, 8% fewer than the previous year.
0
BSstats.hfx.bike

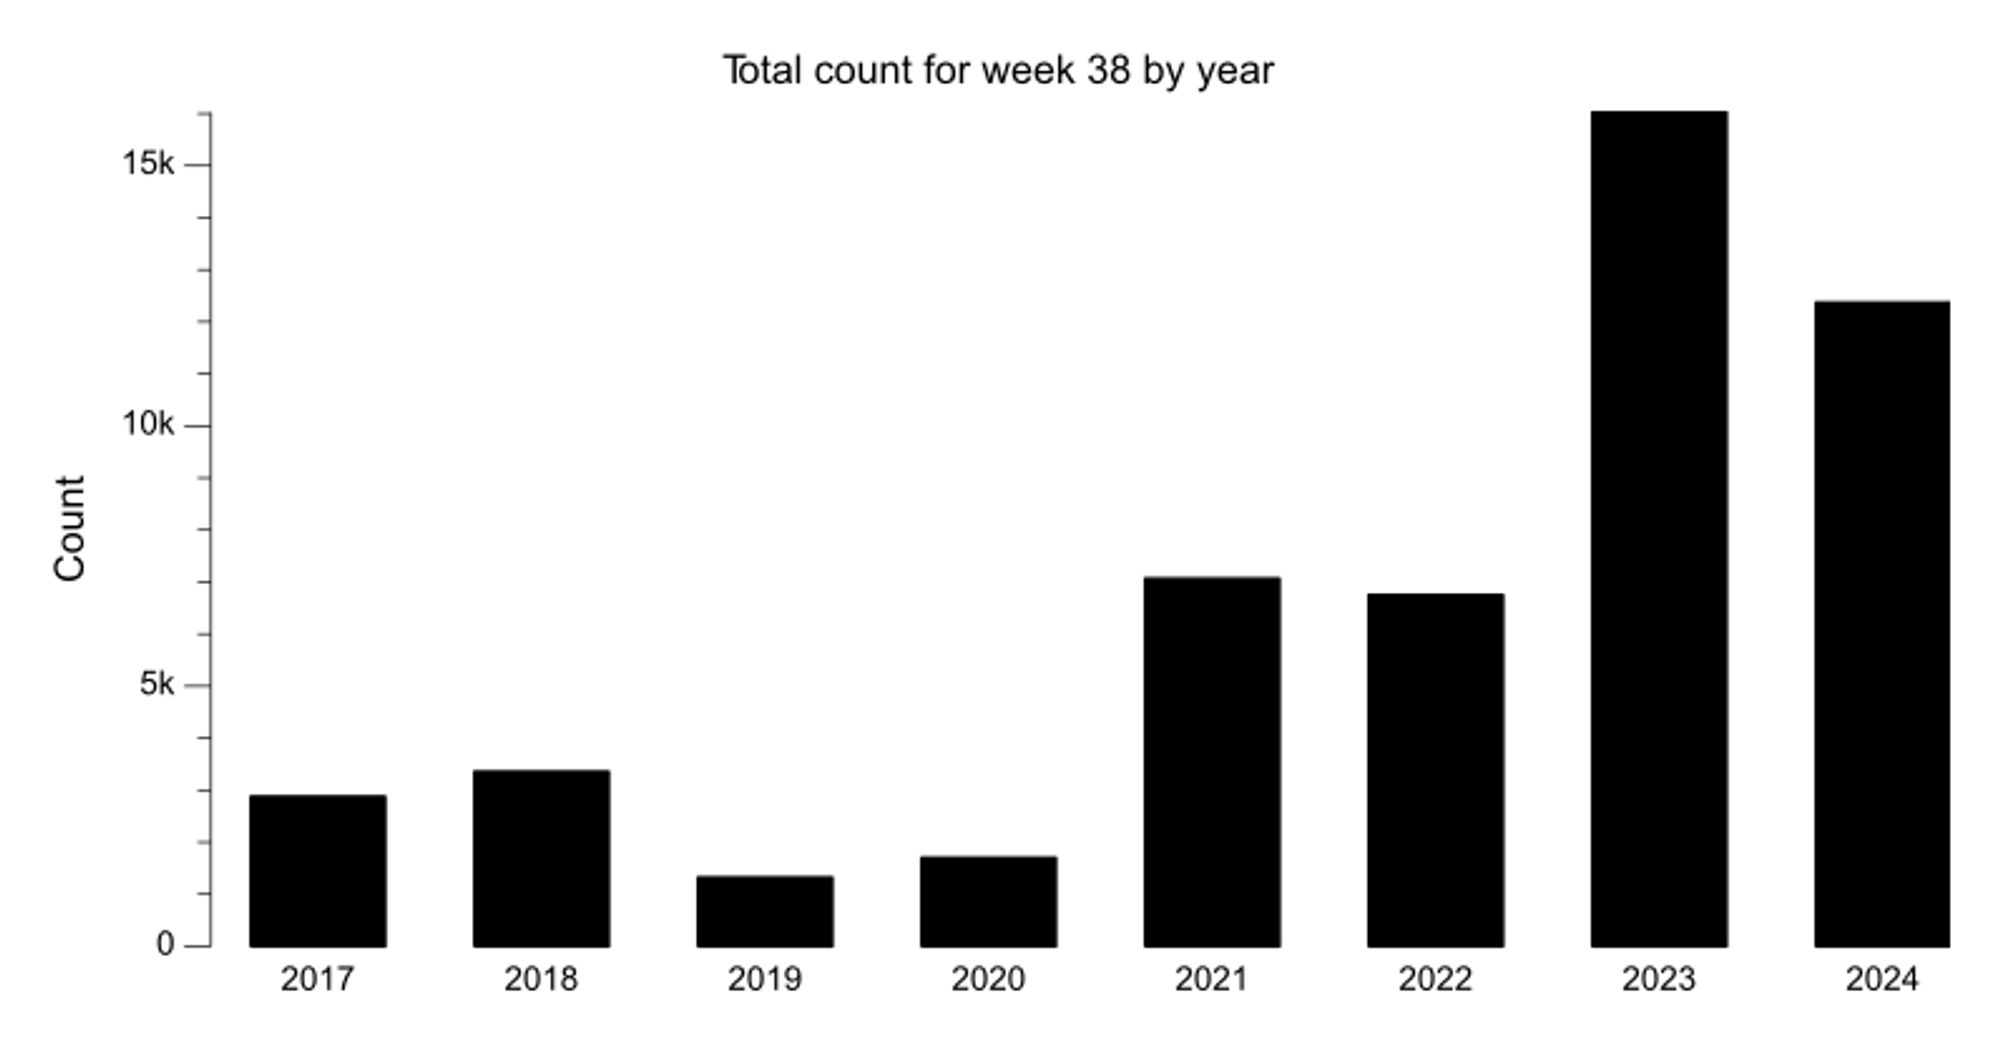
Previous year counts for week 38: 2024: 12,367 2023: 16,022 2022: 6,749 2021: 7,064 2020: 1,698 2019: 1,321 2018: 3,354 2017: 2,875

Bar chart of bikes counted for week 38 over last 8 years. The most recent year had 12,367 bikes counted, 22% fewer than the previous year.
Chart with line per year's total count by week for recent years
0
BSstats.hfx.bike

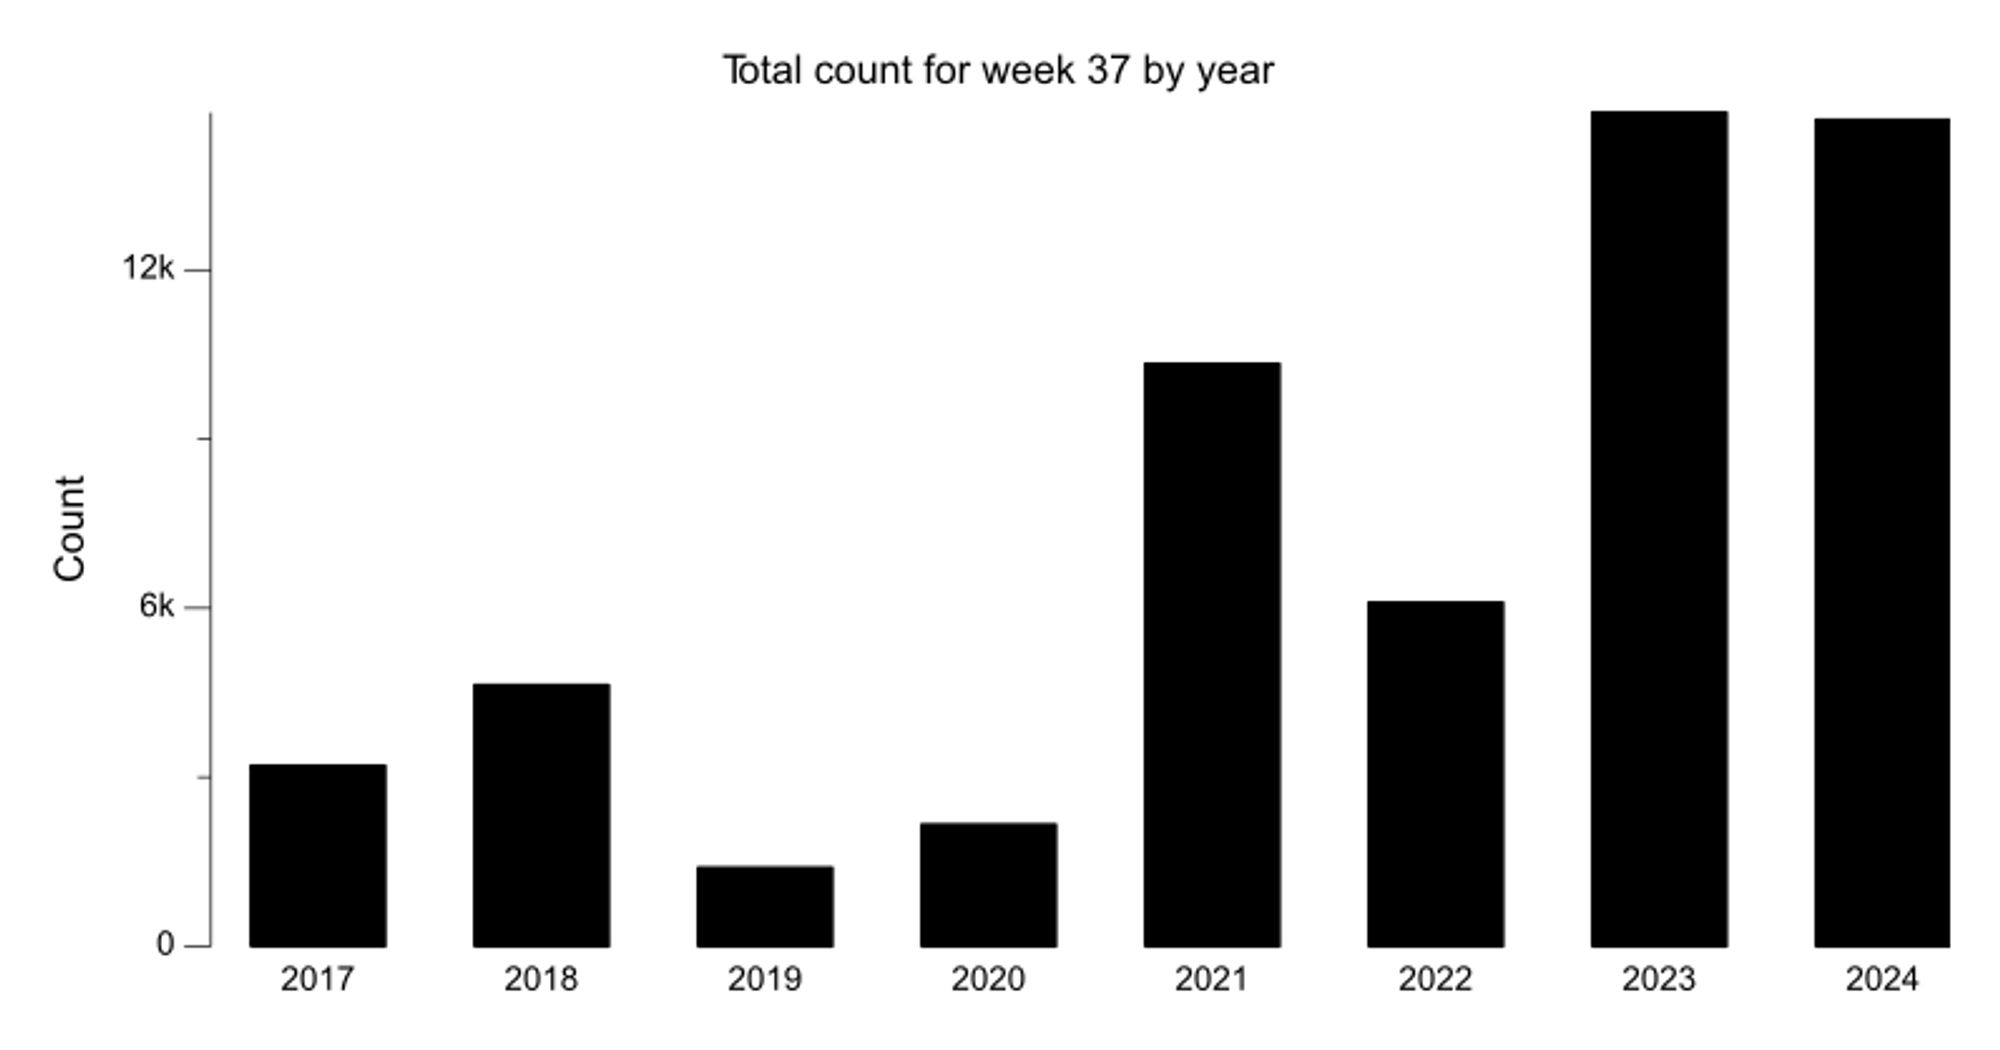
Previous year counts for week 37: 2024: 14,664 2023: 14,795 2022: 6,098 2021: 10,334 2020: 2,159 2019: 1,393 2018: 4,634 2017: 3,203

Bar chart of bikes counted for week 37 over last 8 years. The most recent years's count of 14,664 is about the same as the previous year.
Chart with line per year's total count by week for recent years
0
BSstats.hfx.bike

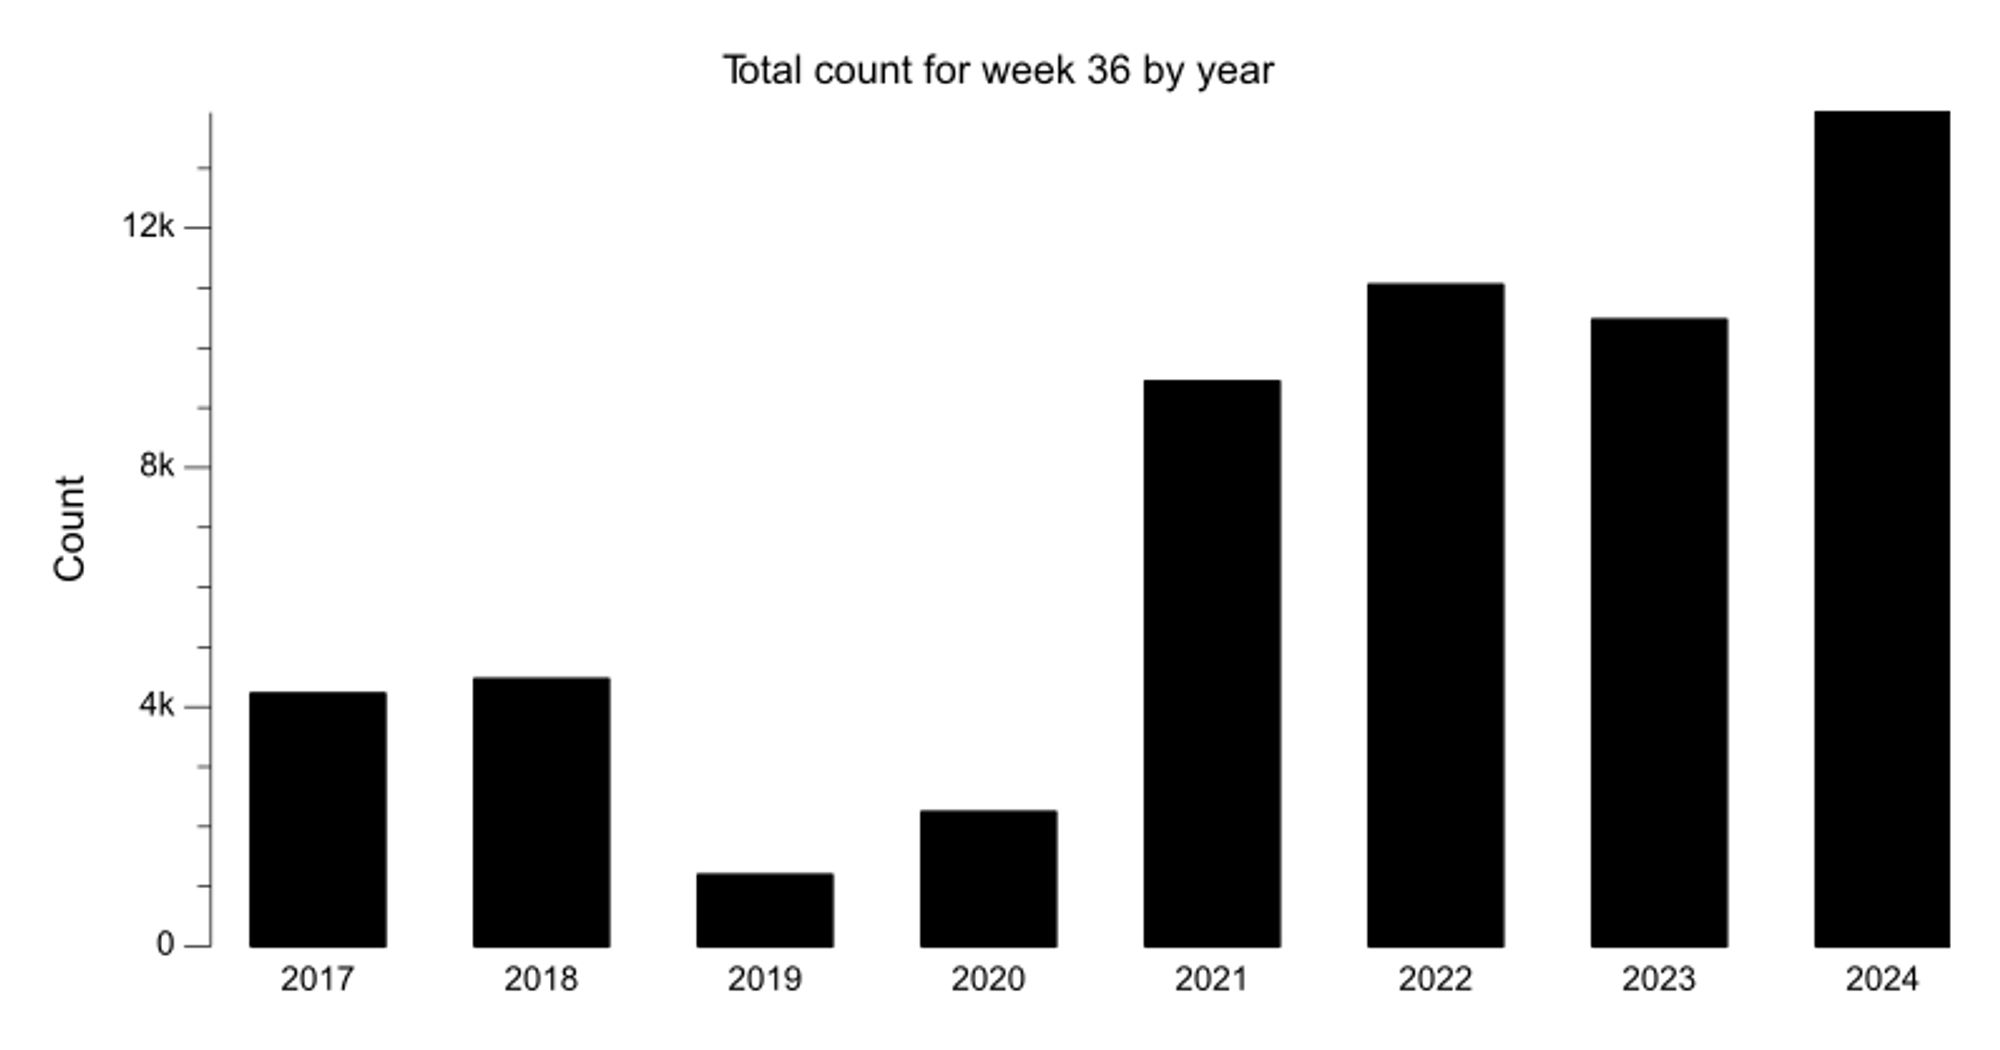
Previous year counts for week 36: 2024: 13,935 2023: 10,472 2022: 11,055 2021: 9,439 2020: 2,244 2019: 1,193 2018: 4,465 2017: 4,223

Bar chart of bikes counted for week 36 over last 8 years. The most recent year had 13,935 bikes counted, 33% more than the previous year.
Chart with line per year's total count by week for recent years
0
BSstats.hfx.bike

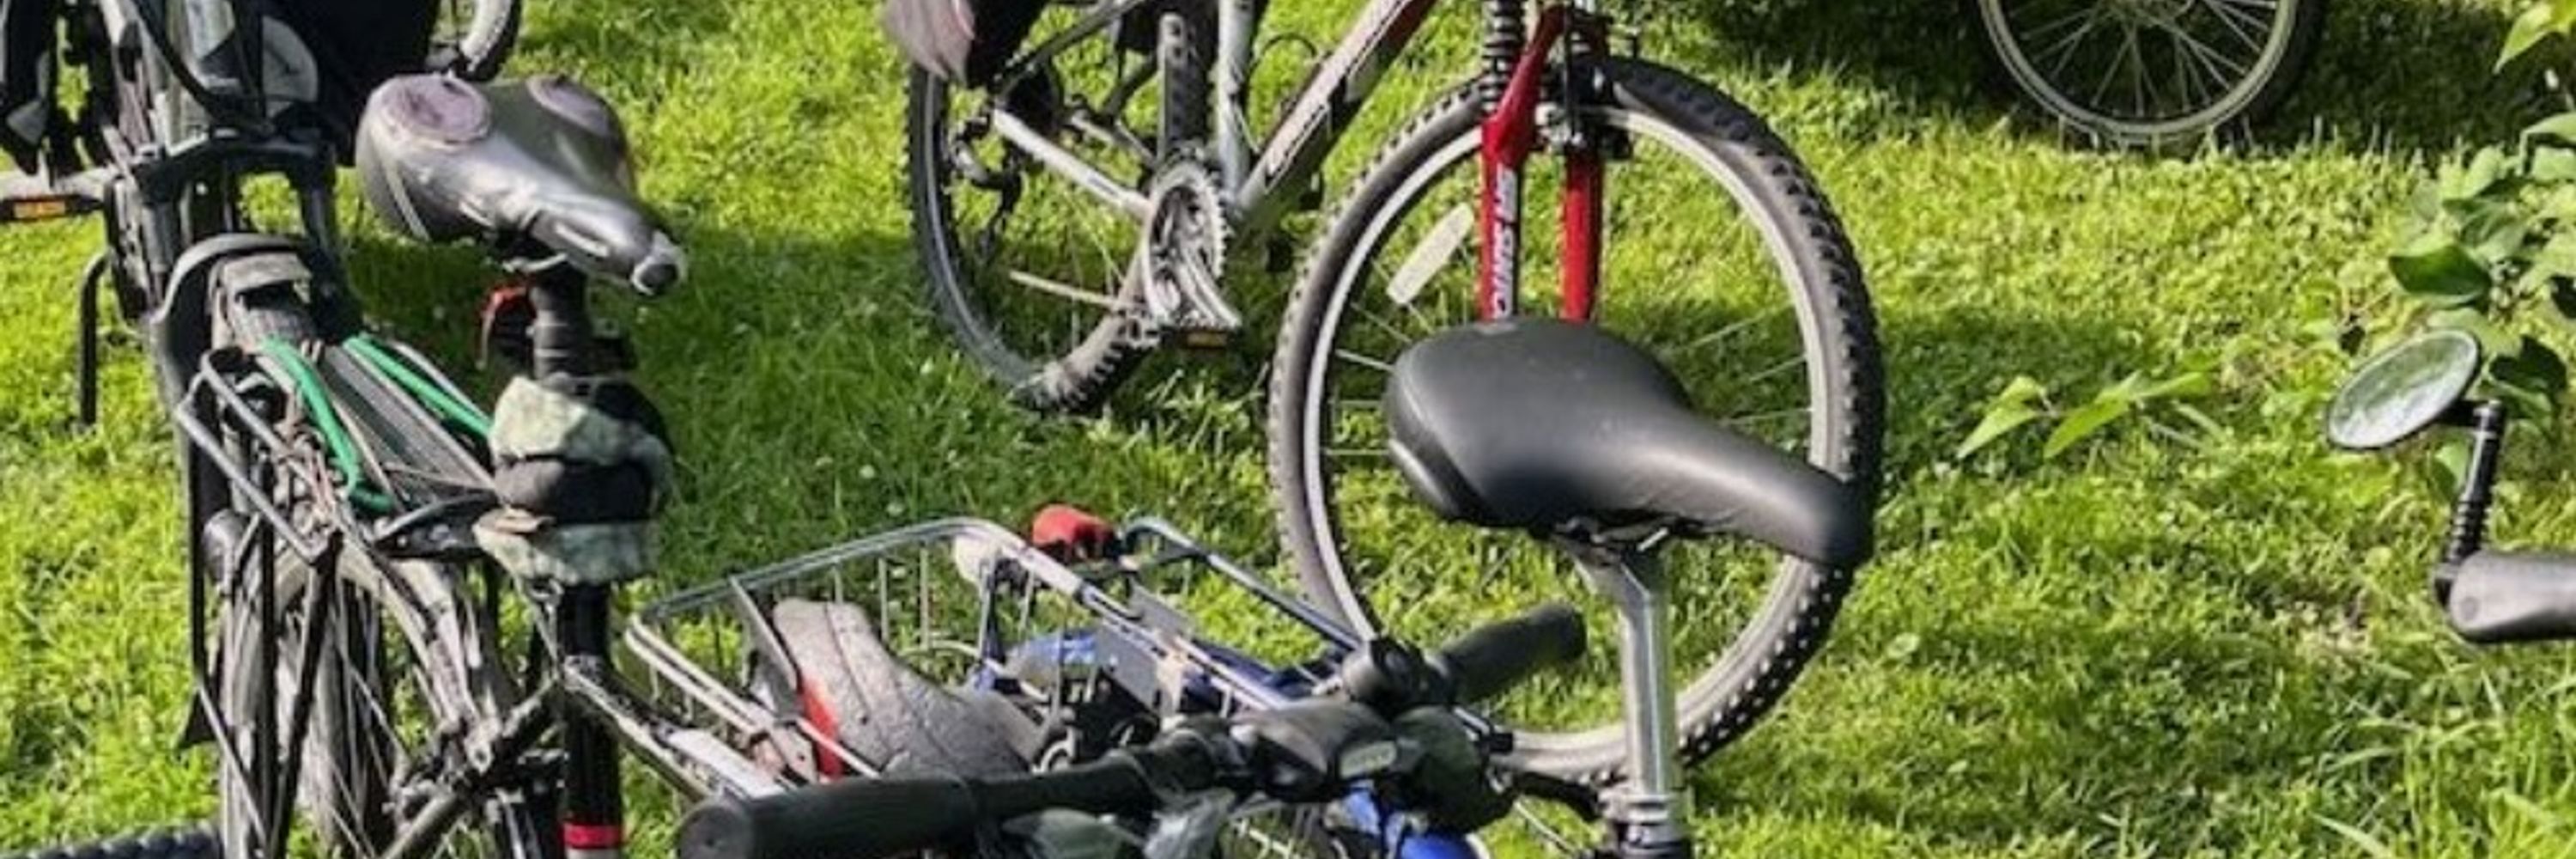
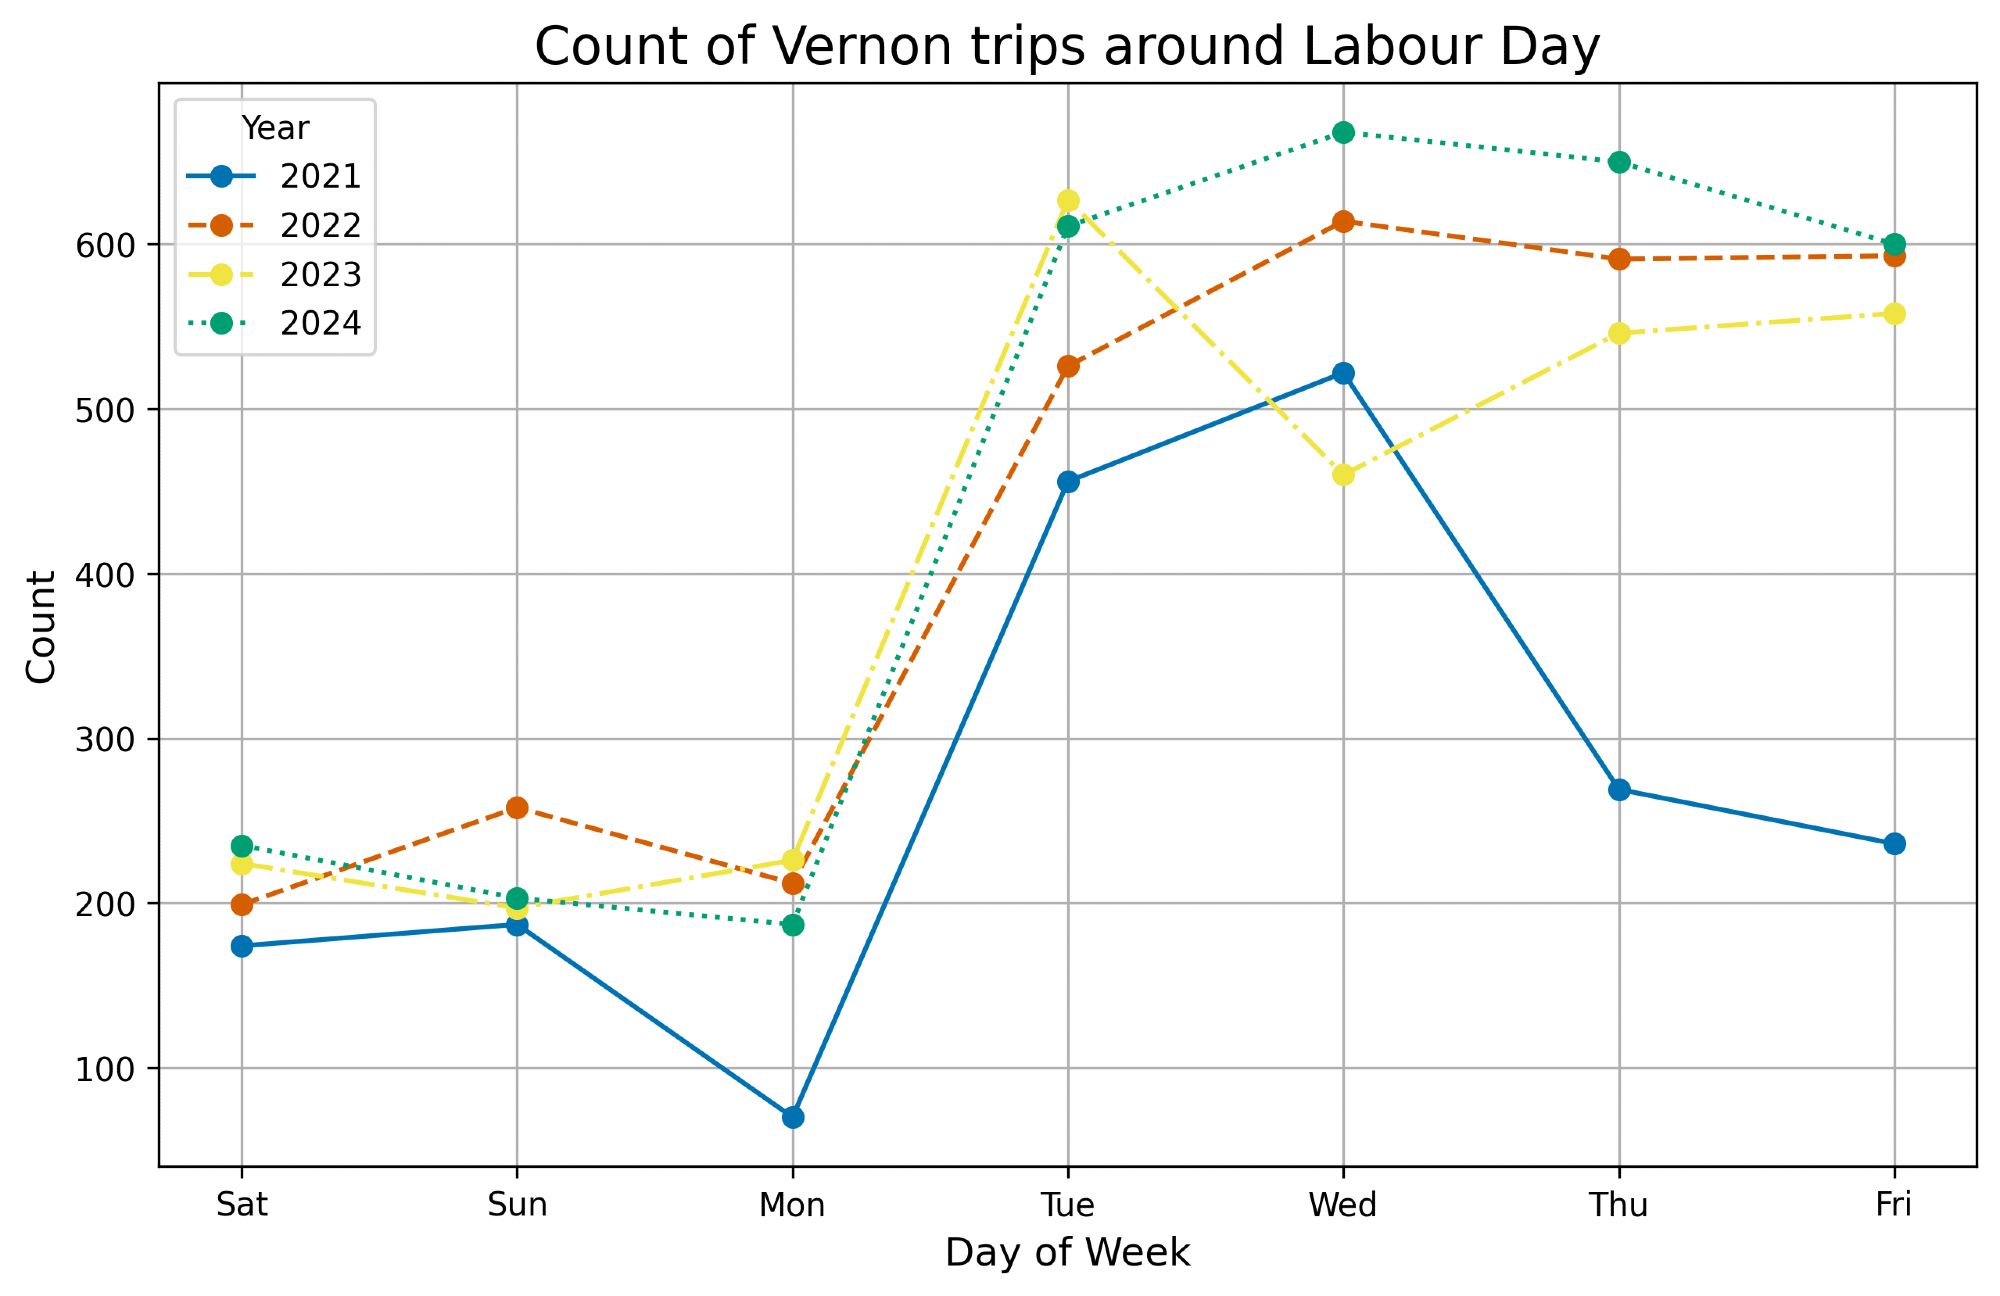
Chain of Lakes Trail, the counter is near the golf course driveway off Joe Howe

1
BSstats.hfx.bike

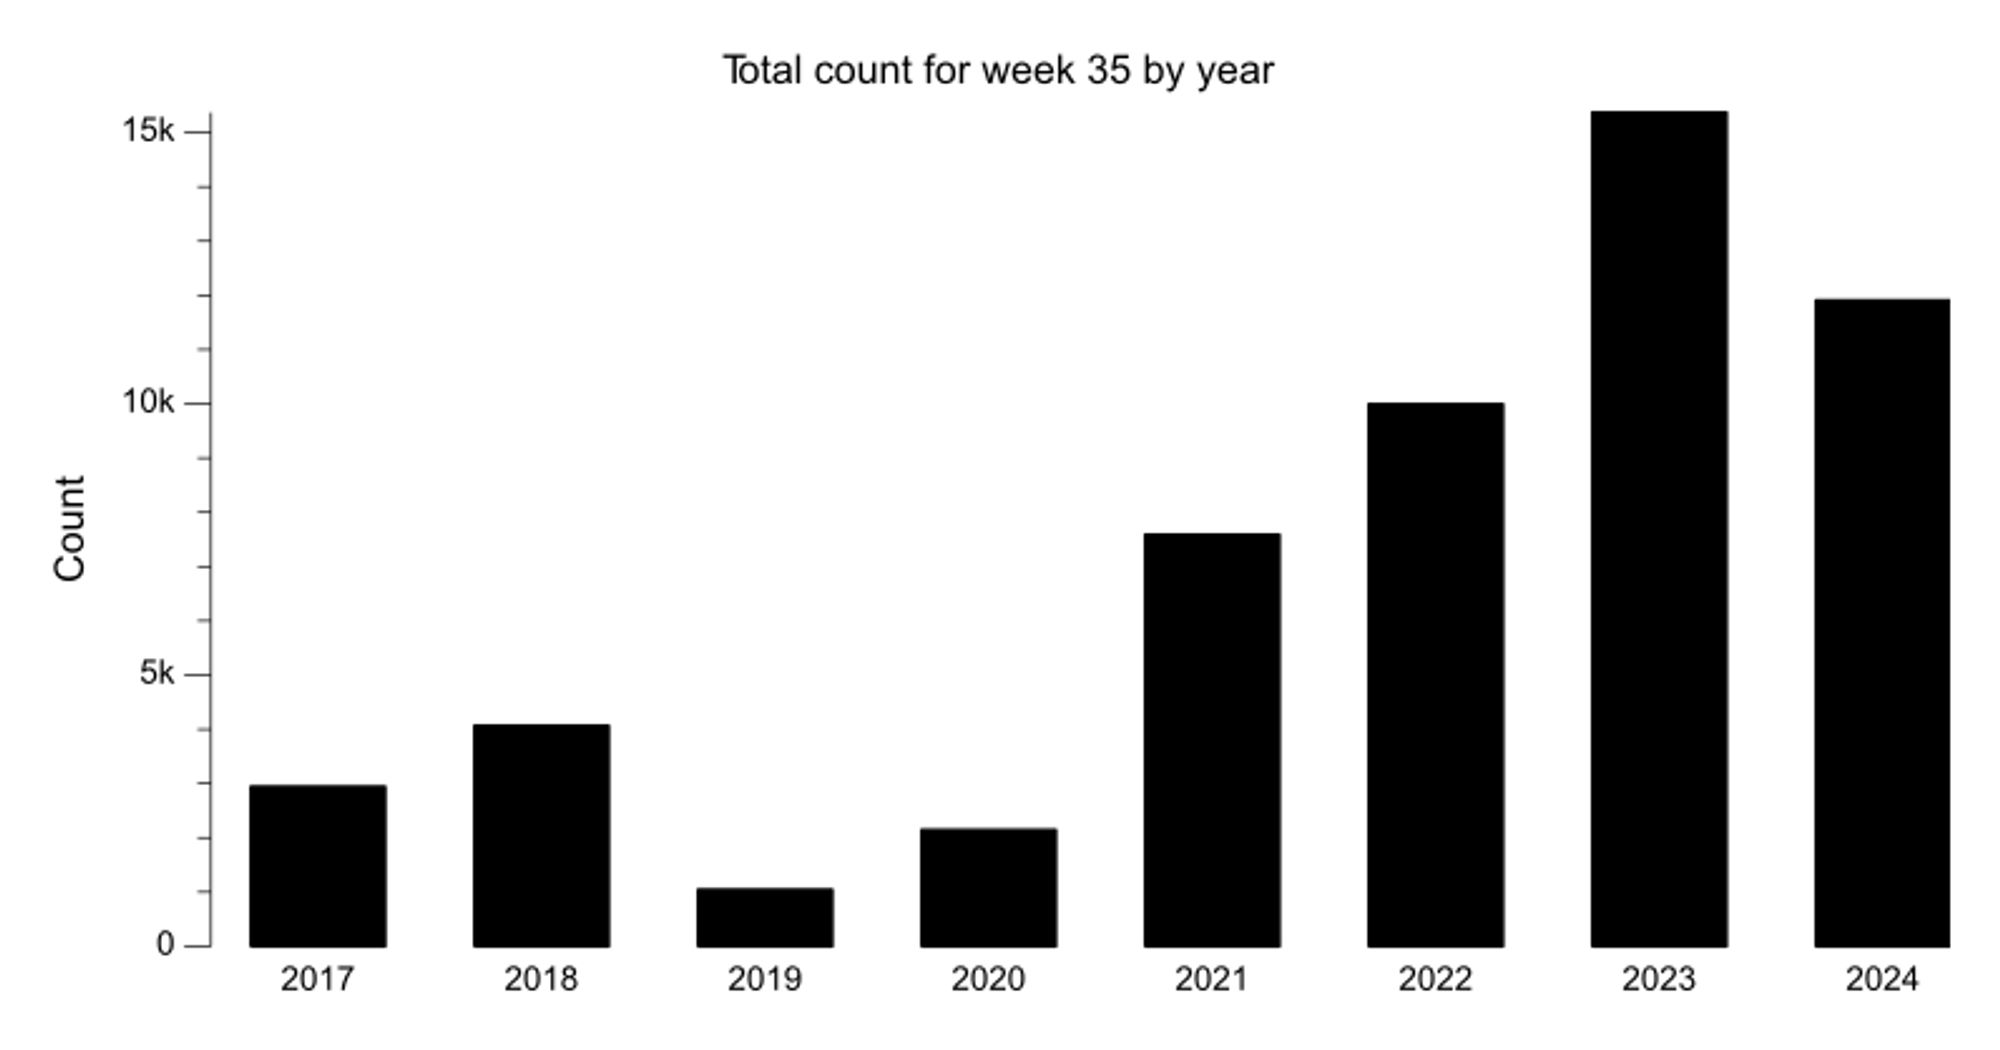
Previous year counts for week 35: 2024: 11,905 2023: 15,370 2022: 9,991 2021: 7,585 2020: 2,144 2019: 1,042 2018: 4,063 2017: 2,941

Bar chart of counted cycling trips for week 35 over last 8 years. The most recent year had 11,905 trips counted, 22% fewer than the previous year.
Chart with line per year's total count by week for recent years
0
BSstats.hfx.bike

Finally, here's an overview of the weather for the relevant years:

A collection of line charts showing the max temperature and a bar chart showing the rainfall for the Saturday to Friday around Labour Day for 2020-2024. The temperatures are generally close to each other. The rain chart shows notable amounts for Monday, Thursday, and Friday from multiple years.
0
BSstats.hfx.bike

And here are the same for Vernon:

A line chart of Vernon counts for the Saturday to Friday around Labour Day for 2021-2024. The 2021 line is visibly lowest with others being much closer to each other.
A bar chart of Vernon counts for the Saturday to Friday around Labour Day for 2021-2024. Each day has a group of bars, one for each year. They show the same general trend as the line chart.
A heatmap of Vernon counts for the Saturday to Friday around Labour Day for 2021-2024. The Tuesday to Friday portion generally have a color that reflects higher counts. The colors also reflect generally higher counts for more recent years.
1
BSstats.hfx.bike

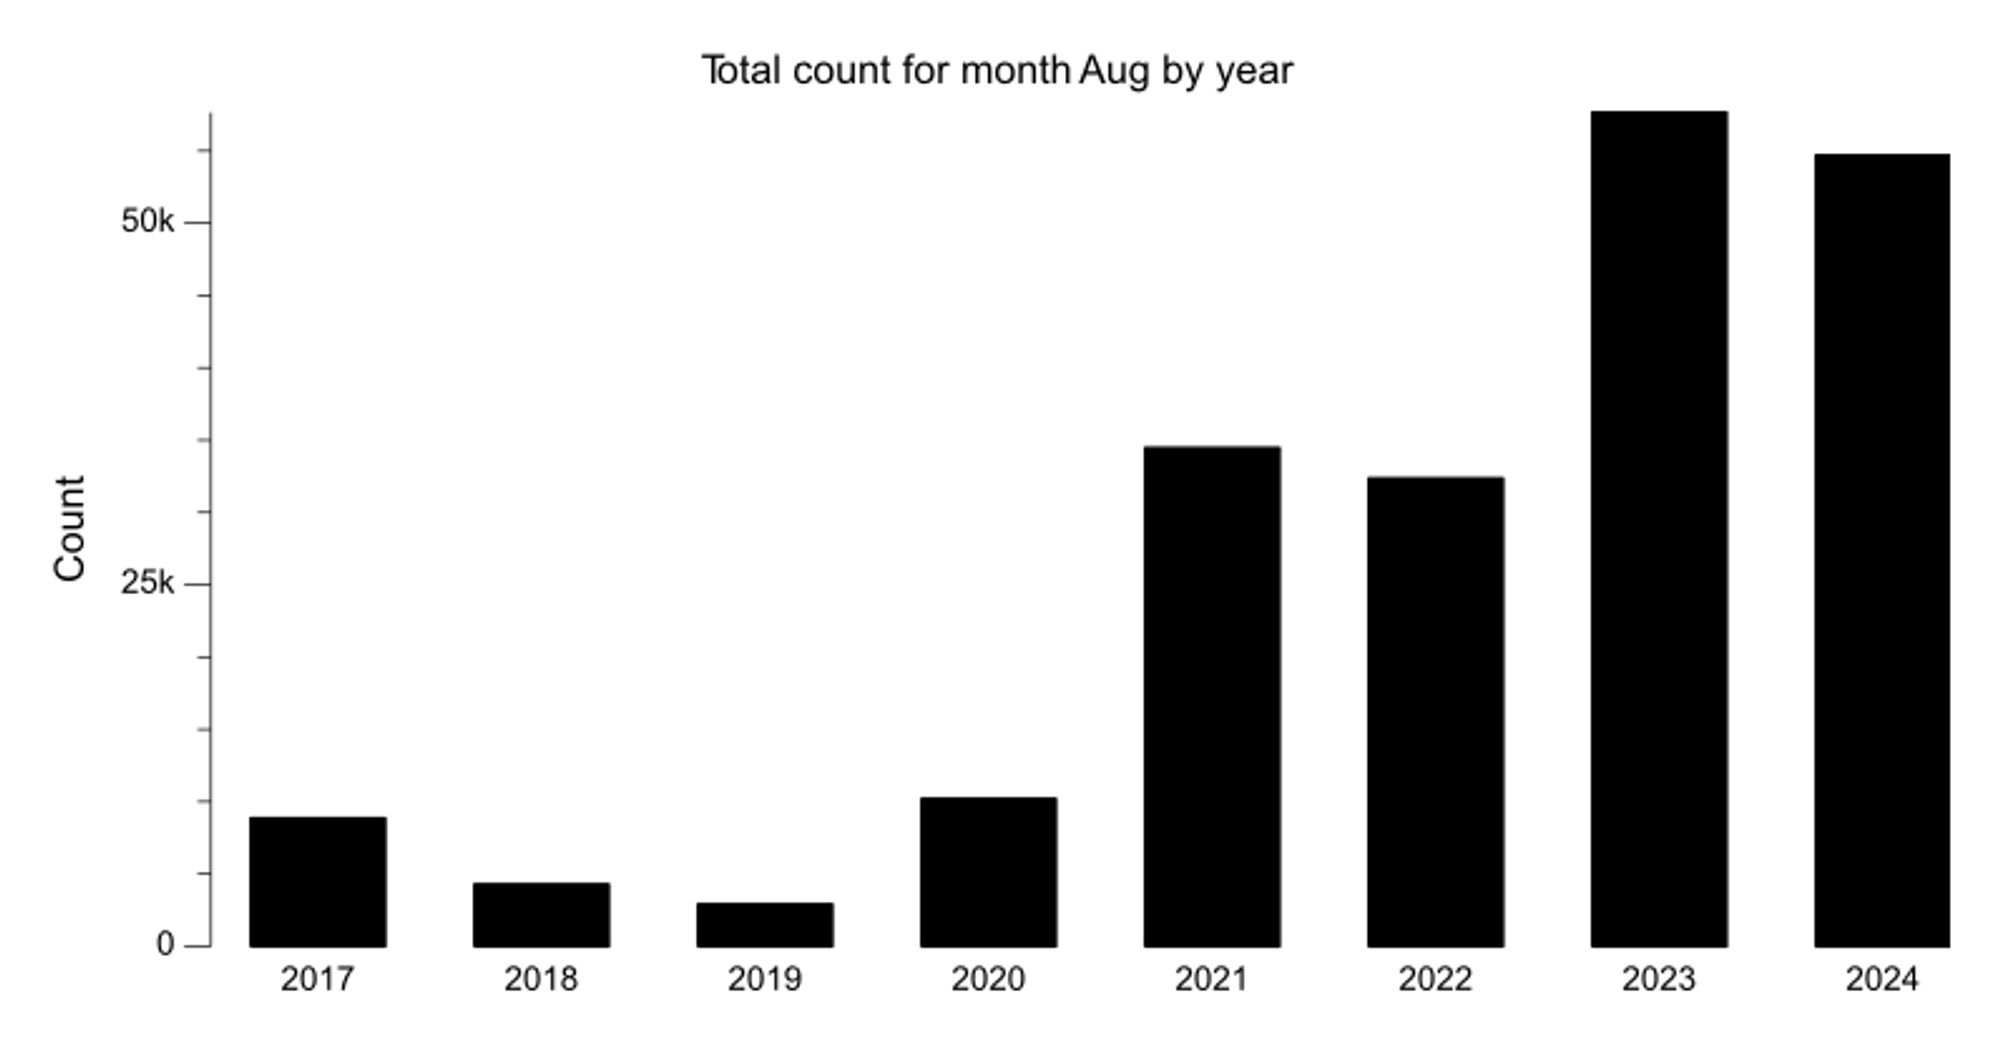
Previous year counts for Aug: 2024: 54,677 2023: 57,653 2022: 32,348 2021: 34,454 2020: 10,188 2019: 2,893 2018: 4,276 2017: 8,846

Bar chart of counted cycling trips for month Aug over last 8 years. The most recent year had 54,677 trips counted, 5% fewer than the previous year.
0
Profile banner
BS
BikeHfx stats
@stats.hfx.bike
Halifax bike stats, curated by robots. hfx.bike/bikehfxstats
65 followers0 following585 posts