
S
str👻d
@str4d.xyz
Cryptography, privacy, zero knowledge, Rust, gaming, hardware hackery, consumer of art. He/him.
str4d.xyz
abyssdomain.expert/@str4d
twitter.com/str4d
age18f63qx4gk8x7p4lfuwwglqcan7snvp406q5vmk26g9fmpe9c799qqzzr3w
9.9k followers337 following2.2k posts
I'm trying to come up with a nice way to visualize the Bluesky / ATProto network as it currently exists. This shows PDSs (blue) and labelers (red) (thanks @mackuba.eu@bsky.app@whtwnd.com@smokesignal.events).
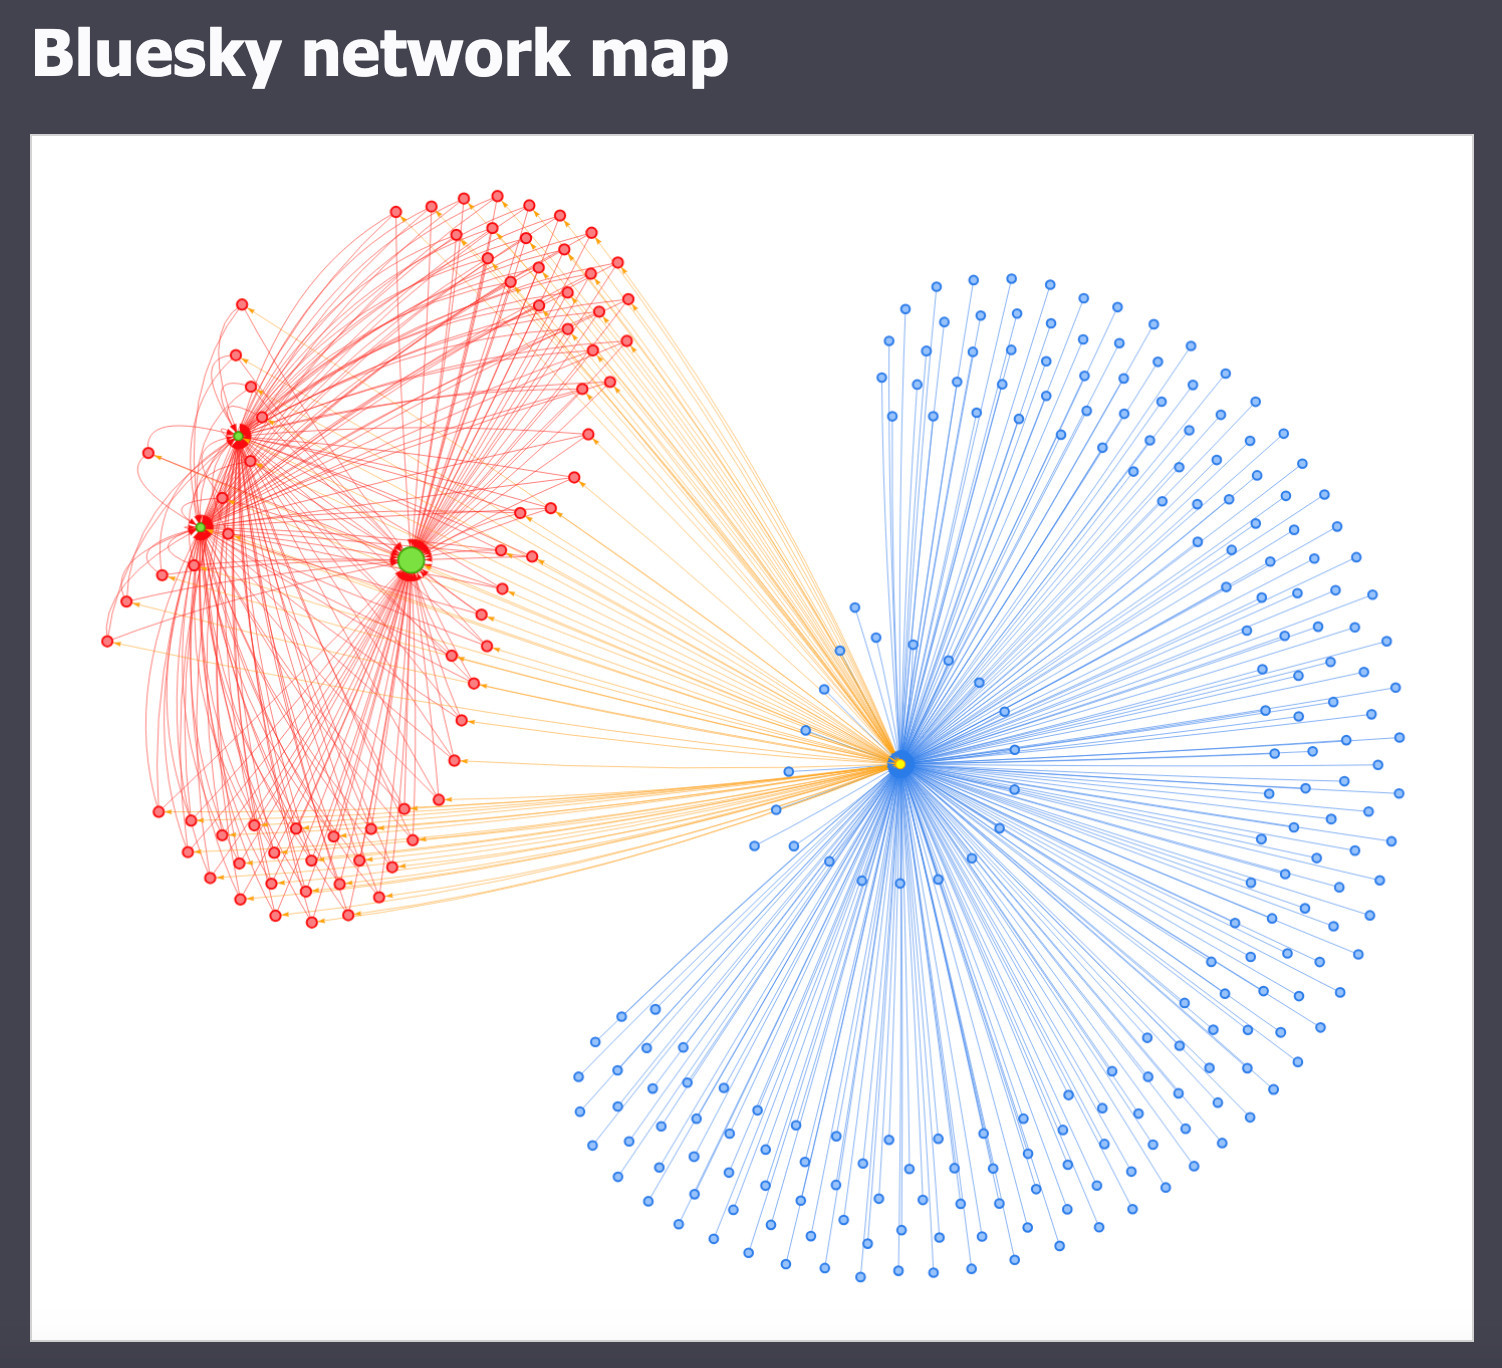
if you can, representing sizes of each node would be interesting. the amount of users for PDS, like count for labelers, maybe the amount of users with at least one corresponding record in their repo for each appview?
This render uses vis-network; I'm still playing around with parameters to get something nicer. If anyone knows of other JavaScript libraries that have good clustering layout mechanisms, please let me know!
this makes me want to buy the relay a drink
S
str👻d
@str4d.xyz
Cryptography, privacy, zero knowledge, Rust, gaming, hardware hackery, consumer of art. He/him.
str4d.xyz
abyssdomain.expert/@str4d
twitter.com/str4d
age18f63qx4gk8x7p4lfuwwglqcan7snvp406q5vmk26g9fmpe9c799qqzzr3w
9.9k followers337 following2.2k posts