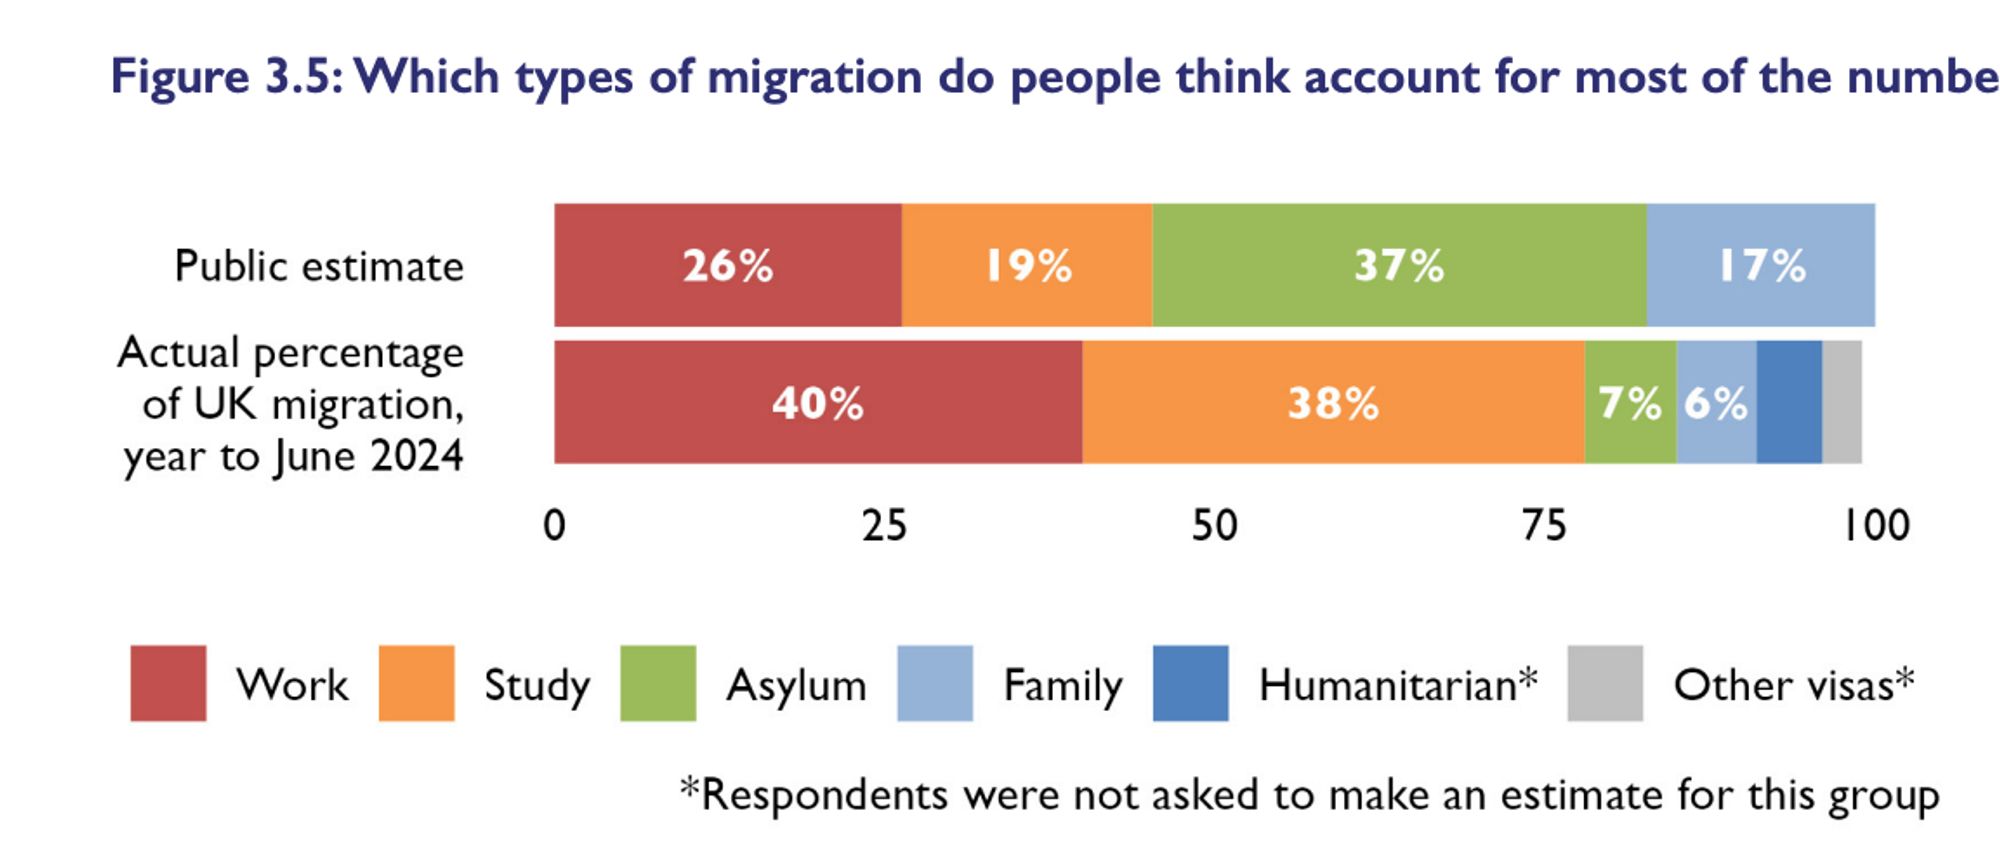
We asked respondents to estimate the proportion of UK immigration in each of these categories [By giving them 100 points to split between 4 categories] Asylum: estimate 37% (actual: 7%) Family: estimate 17% (actual 6%) Work: estimate 26% (actual 40%) Study: estimate 19% (actual 38%)
Quarter of the public with most liberal views estimate 19% of UK immig is asylum (actual 7%) Quarter with most migration sceptic views estimate 47% of immigration is asylum (vs actual 7%) Four in ten Reform voters (39%) + 31% of Cons think that more than half of UK immigration is to claim asylum
It would be fascinating to capture how people respond to hearing the real figures. I have a horrible feeling the people in my life who need to see this would simply say “I don’t believe that” and carry on being awful.
It is so difficult to have a calm and measured policy debate when so much effort has been made to inflame and misinform.
📌 bookmarking this
I’ve never understood why students are included in the immigration figures. Do other countries do this?
As drawn shouldn't they both hit 100%? However, if you only gave 4 categories to those questioned then that graphic should reflect this by having the right side of the top's 17% line up with the right side of the bottom's 6%. Otherwise you're making the public response look worse than it is.