
TM
tj mahr
@tjmahr.com
data scientist studying how kids learn to speak, dad, jump roper, bayesian, tjmahr.com
1k followers372 following1.8k posts
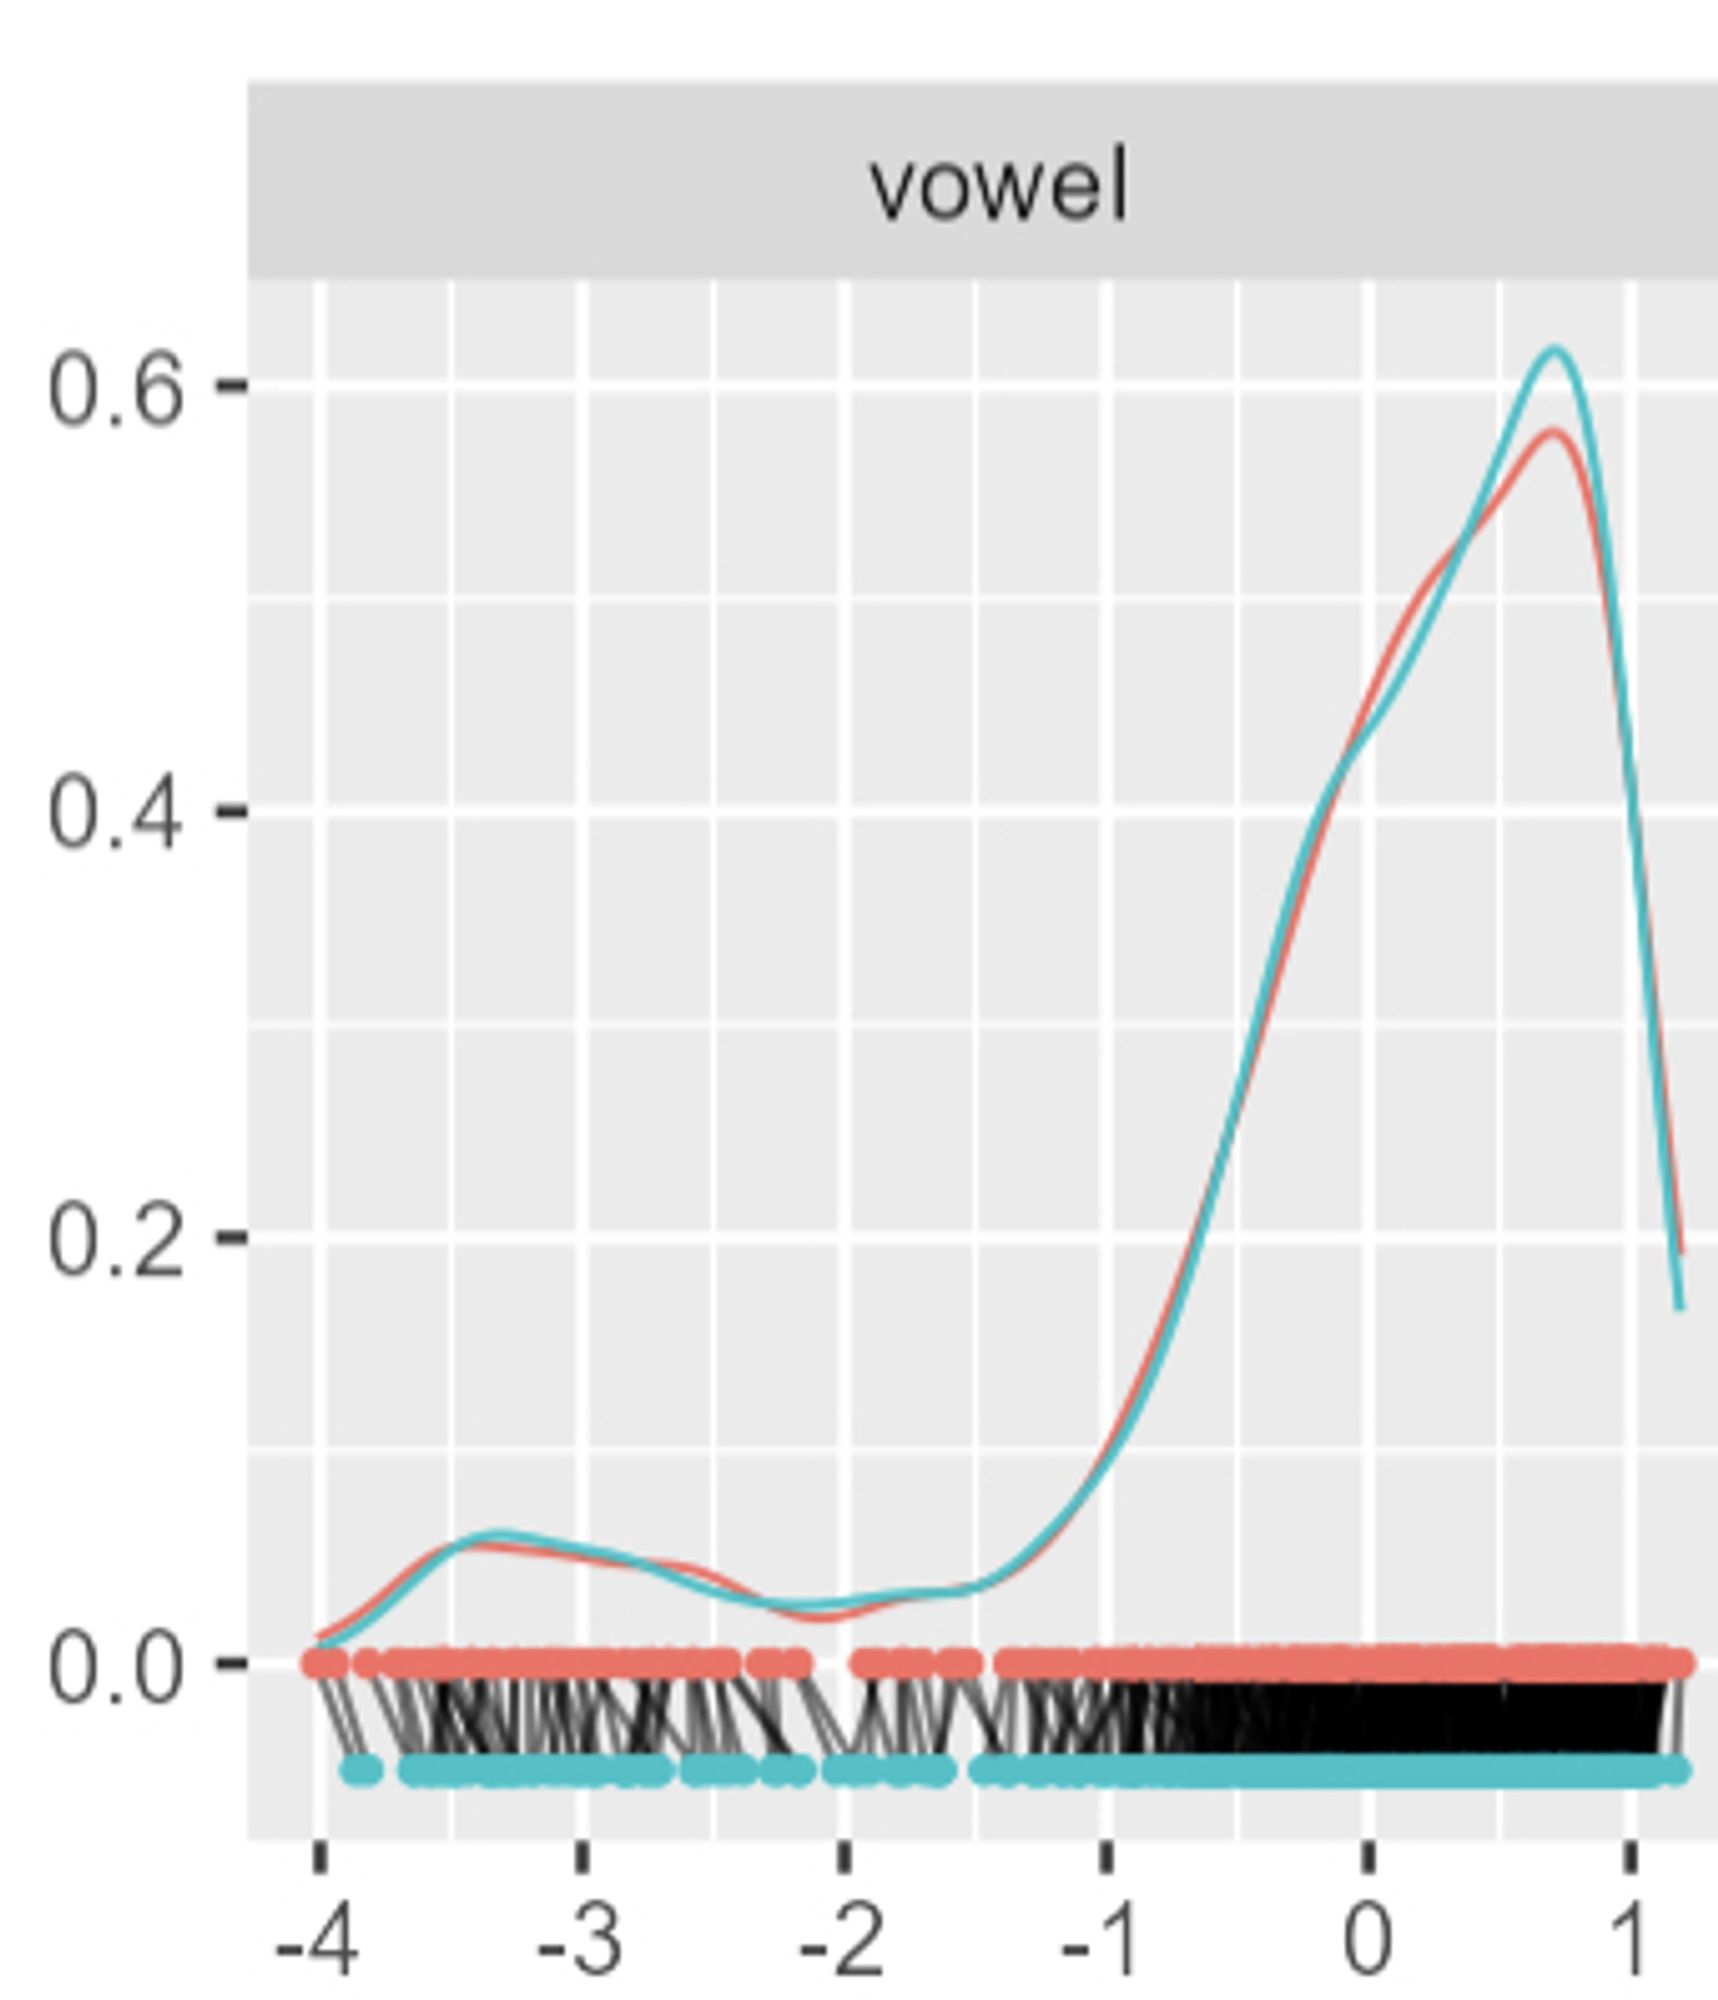
I have the feeling correlation might give you a better idea than this graph. It looks quite similar, but you do not know how often the order of values changes.
TM
tj mahr
@tjmahr.com
data scientist studying how kids learn to speak, dad, jump roper, bayesian, tjmahr.com
1k followers372 following1.8k posts