RW
Richard Waite
@waiterich.bsky.social
Director, Agriculture Initiatives, World Resources Institute. Interested in sustainably feeding 10 billion people by 2050. Likes food, agriculture, land use, nature, numbers & climate solutions. DC-based.
www.wri.org/profile/richard-waite
5.3k followers930 following5.5k posts
Hi, dataviz expert here! You might think this type of graphic is cute, but statistics only act this way when they are EXTREMELY MANIPULATED. If you make these time periods the same, the discrepancy between the numbers would basically go away. Do better
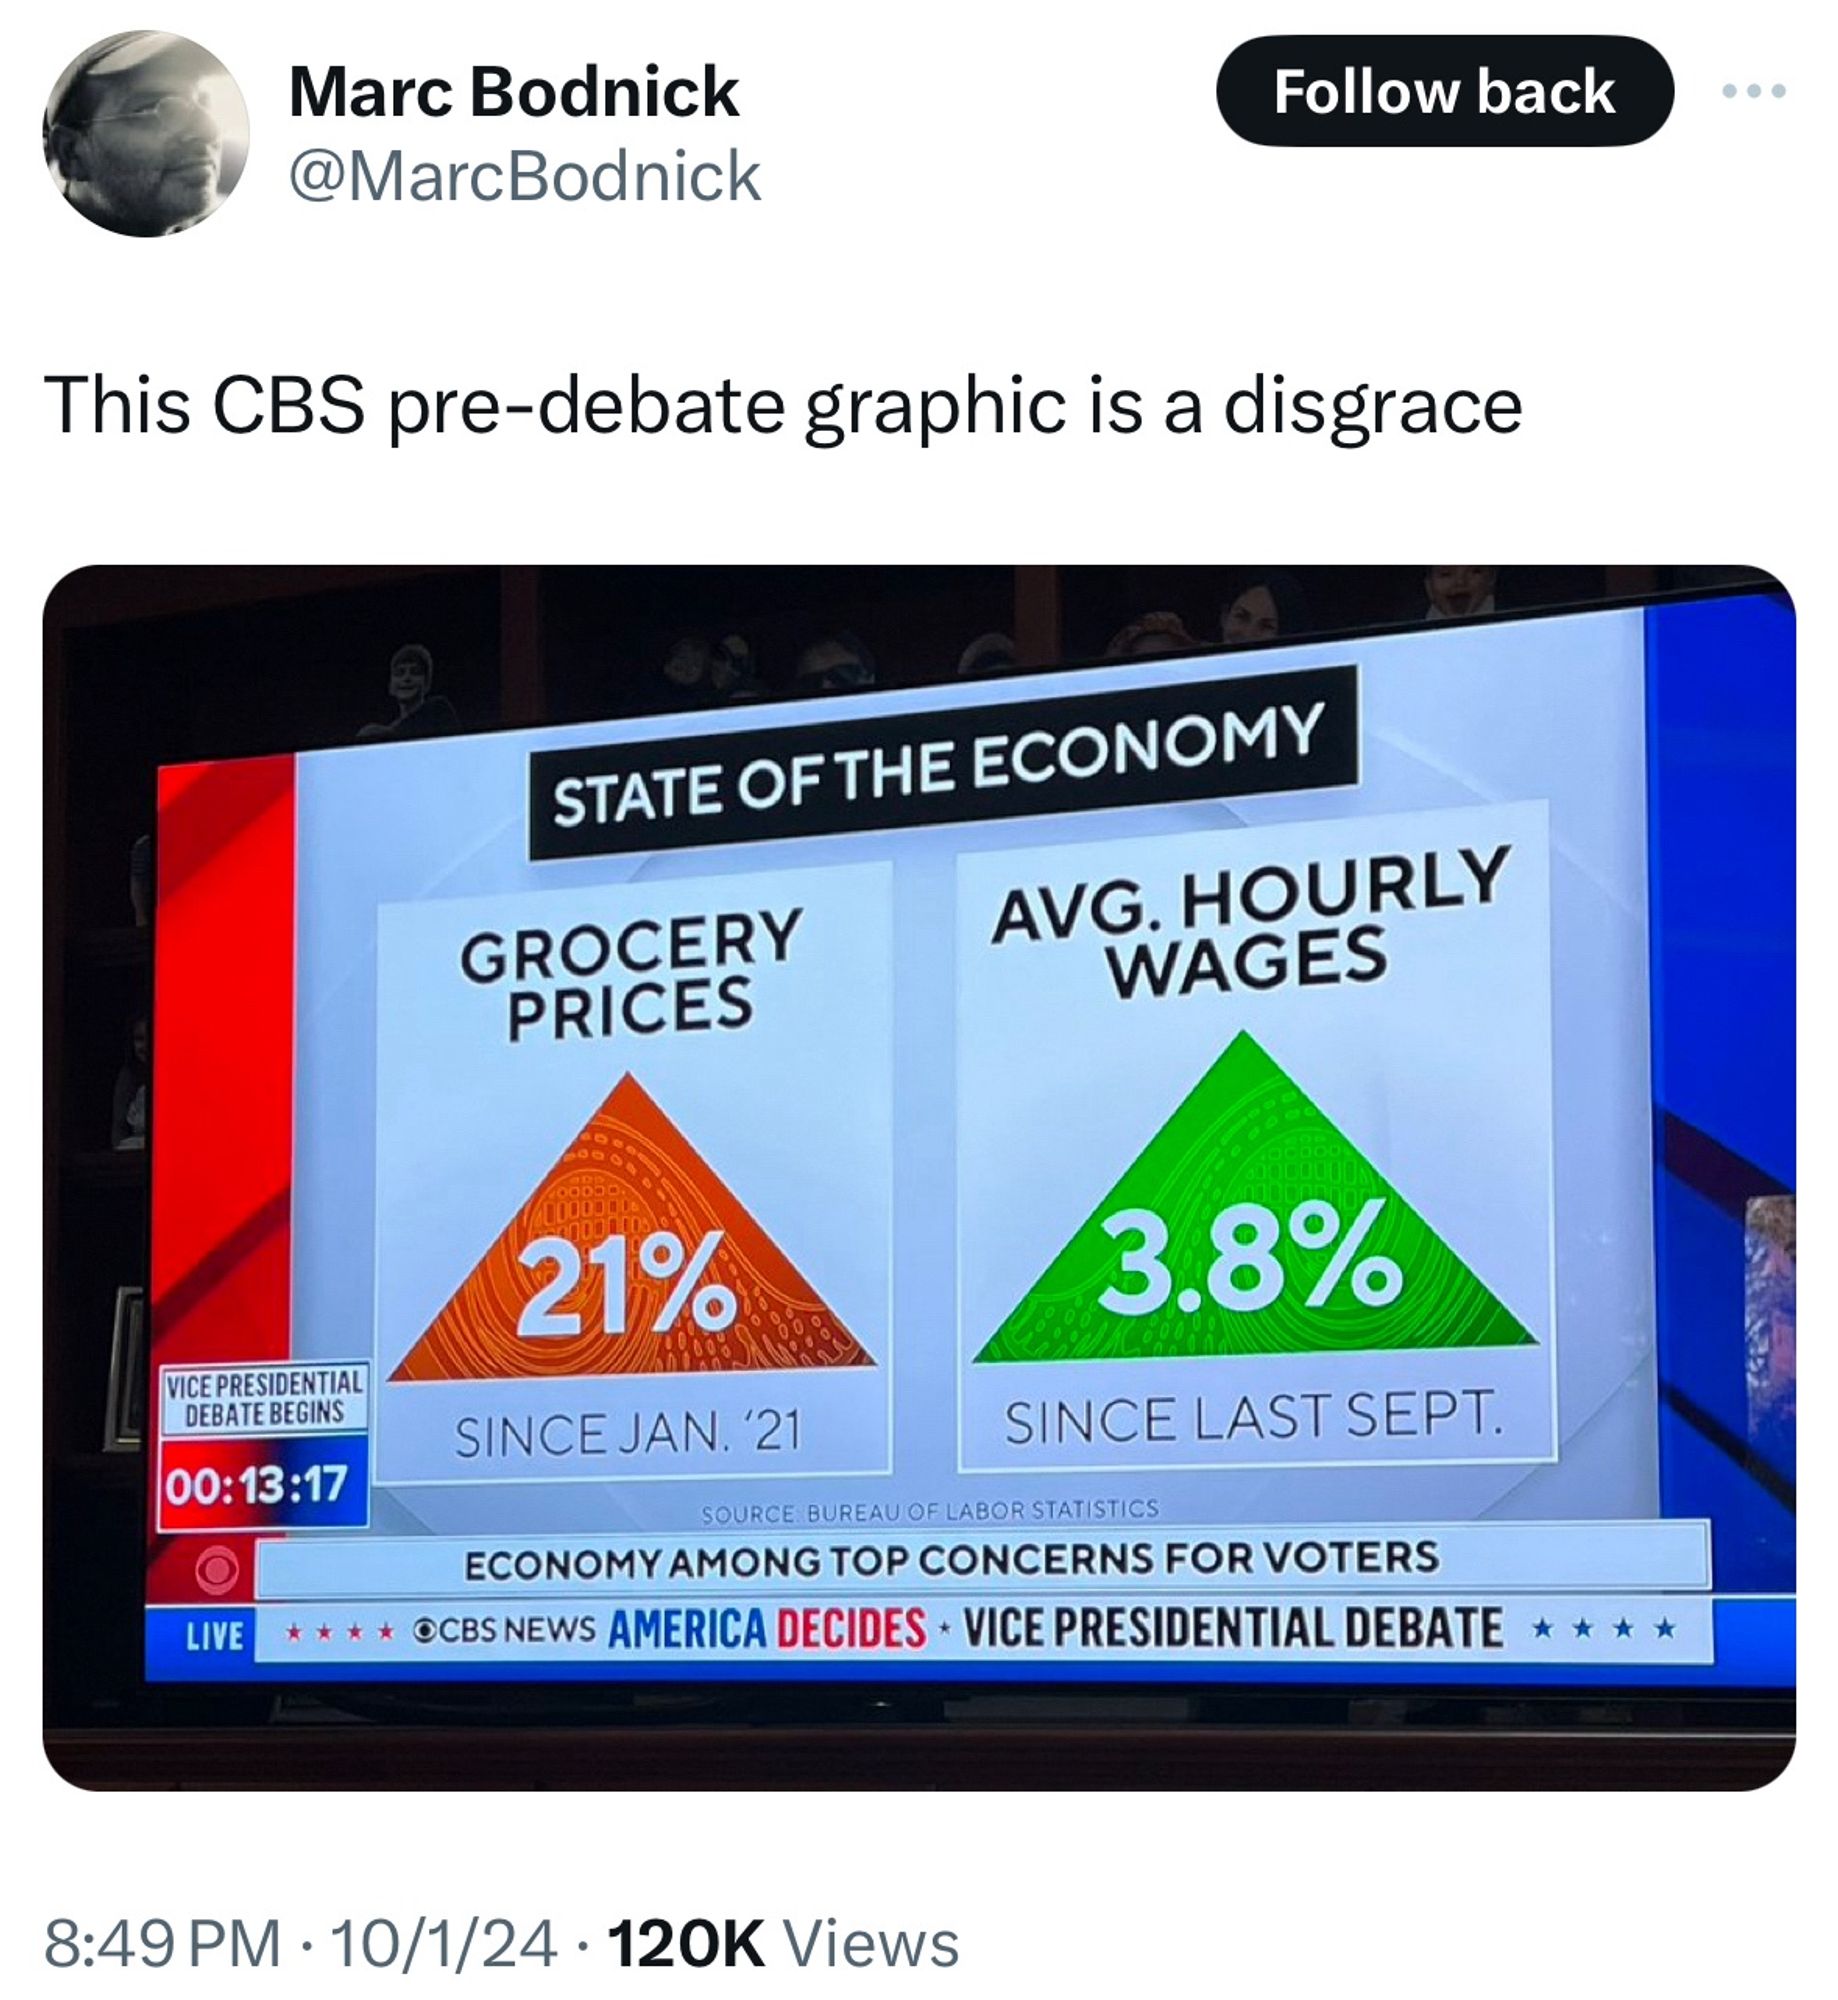
Wow, I never even noticed the timelines
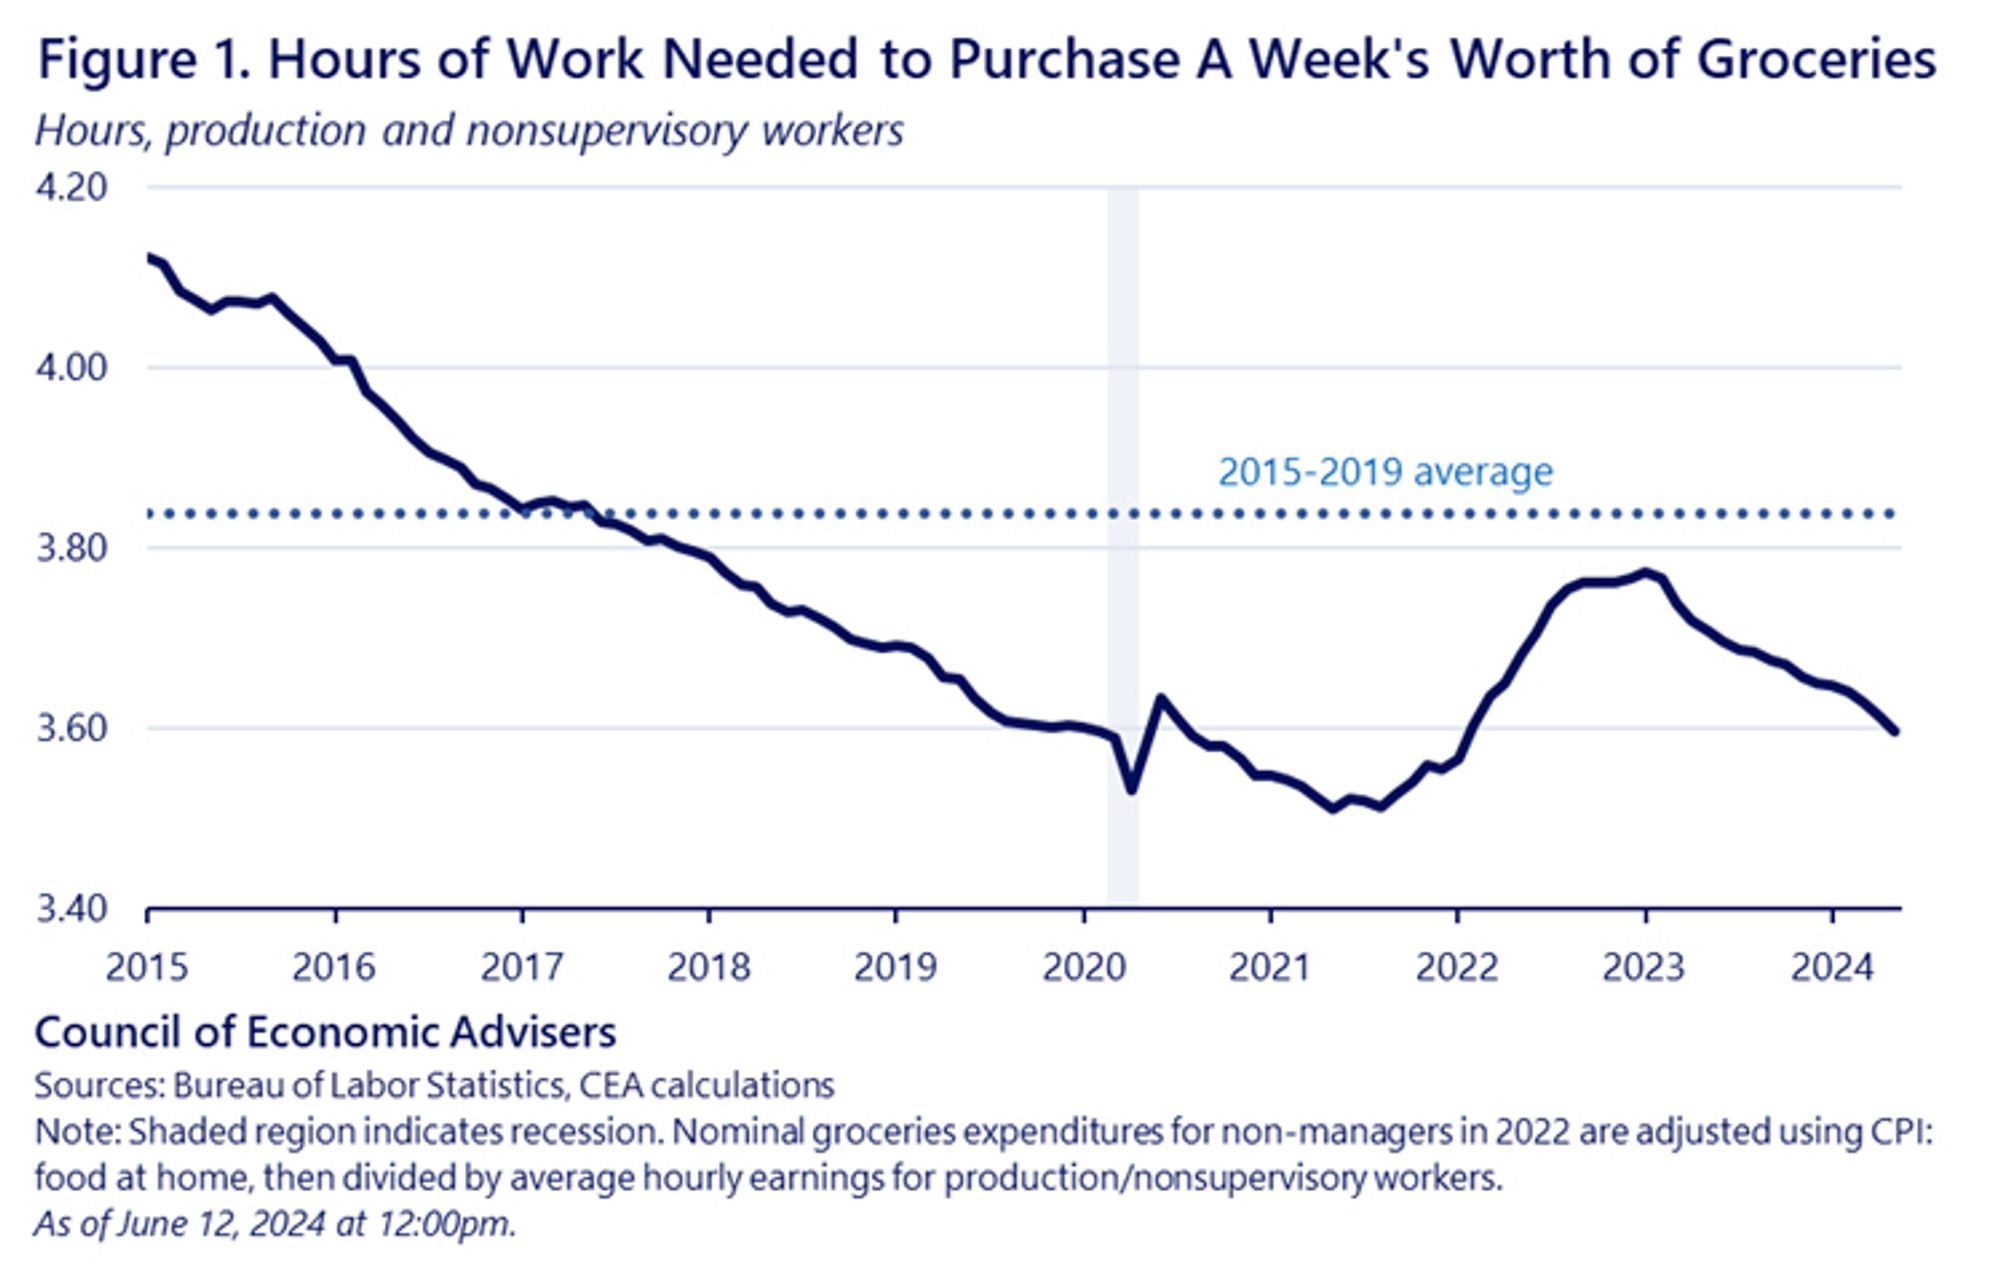
Hours needed by the average US worker to purchase a week’s worth of groceries in 2024 is now similar to what it was in 2019 pre-COVID and pre-inflation. www.whitehouse.gov/cea/written-...
so...why are restaurant prices still up 20%?
RW
Richard Waite
@waiterich.bsky.social
Director, Agriculture Initiatives, World Resources Institute. Interested in sustainably feeding 10 billion people by 2050. Likes food, agriculture, land use, nature, numbers & climate solutions. DC-based.
www.wri.org/profile/richard-waite
5.3k followers930 following5.5k posts