
Thrilled to share that I'm stepping into the Programs Director role for @datavizsociety.bsky.social for the remainder of the term (2024-2025)! Joining as the Early Career Director has already had a profound impact on my data-viz journey and can't wait to see where this next chapter leads!
Also to clarify my cold-med-induced poor wording: watching Neil's visualizations grow and change as he does is the most exciting bit. I didn't mean to imply his earlier work wasn't good. It's the arc he shares, seeing a journey unfold across the pages, that's captivating to watch.
You're very welcome. :)

Feeling very honored that my visualization for @andreatweather.bsky.social@sonjakuijpers.bsky.social, NYT, WaPo, and Bloomberg. 🥰 Be sure to check them all out!
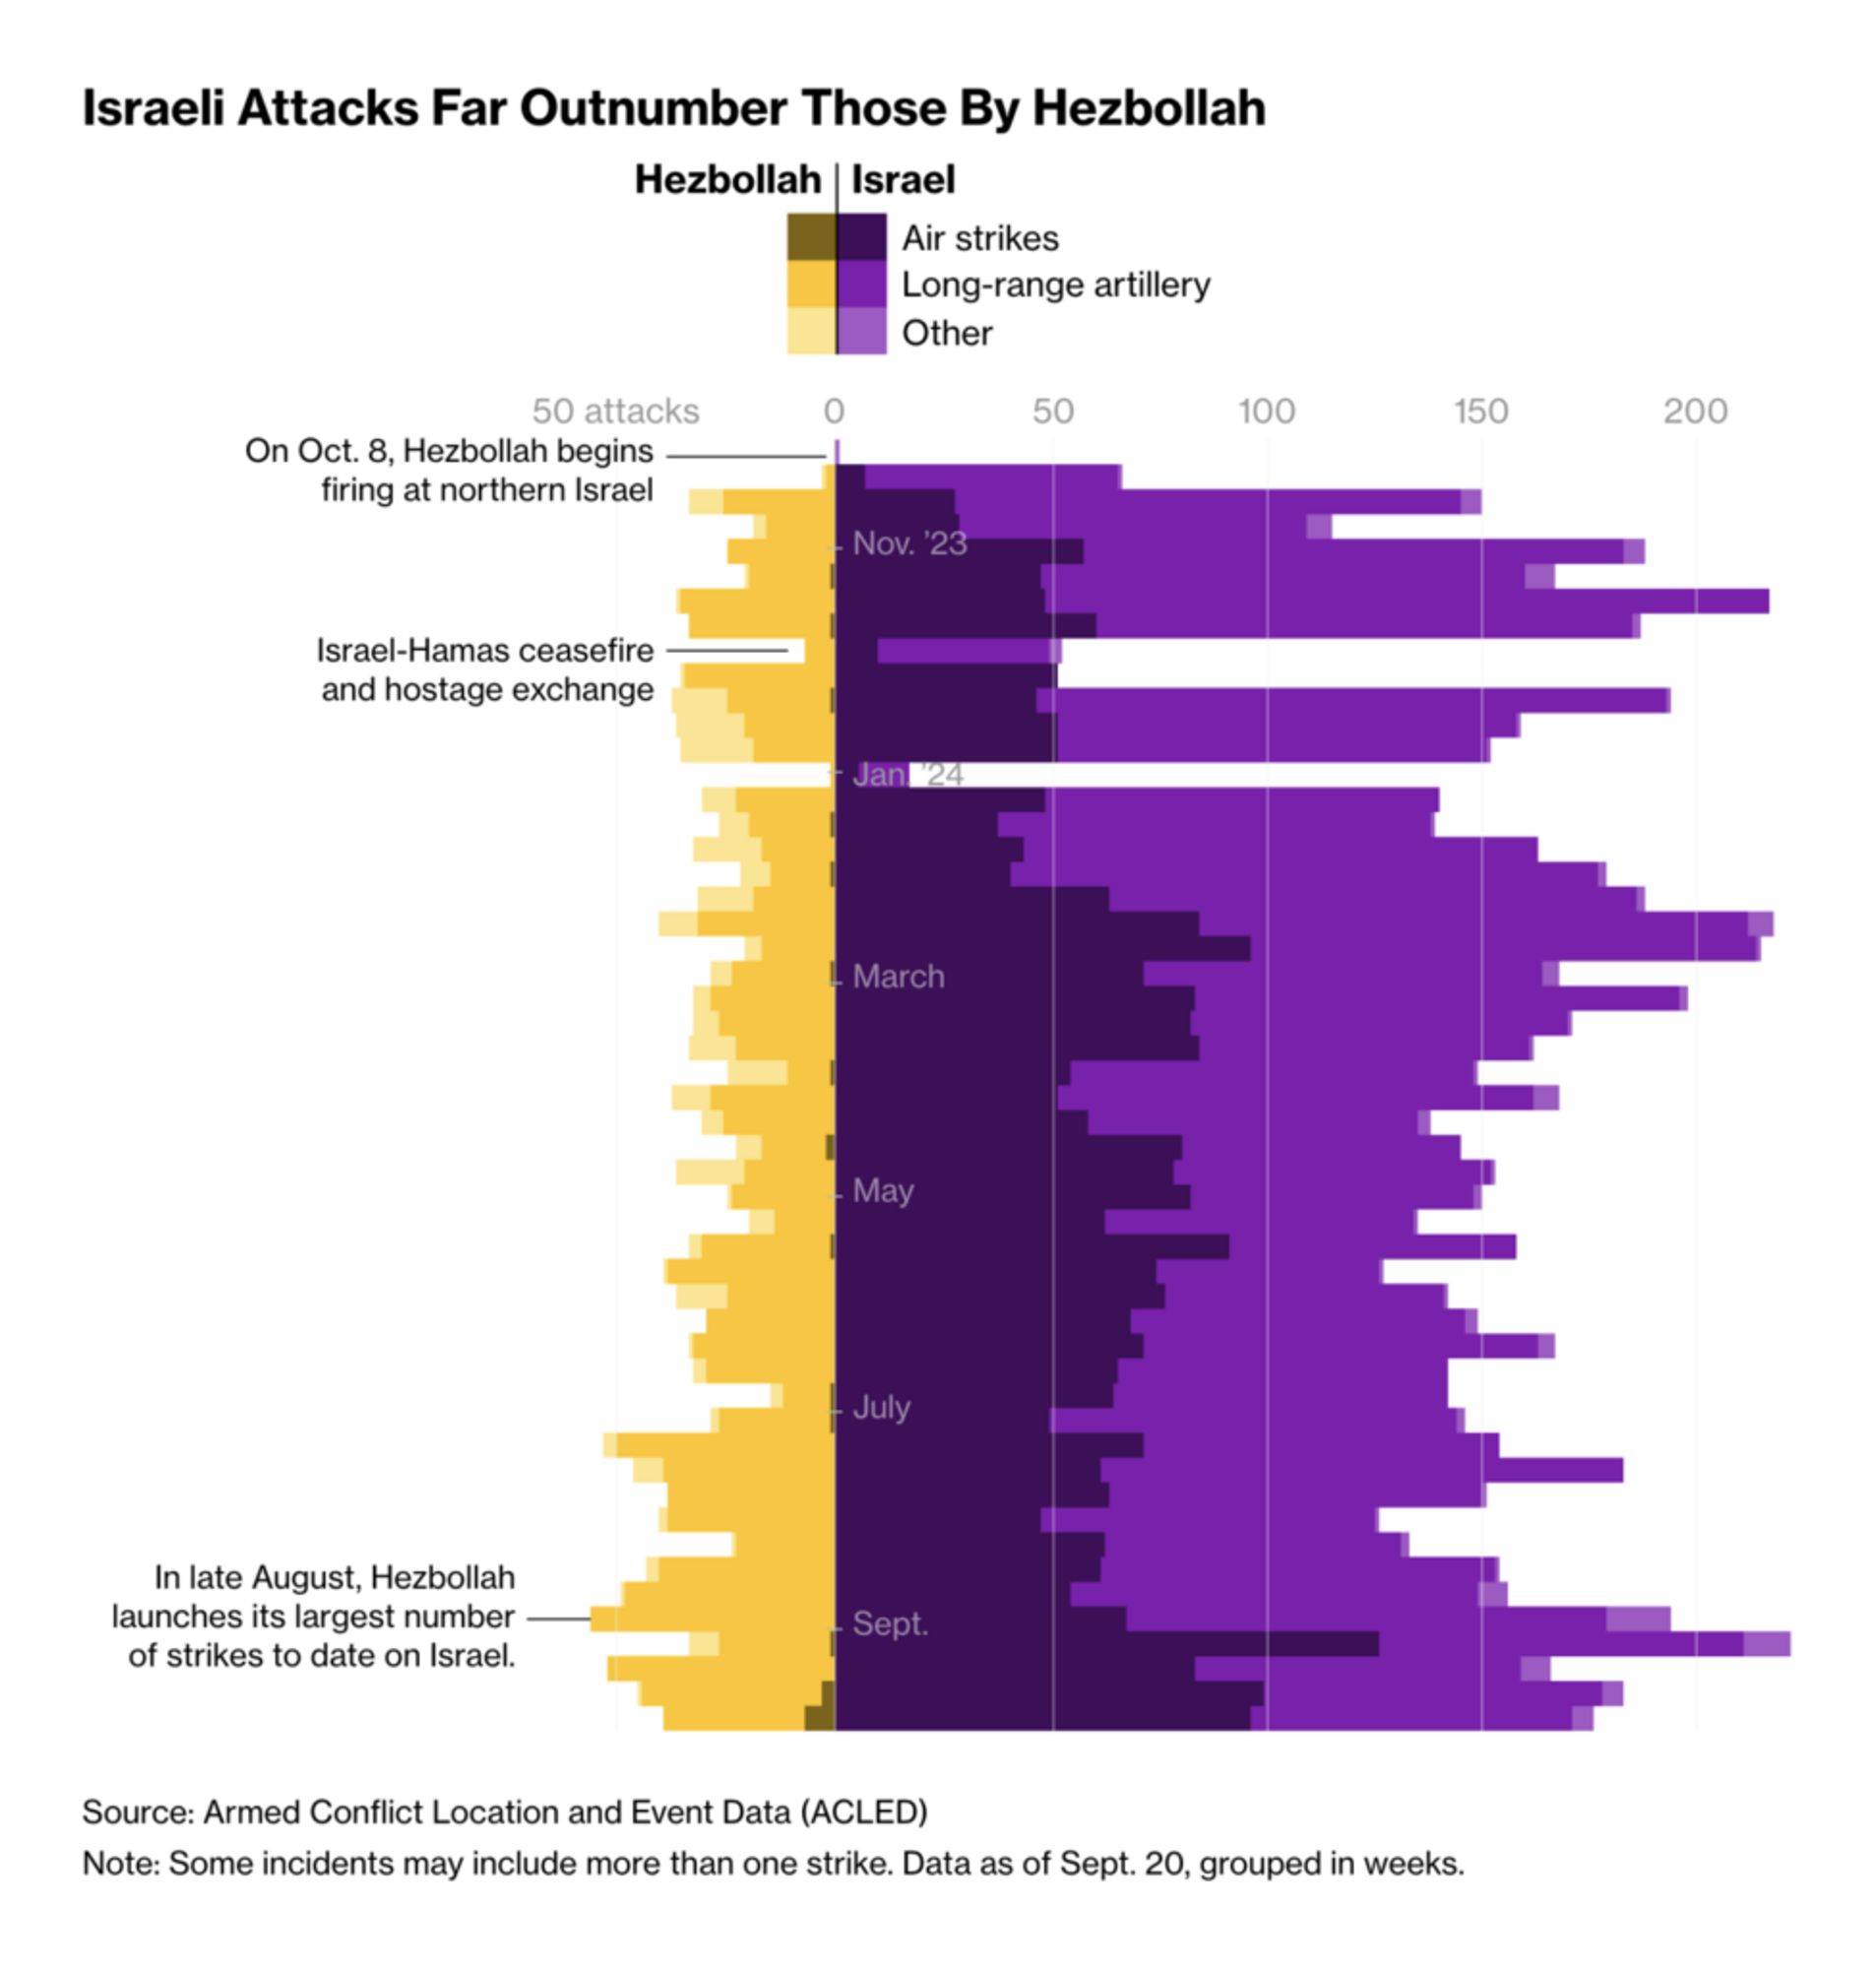
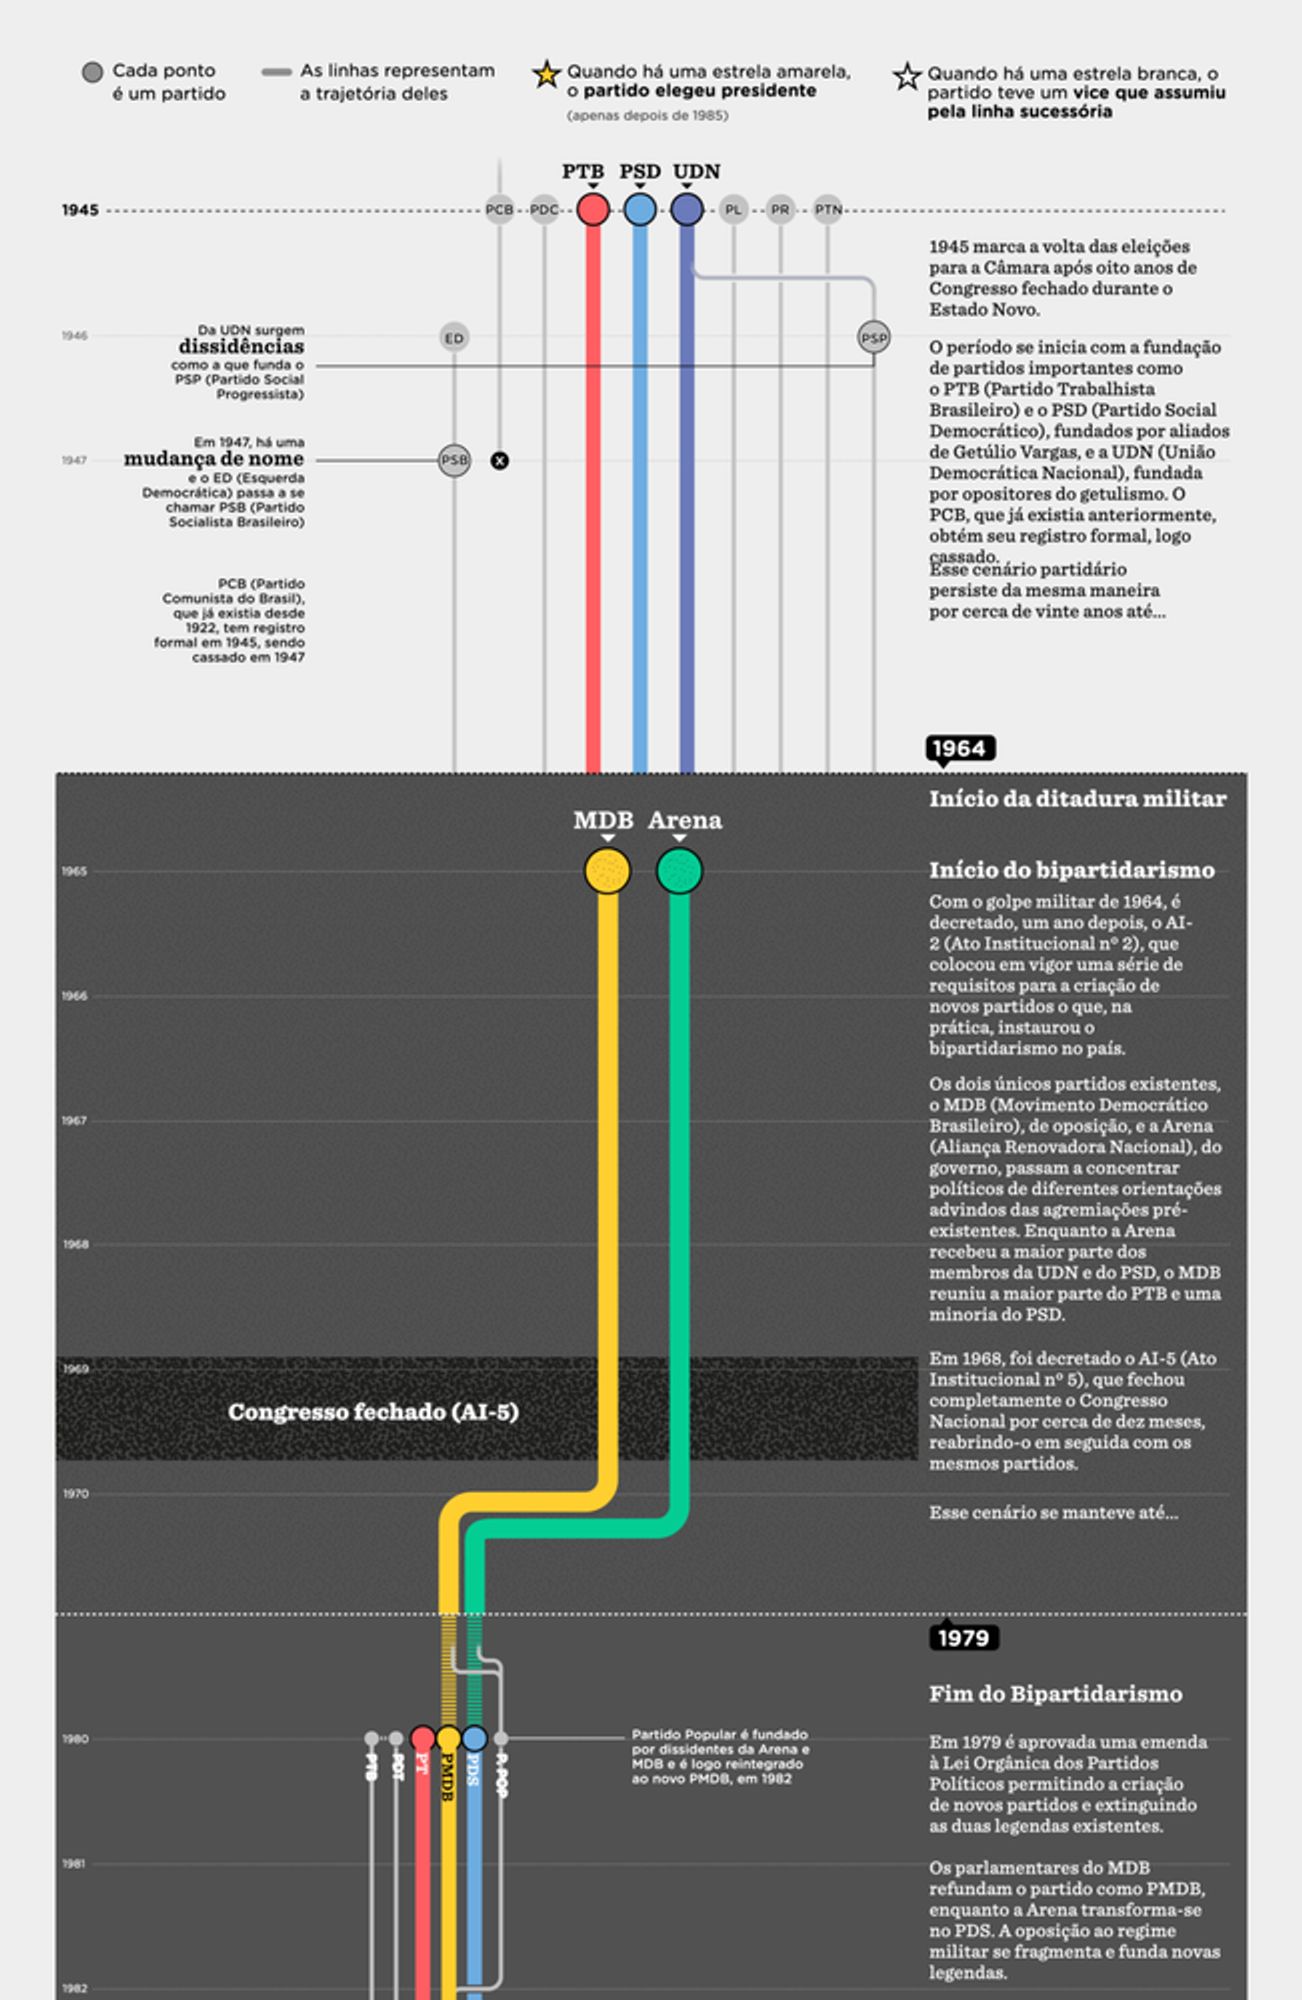
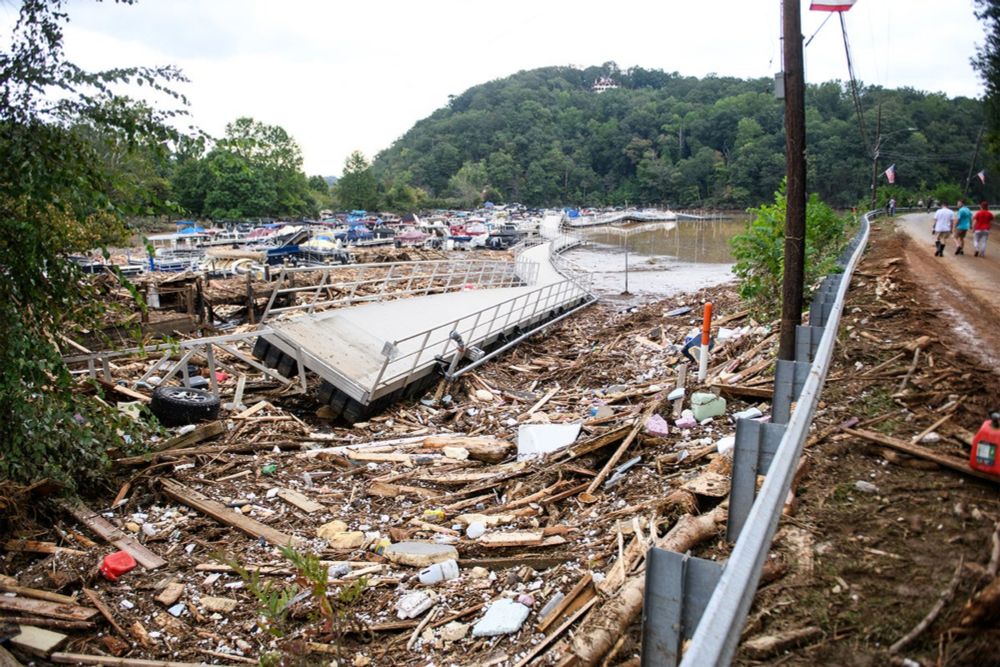
A new Data Vis Dispatch is out! This week's visualizations track trails, portray political parties, and highlight Hurricane Helene. 📩 https://blog.datawrapper.de/data-vis-dispatch-october-1-2024/

Highly recommend Neil's book, especially for early career folks! You can see Neil's journey thru the chapters as his visualizations became more exciting, drawing less from previous projects & more from other sources of inspiration like art. Great resource if you're on a similar path in #dataviz!
Welcome new followers, pls forgive some self-promotion! My book Questions in Dataviz is 20% off with free worldwide postage routledge.pub/Questions-in... If you're looking for inspiration for unconventional dataviz, or wanting prompts for your creative thought process, hopefully this is for you! 📊

This book takes the reader through the process of learning and creating data visualisation, following a unique journey with questions every step of the way, ultimately discussing how and when to bend ...
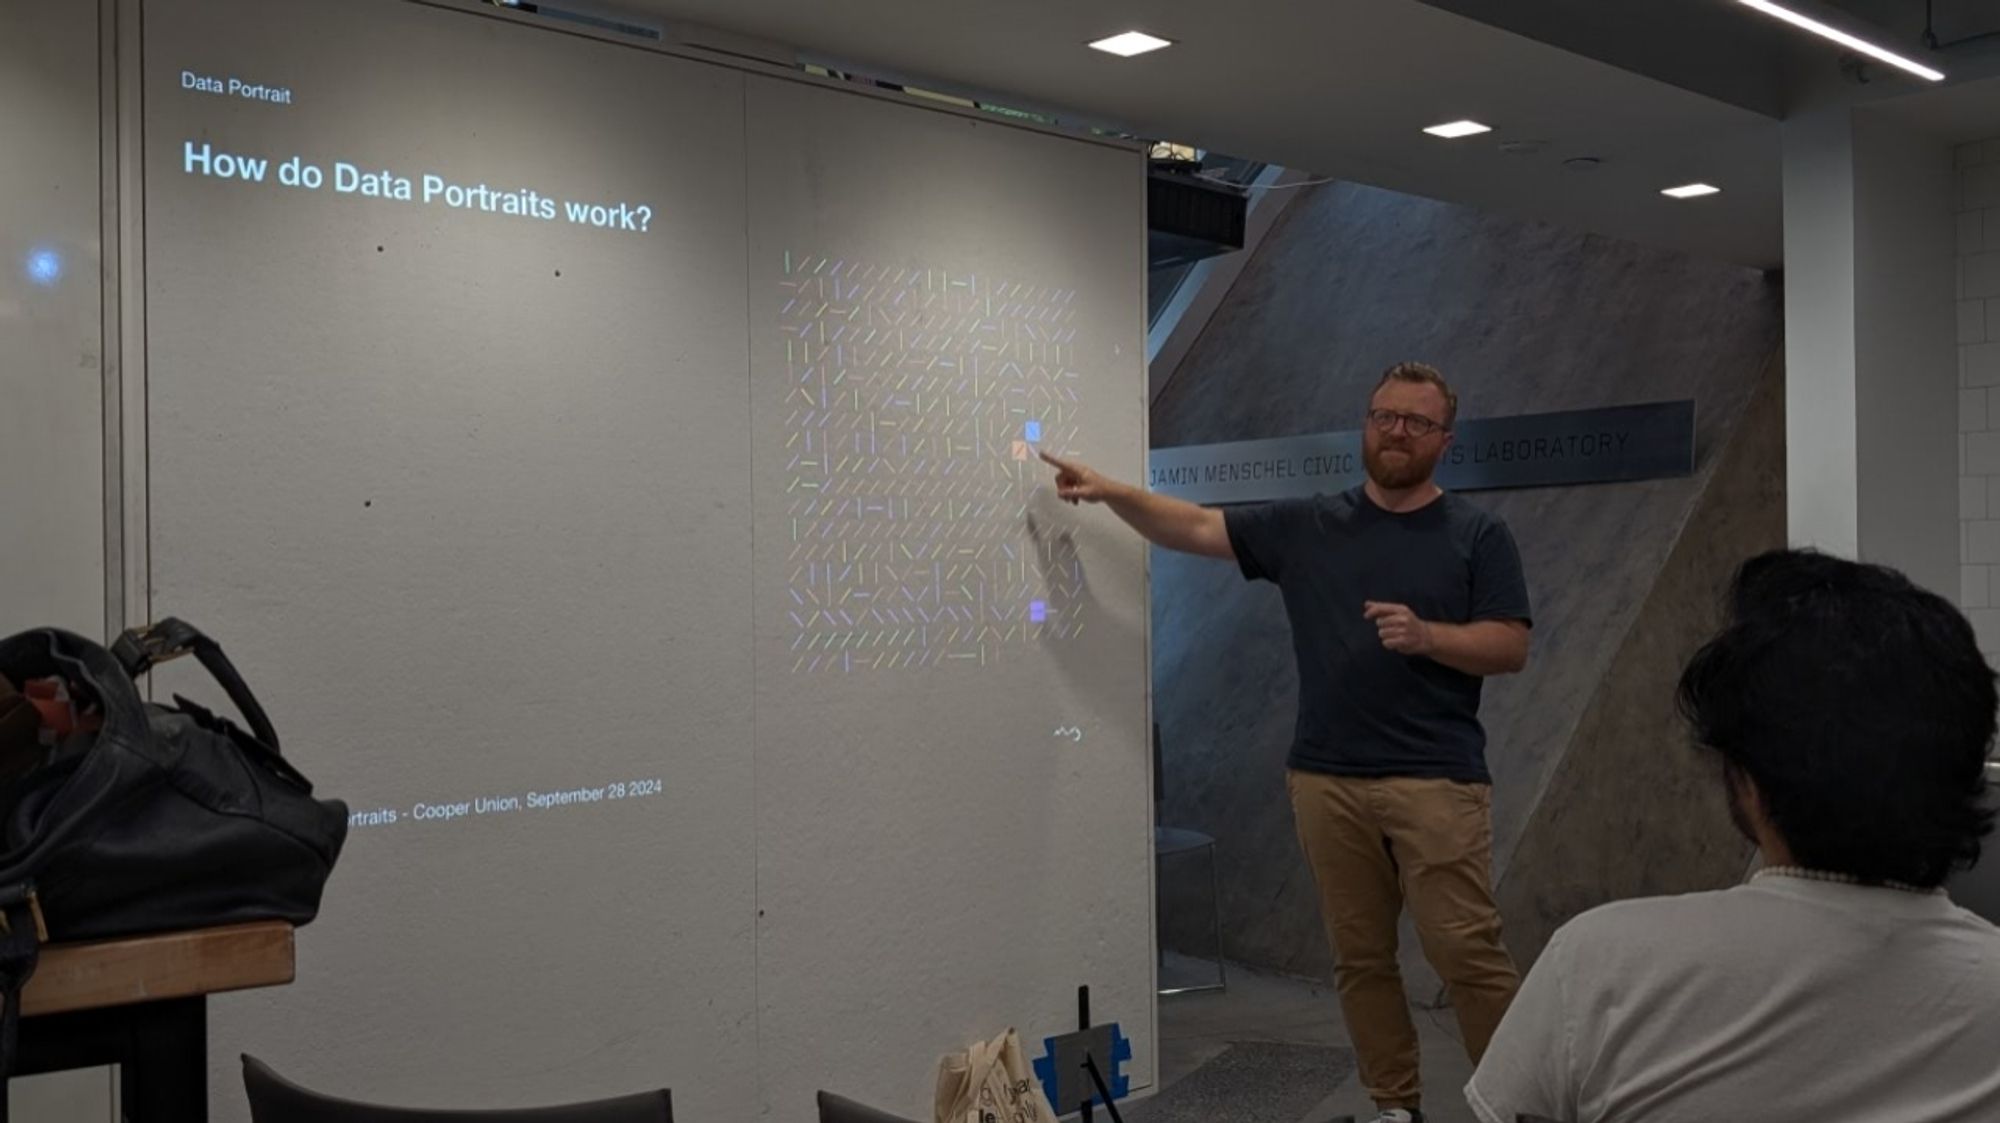
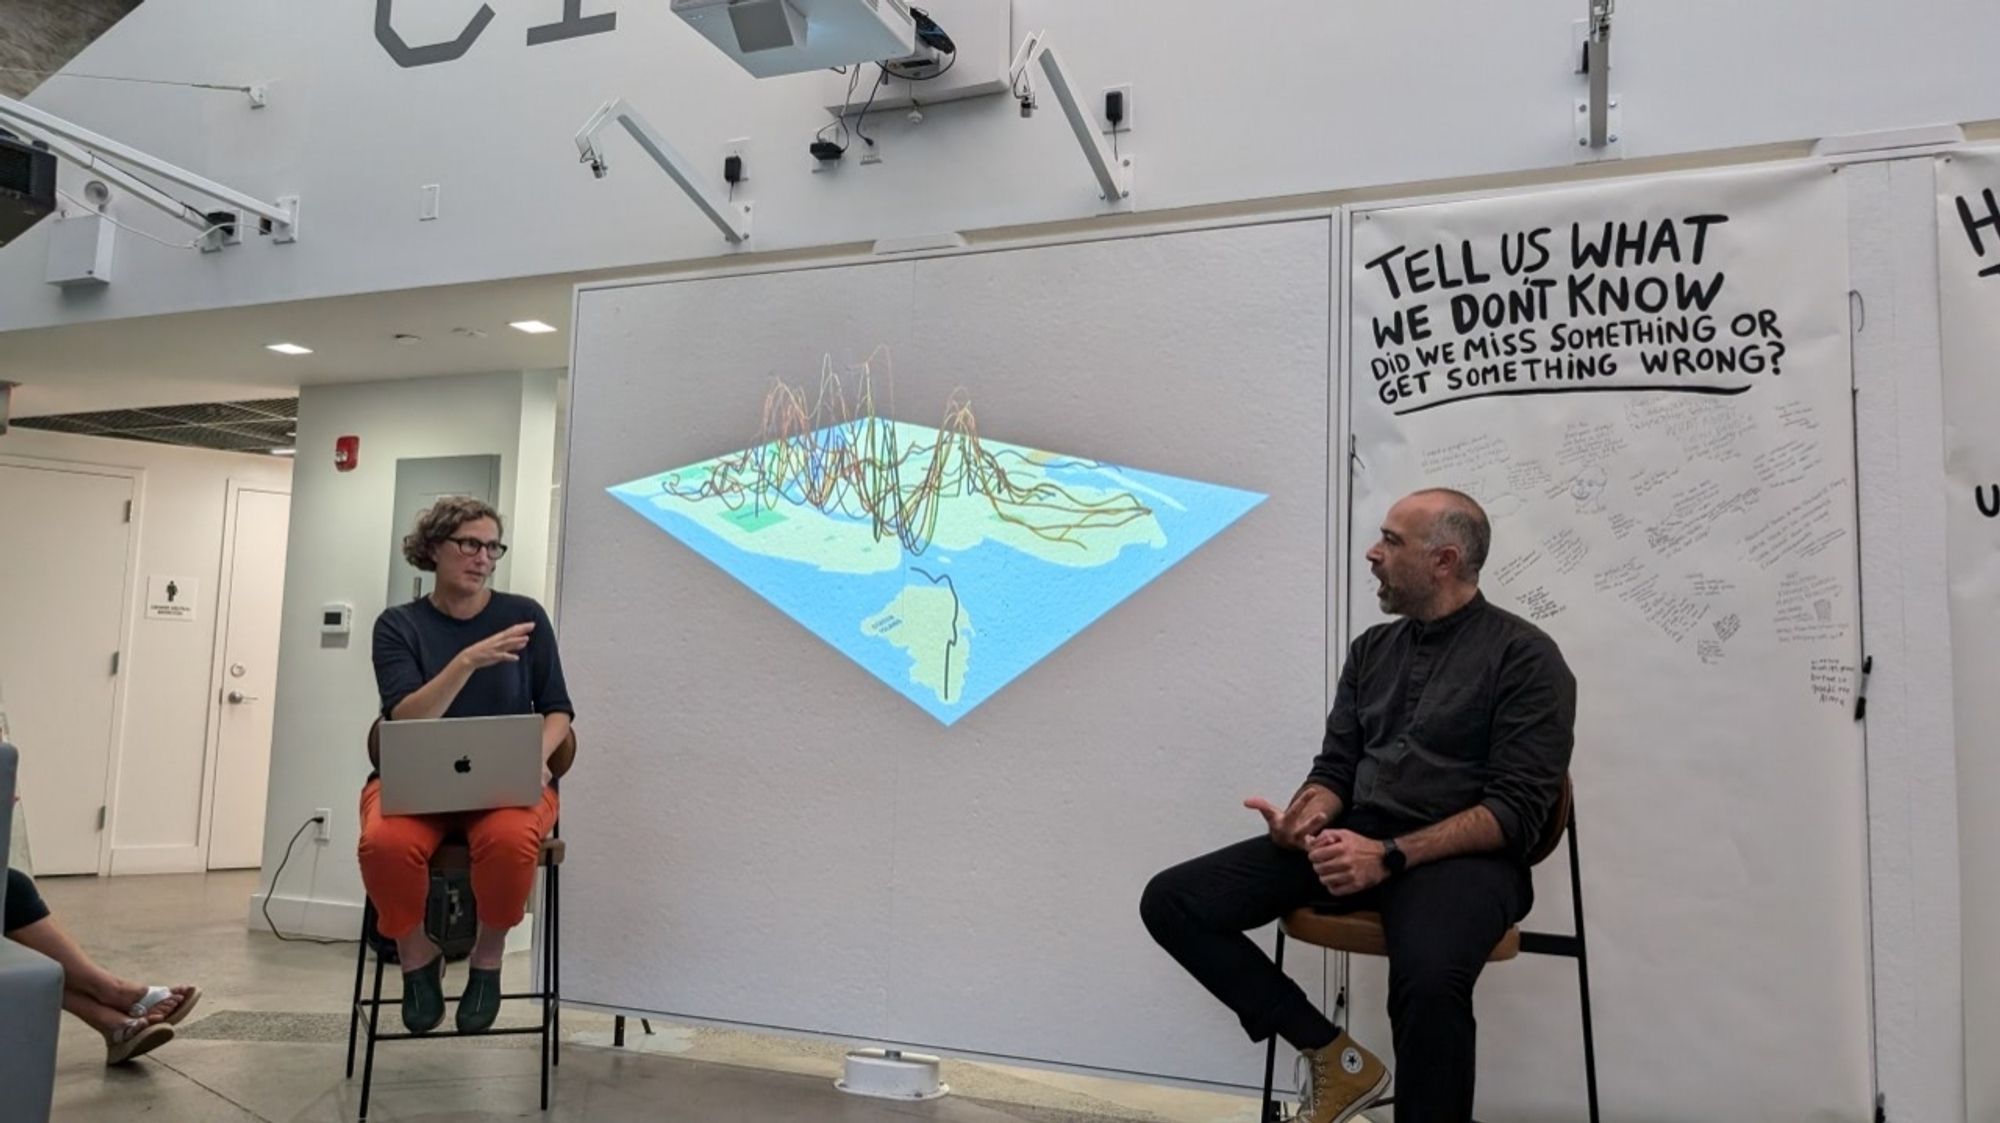
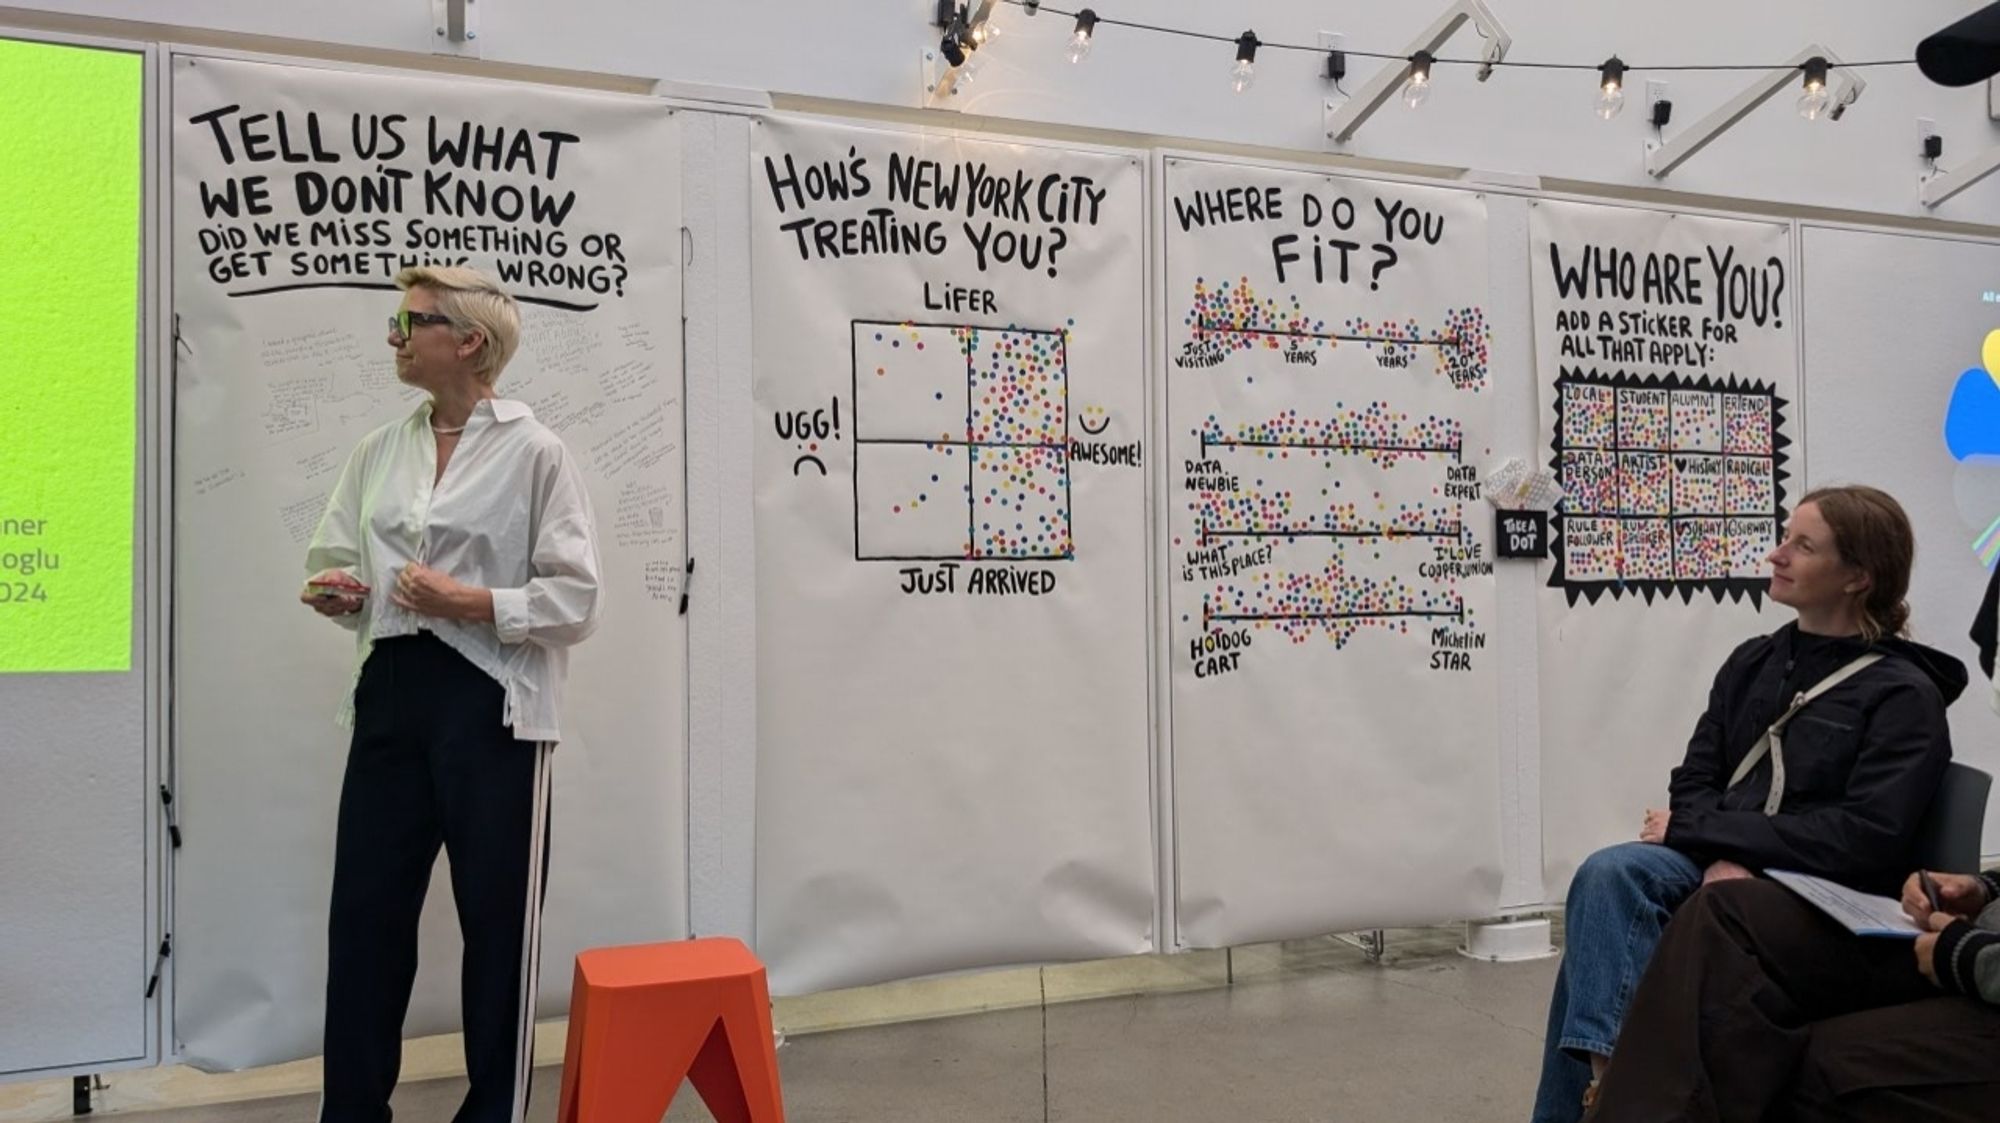
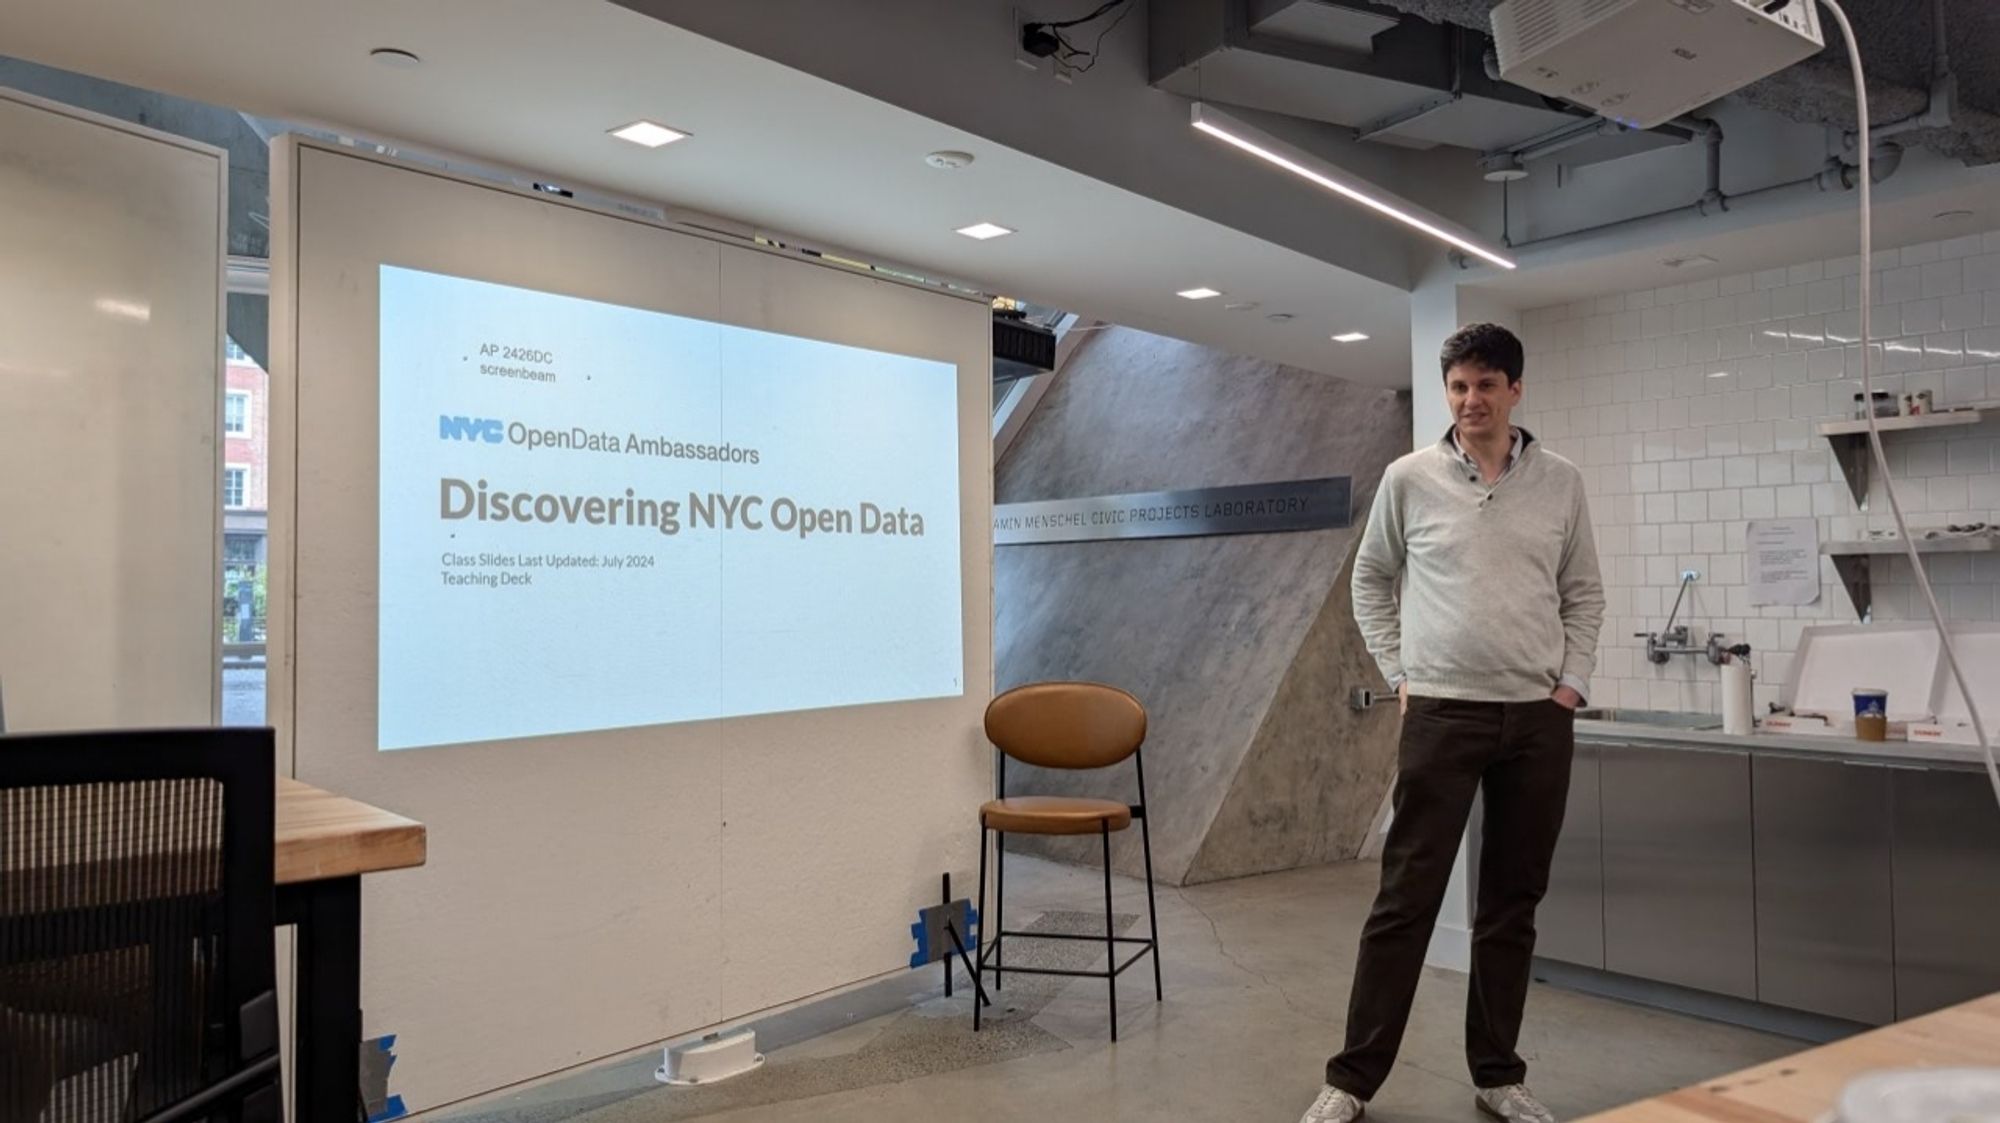
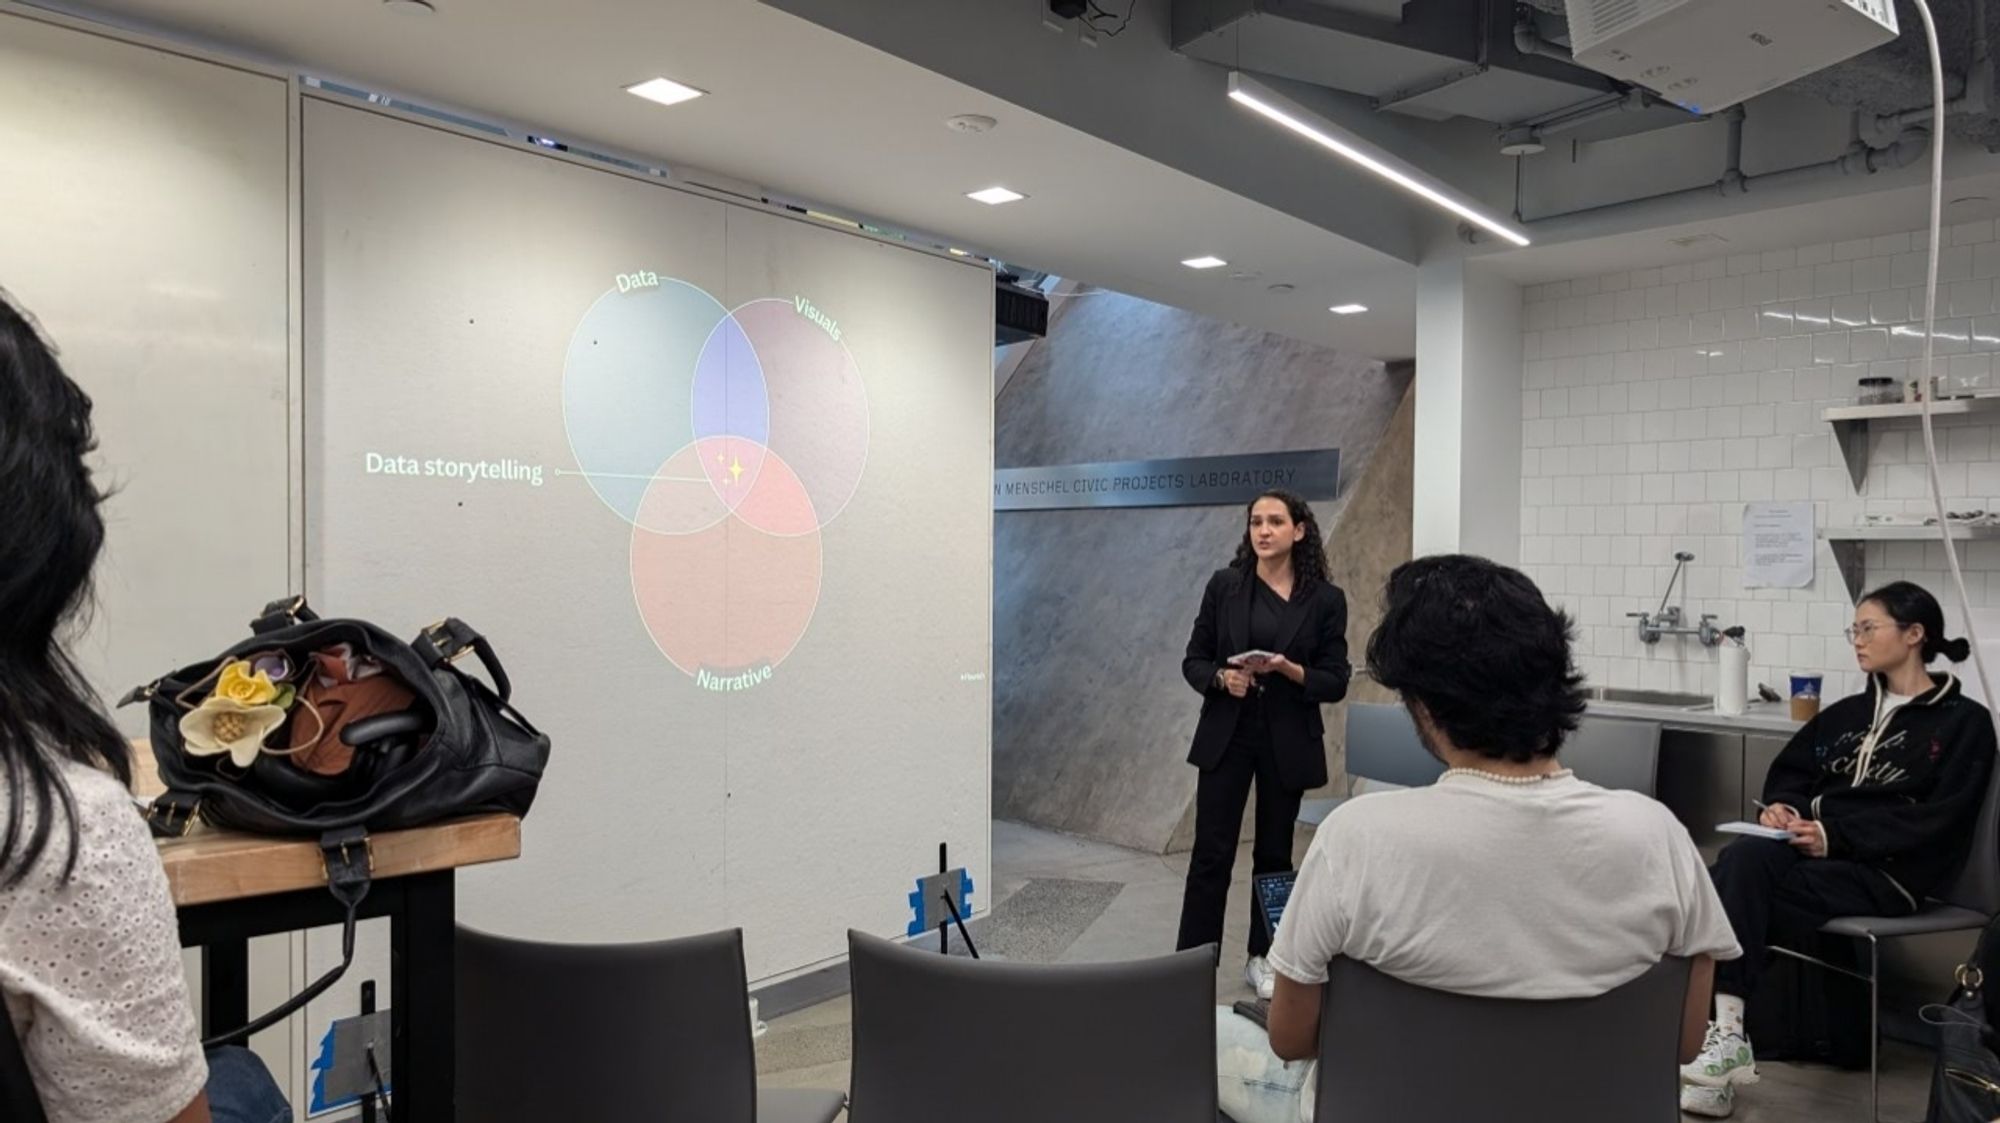
Absolute blast at @jasonforrest.bsky.social 's Data Vandals exhibit this weekend, featuring workshops from NYC Open Data, Flourish, Accurat, and Data x Design! And the artwork was amazing and quite informational! Learned lots about Union Square and left looking at the neighborhood w/ new eyes!

Deaths attributable to tropical cyclones are likely drastically undercounted. "Whoa, really?!" said no one, but now there's a study! Check out @andreatweather.bsky.socialwww.scientificamerican.com/article/hurr...
The average tropical cyclone in the U.S. ultimately causes about 7,000 to 11,000 excess deaths, new research finds