

Is there a good source to quote for using techniques like pan and zoom (Ken Burns effect) to examine image clusters? Who has already written about this? #DigitalHumanities#VisualAnalytics#DataVisualization#KenBurnsEffect#CulturalAnalytics#DataScience#DigitalCulture
Asking for help: Is there a good source to quote for using techniques like pan and zoom (Ken Burns effect) to examine image clusters? Who has already written about this? #DigitalHumanities#VisualAnalytics#DataVisualization#KenBurnsEffect#ImageAnalysis#CulturalAnalytics#DataScience […]
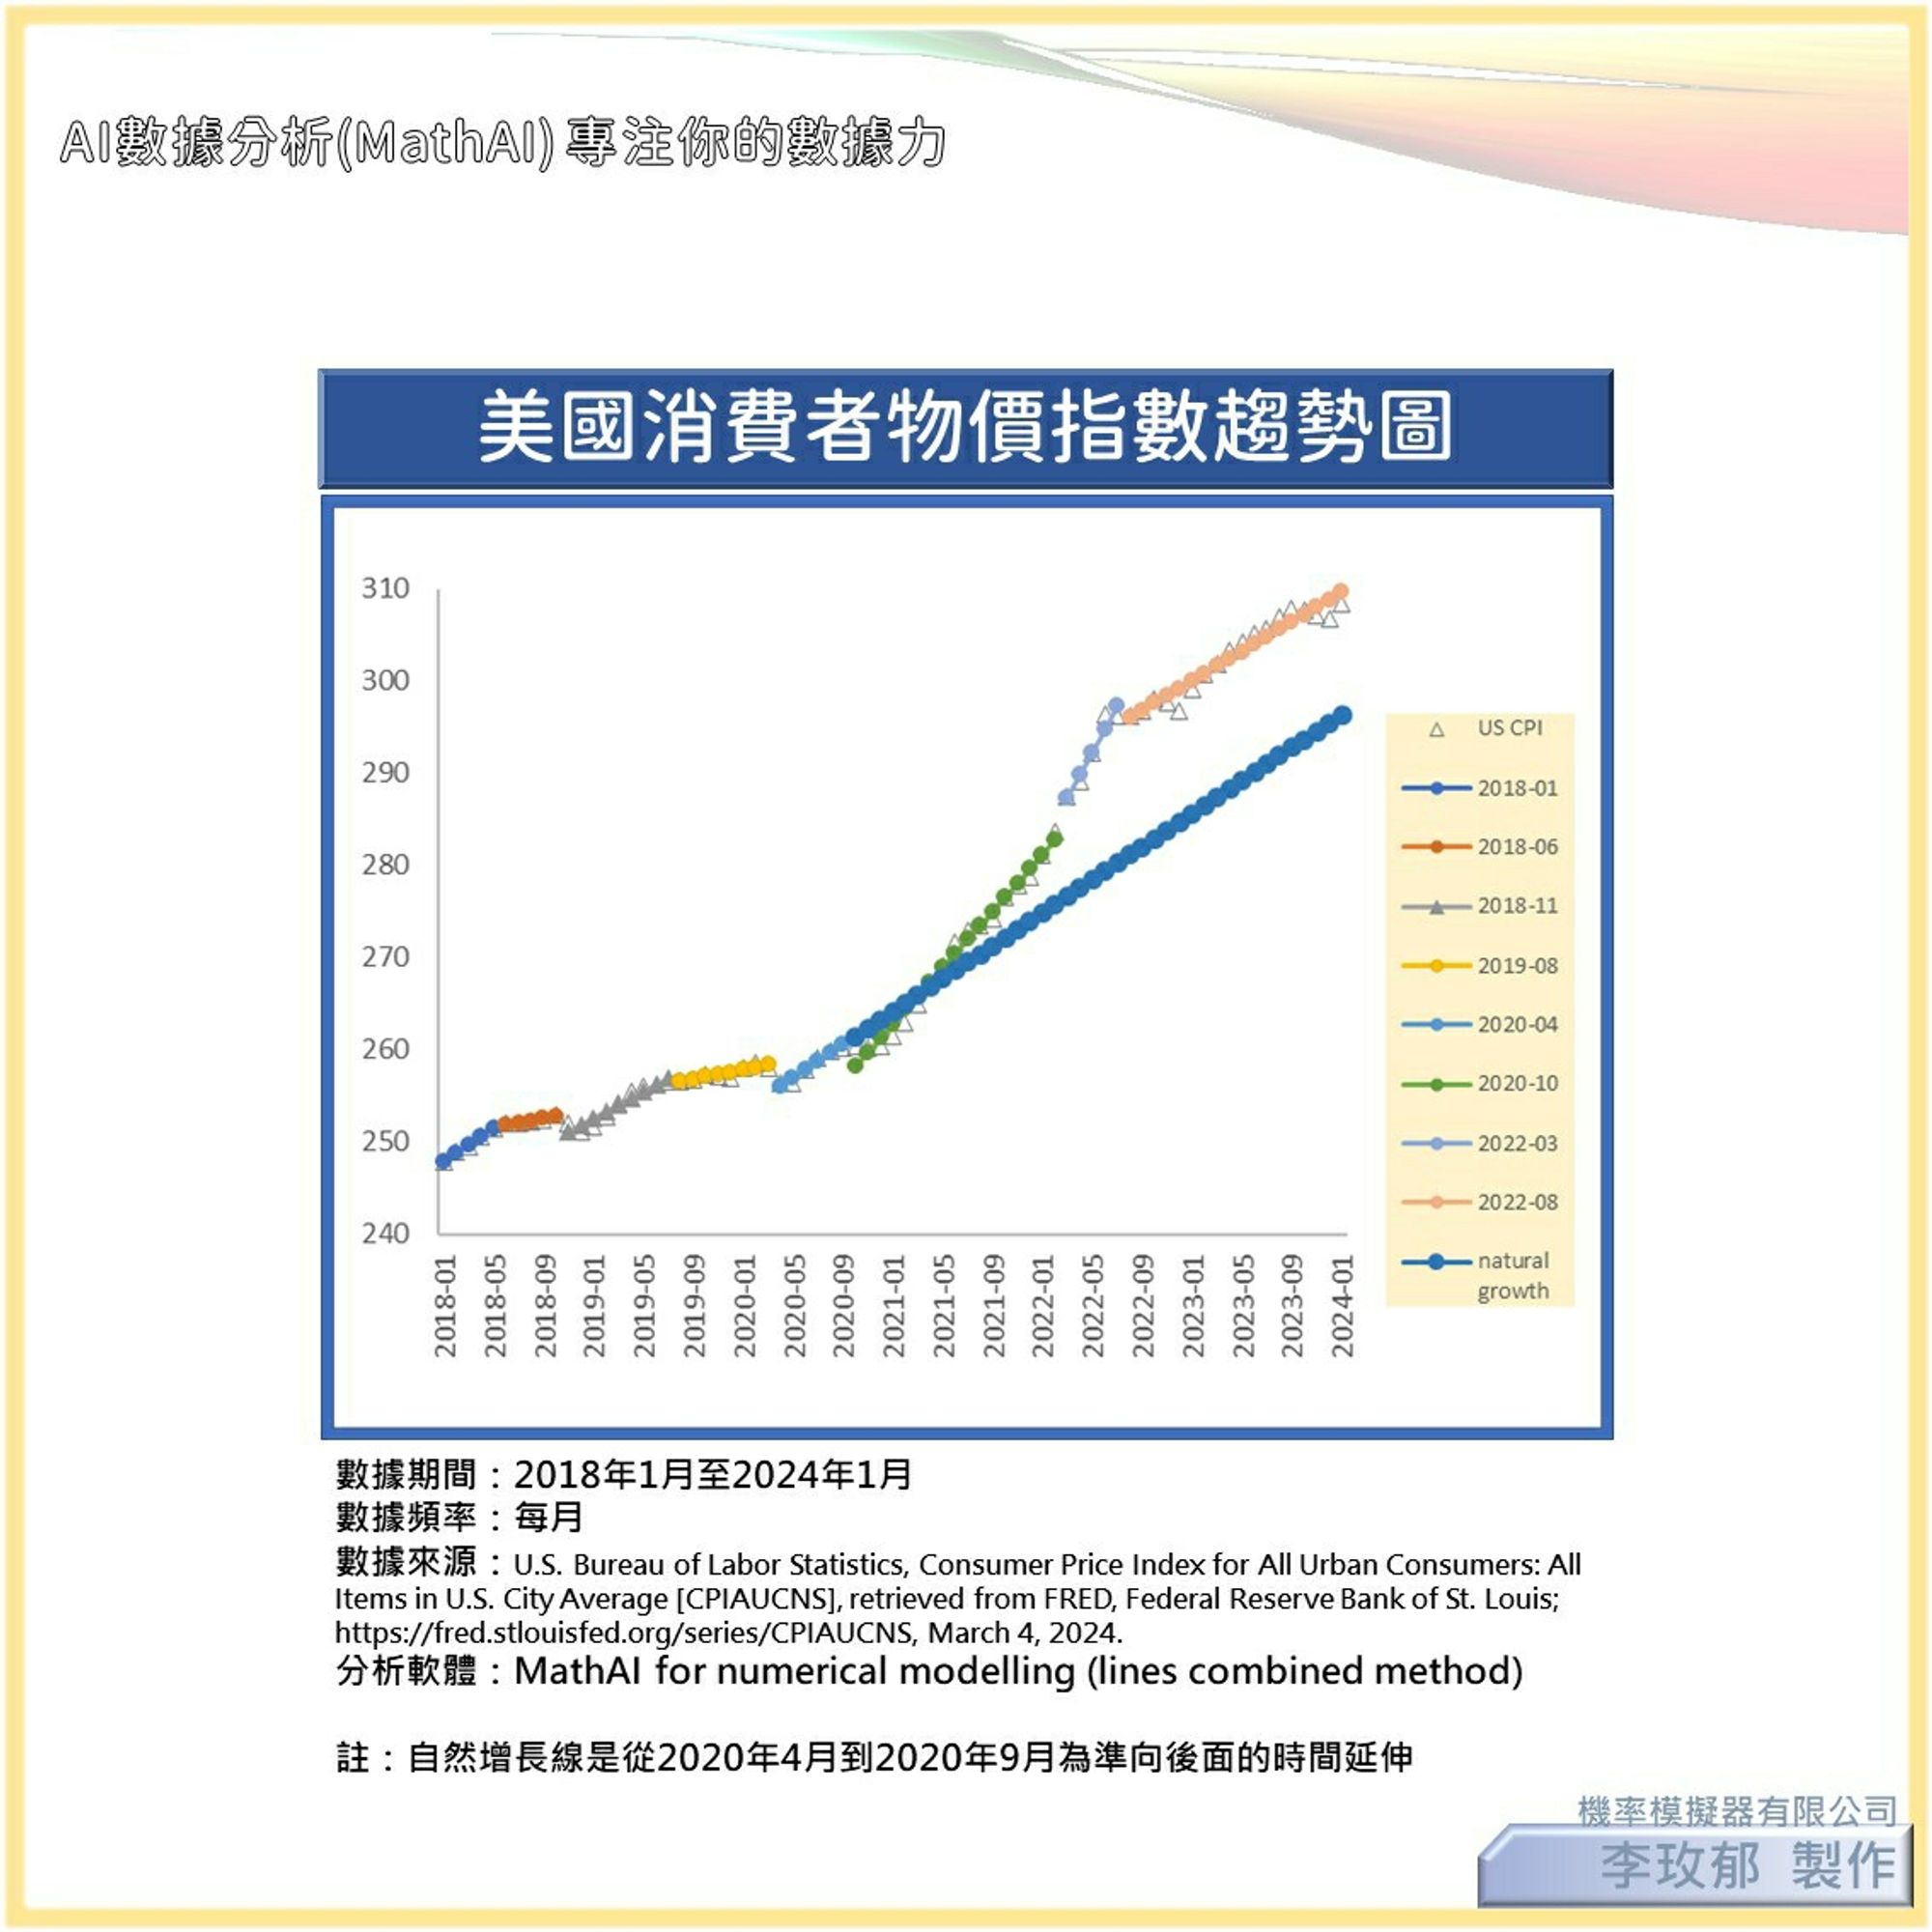
我們選擇第二種情況為例。當然你也能選第一種情況製作圖形,進行觀察。 計算差值=每個月的真實消費者物價指數減去當月自然增長下的估計值。因為自然增長期是從2020年10月到2024年1月,有底色的區域就是這段時間。 5/ #經濟#財經#AI#MathAI#inflation#VisualAnalytics#AI數據分析#數據分析#人工智慧#人工智能#知識#學習#dataanalysis#觀點#通貨膨脹#通膨
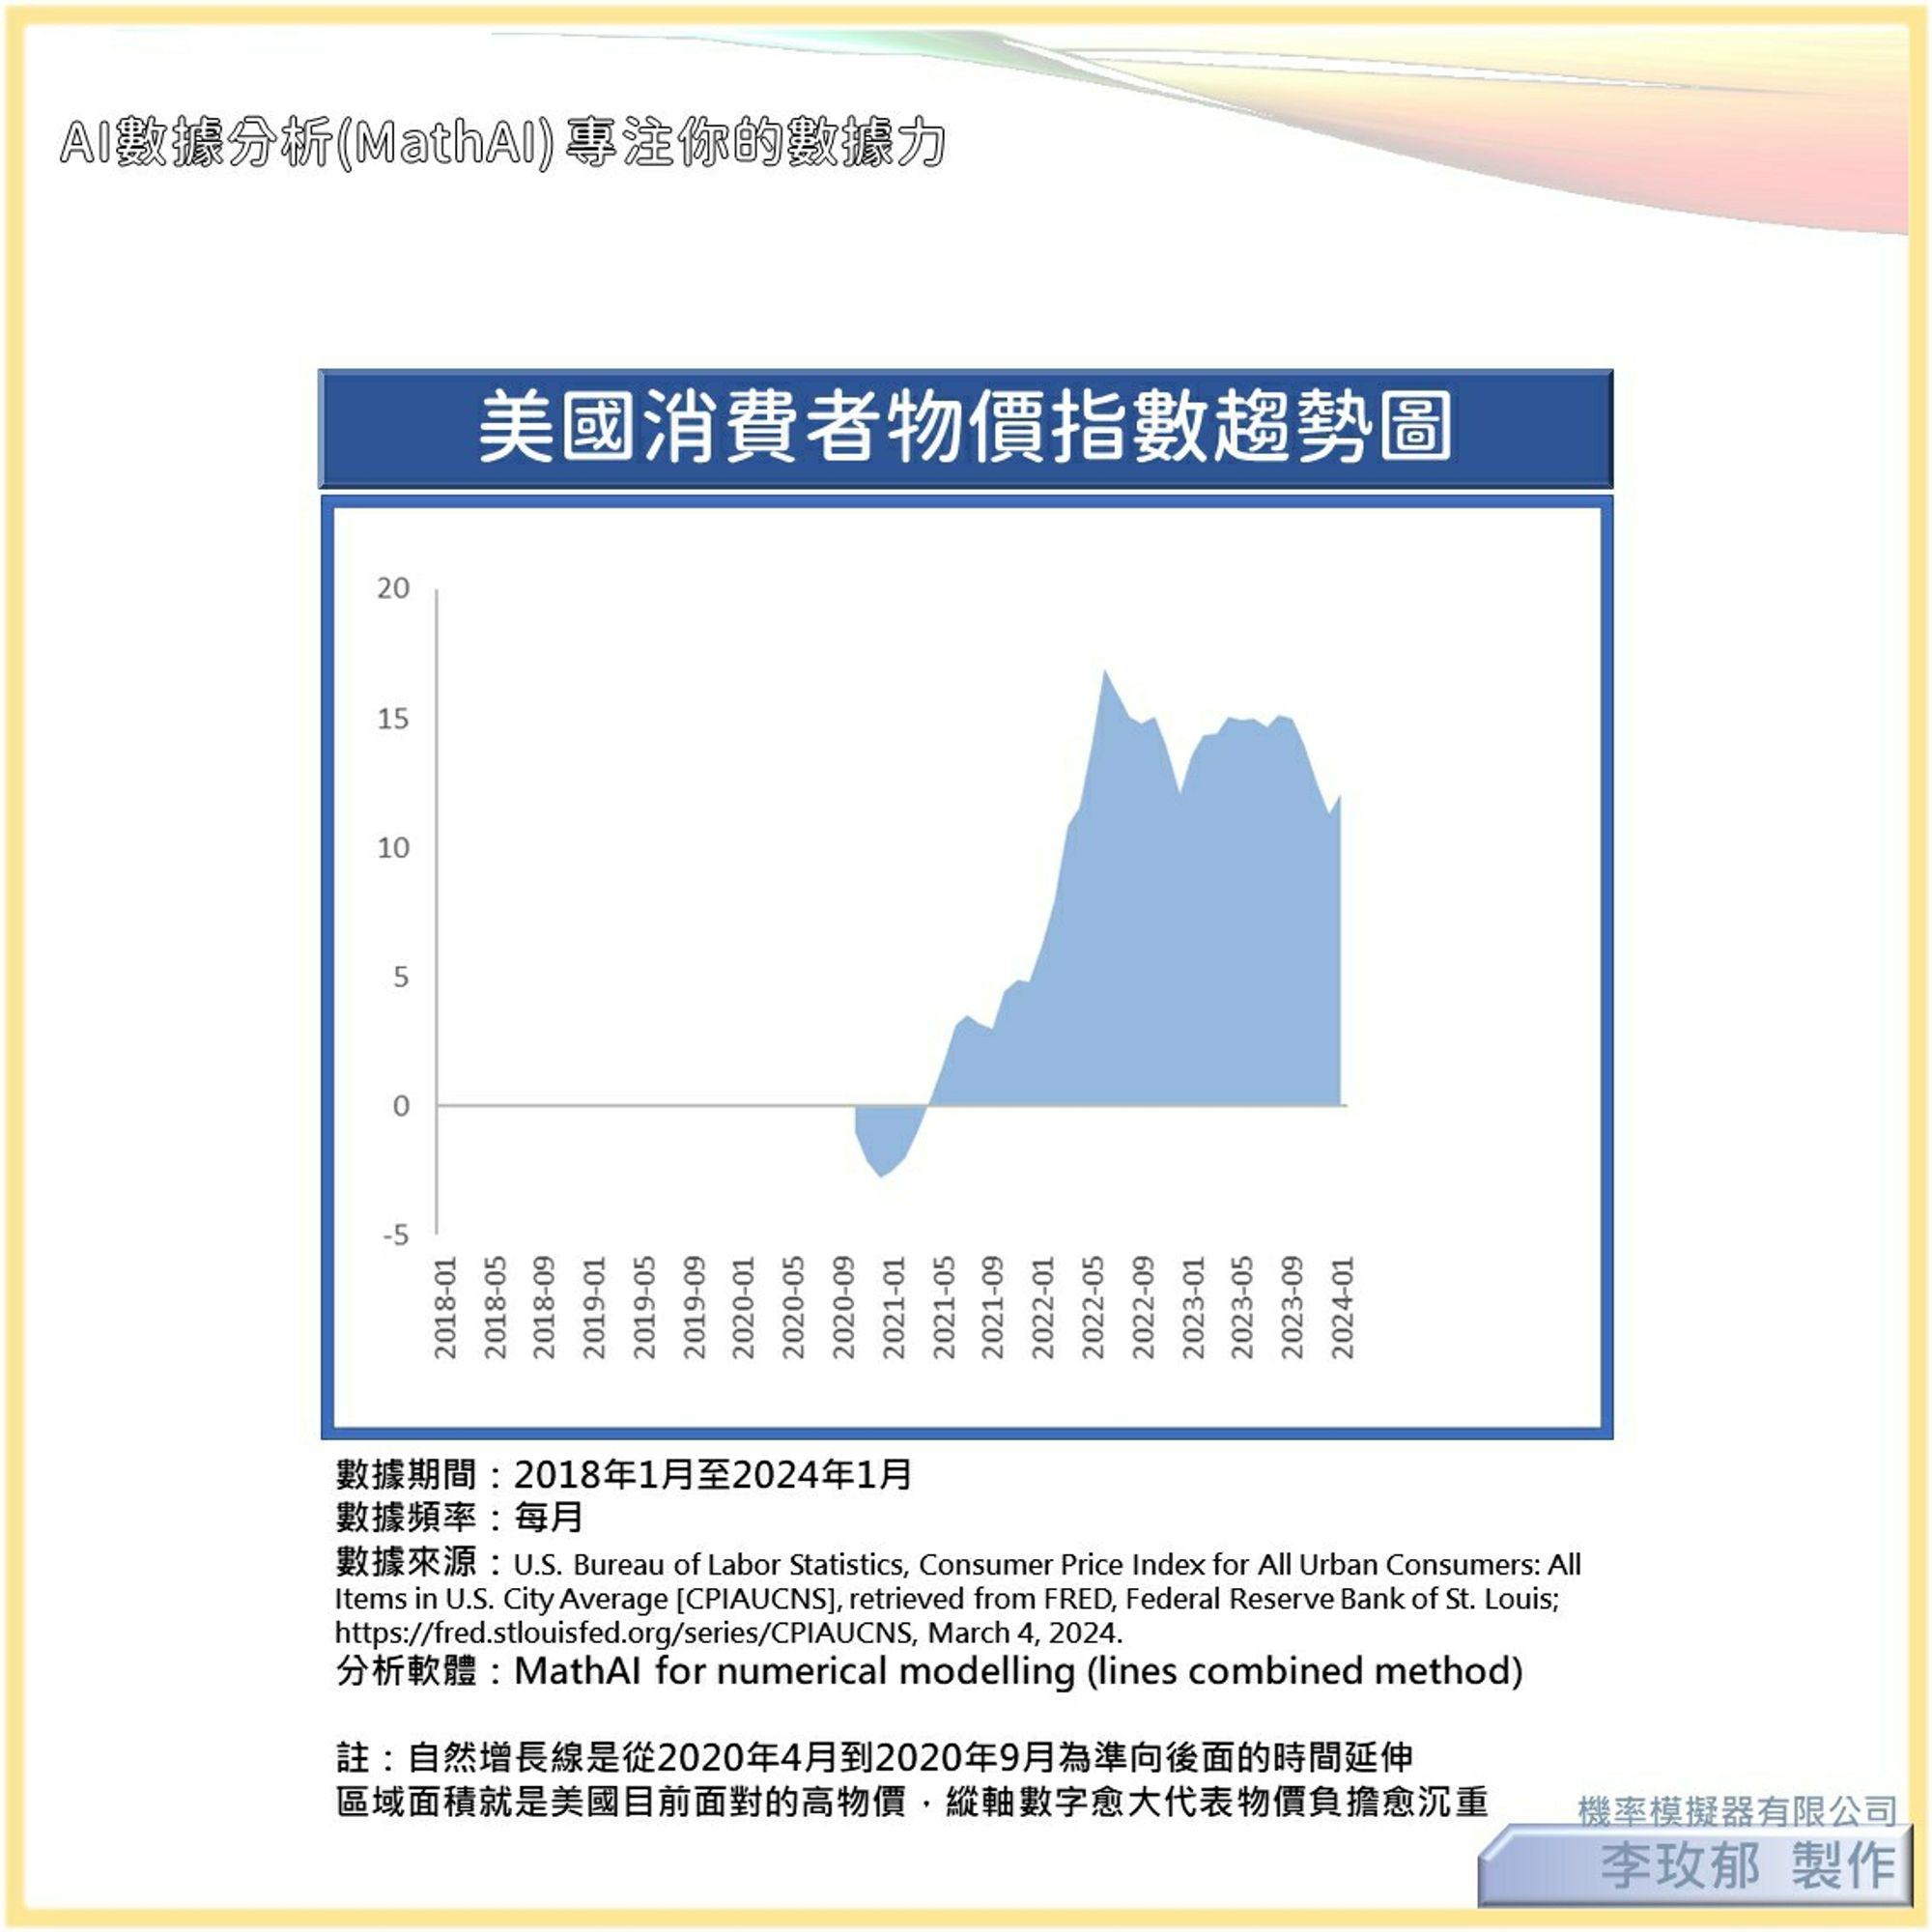
我們一樣用此條趨勢線的數學式,繼續計算後續時間對應的消費者物價指數估計值。(見藍線) 有沒有覺得深藍色線與最新趨勢好似平行呢? 事實上,深藍色線平均每月增長0.895,最新趨勢平均每月增長0.798。 我們從這兩種情況都發現時間作用下,自然增長的趨勢線仍無法追上美國的真實物價水準。 4/ #經濟#財經#AI#MathAI#inflation#VisualAnalytics#AI數據分析#數據分析#人工智慧#人工智能#知識#學習#觀點#通貨膨脹#通膨
每個月的真實值減去黃線的估計值,就是美國物價高於“如果沒有新冠肺炎下的可能會因時間增長的物價水準”。 兩數值差距愈大,即圖上的垂直距離愈大,物價愈發高漲! 3/ #經濟#財經#AI#MathAI#inflation#VisualAnalytics#AI數據分析#數據分析#人工智慧#人工智能#知識#學習#觀點#通貨膨脹#通膨
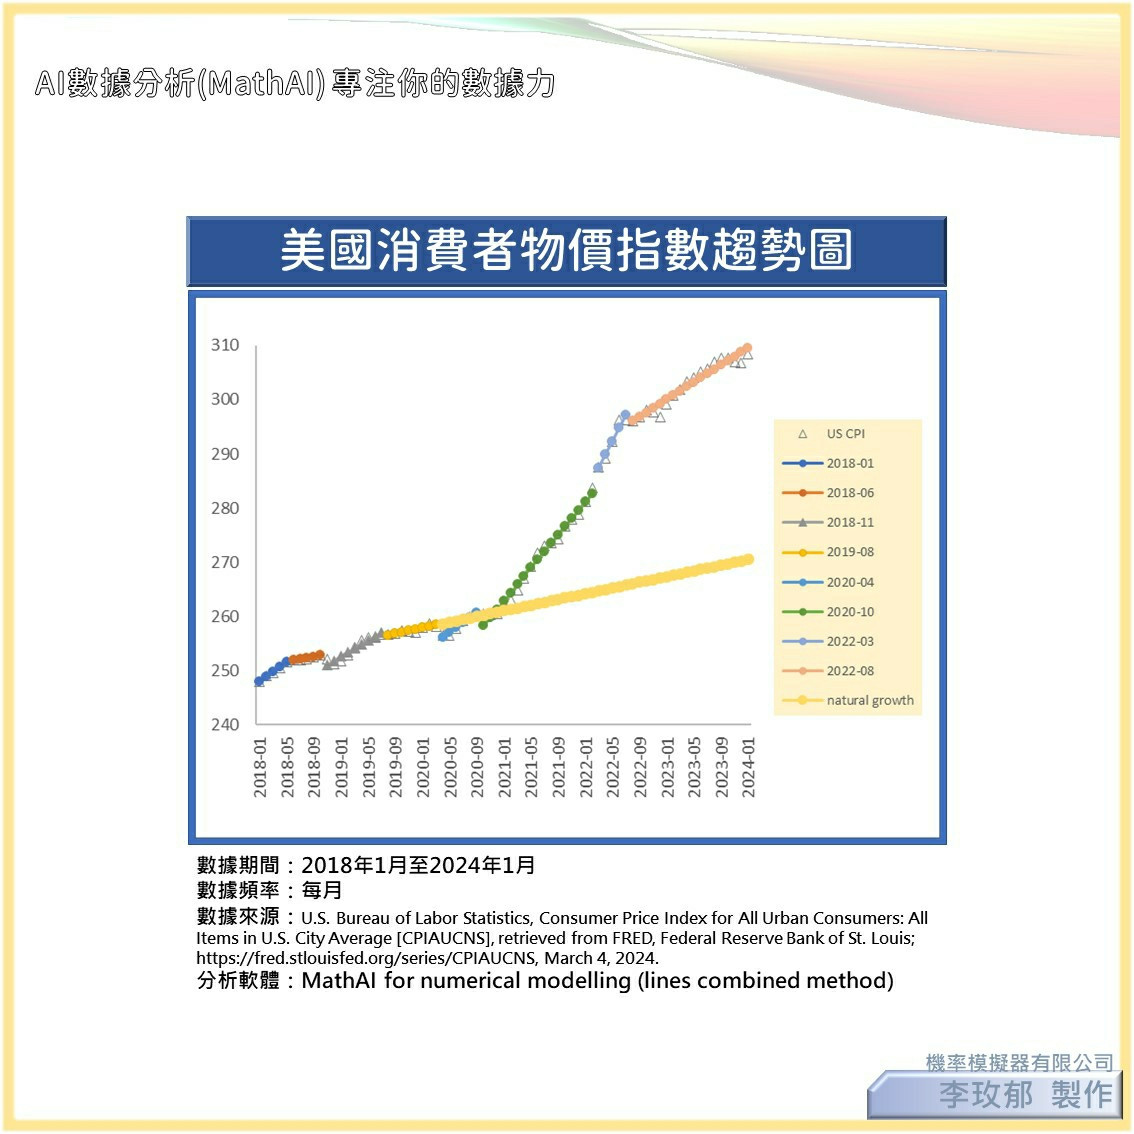
這可以說是見仁見智。 我選擇兩個期間為“基準”。這是我個人認為的!你也可以選擇其他方式當作“基準”。 第一個期間是經過AI數據分析得到的2019年8月到2020年3月的精準趨勢線。 這是一條直線,所以我能根據它的數學式(估計式),繼續計算接下去時間代號的消費者物價指數估計值‼️ (黃線) 此時,我們能清楚看到黃線低於真實的消費者物價指數,以及精準趨勢線🤓 2/ #經濟#財經#AI#MathAI#inflation#VisualAnalytics#AI數據分析#數據分析#人工智慧#人工智能#知識#學習#觀點#通貨膨脹#通膨
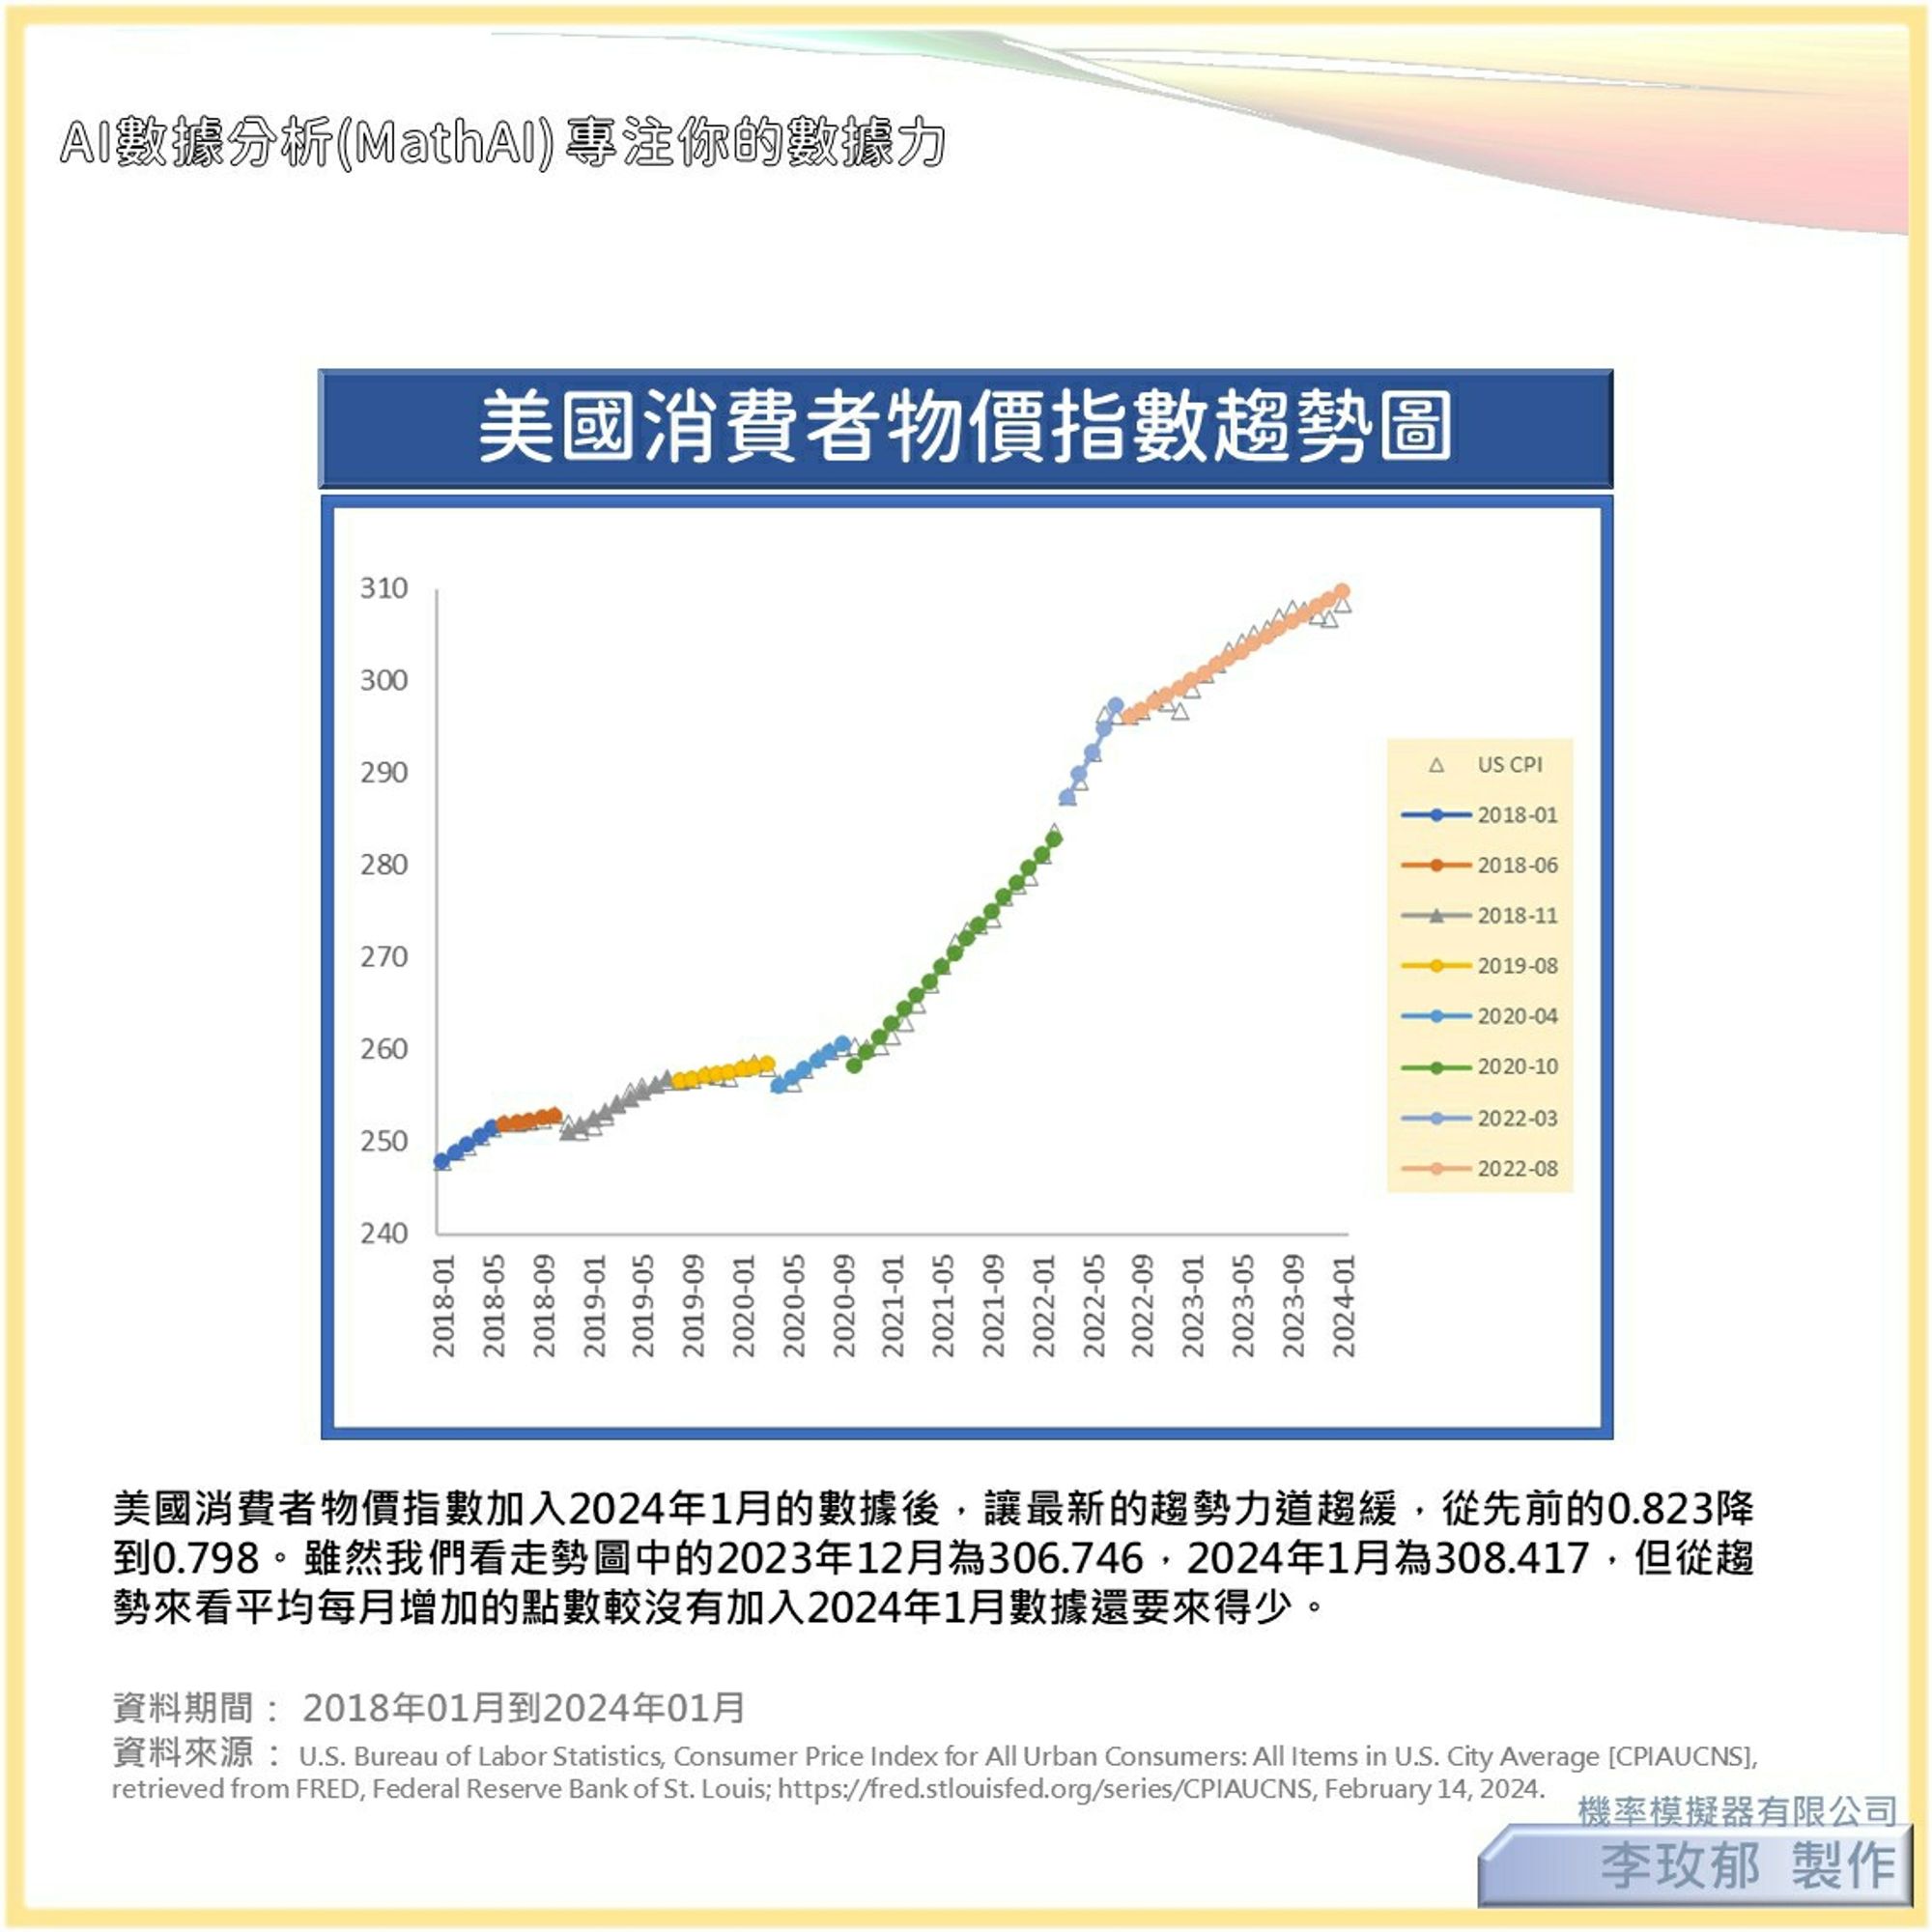
圖一沒有比較基準點,怎麼能說美國物價高漲呢?看圖的縱軸說數字愈來愈大⁉️ 這是一個最直接的方式。 你覺得現在美國物價水準高,應該是看到其他物價的相對位置才這麼認為的,還是有其他方式看出美國物價水準很高呢? 1/ #AI#MathAI#AI數據分析#數據分析#人工智慧#人工智能#VisualAnalytics#dataanalysis#inflation#知識#學習#觀點#inflation#通貨膨脹#通膨
這可以說是見仁見智。 我選擇兩個期間為“基準”。這是我個人認為的!你也可以選擇其他方式當作“基準”。 第一個期間是經過AI數據分析得到的2019年8月到2020年3月的精準趨勢線。 這是一條直線,所以我能根據它的數學式(估計式),繼續計算接下去時間代號的消費者物價指數估計值‼️ (黃線) 此時,我們能清楚看到黃線低於真實的消費者物價指數,以及精準趨勢線🤓 2/ #經濟#財經#AI#MathAI#inflation#VisualAnalytics#AI數據分析#數據分析#人工智慧#人工智能#知識#學習#觀點#通貨膨脹#通膨
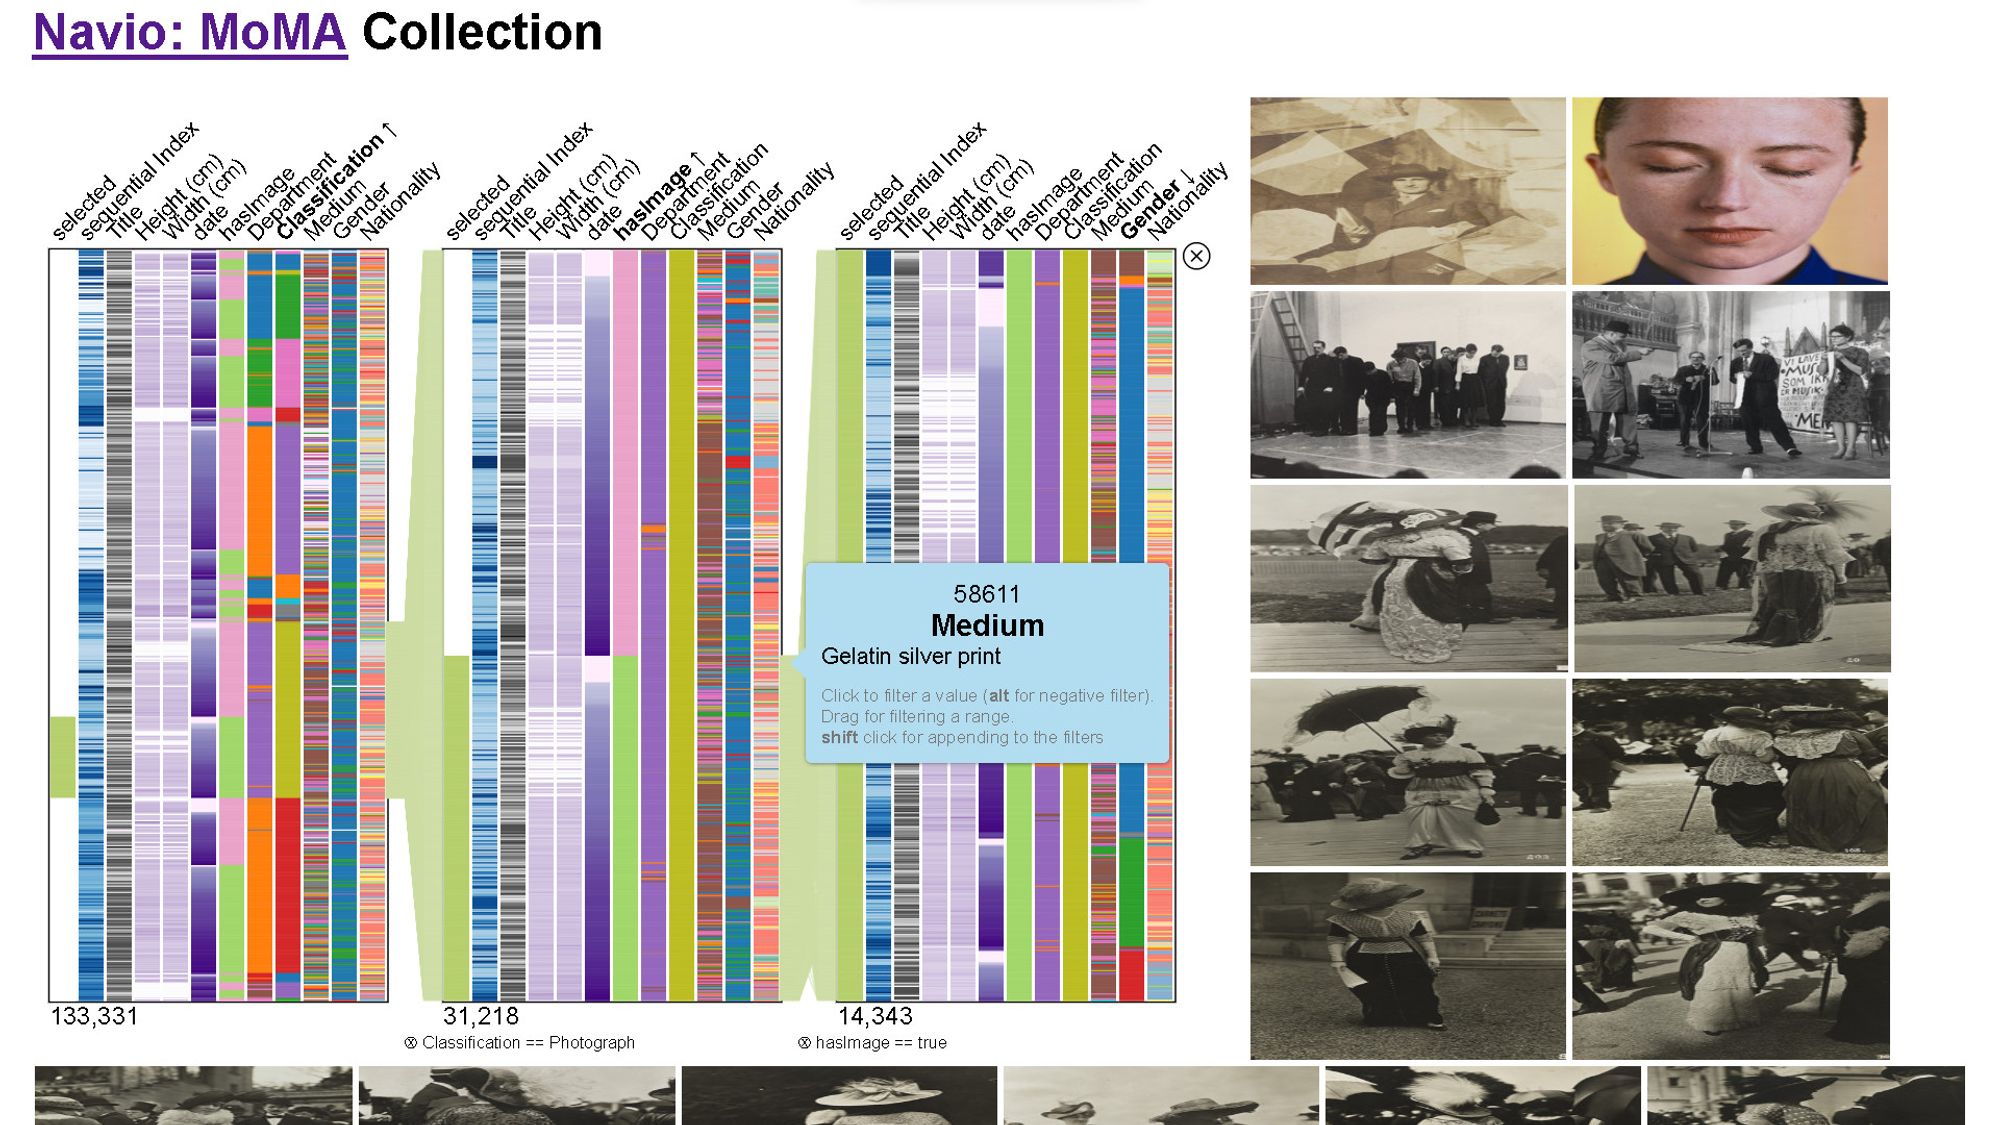
A powerful visualization widget by John Guerra that simplifies data exploration to summarize, explore, and navigate multivariate data through simple interactions: sort, filter a range, and filter by value. Demo: john-guerra.github.io/momaExplorer/github.com/john-guerra/...#VisualAnalytics