There are some midlatitude areas where a drying trend led to decreases in overnight minimums/increases in frost, but I think that was only true for smallish levels of warming and gets overwhelmed by the warming trend eventually.
Wow, those journal clubs sound vicious. I've never experienced anything like that, talking about papers here is more often focussed on what they did that was interesting. And the scientific culture here (Australian climate science) is generally kind, in my experience. I wonder if it's related?
Sea level rise isn't just dry dry dry dry dry UNDERWATER There's a long middle where flood frequency increases and coastal ecosystems are impacted slowly lose the fight to keep up with increasing water levels. For today's #DailyPaper: coastal marshes crossing SLR threshold to start drowning.
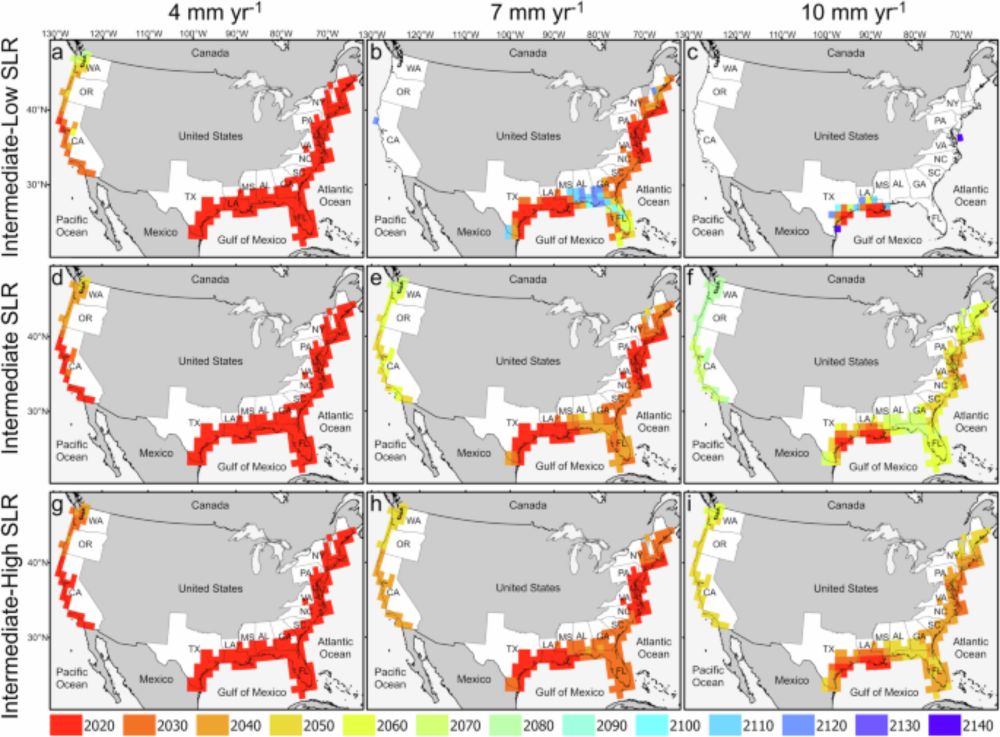
Coastal wetlands along the Gulf of Mexico and the Atlantic Coast of the United States could begin drowning within decades due to rising sea levels, according to a study of future sea-level rise scenar...
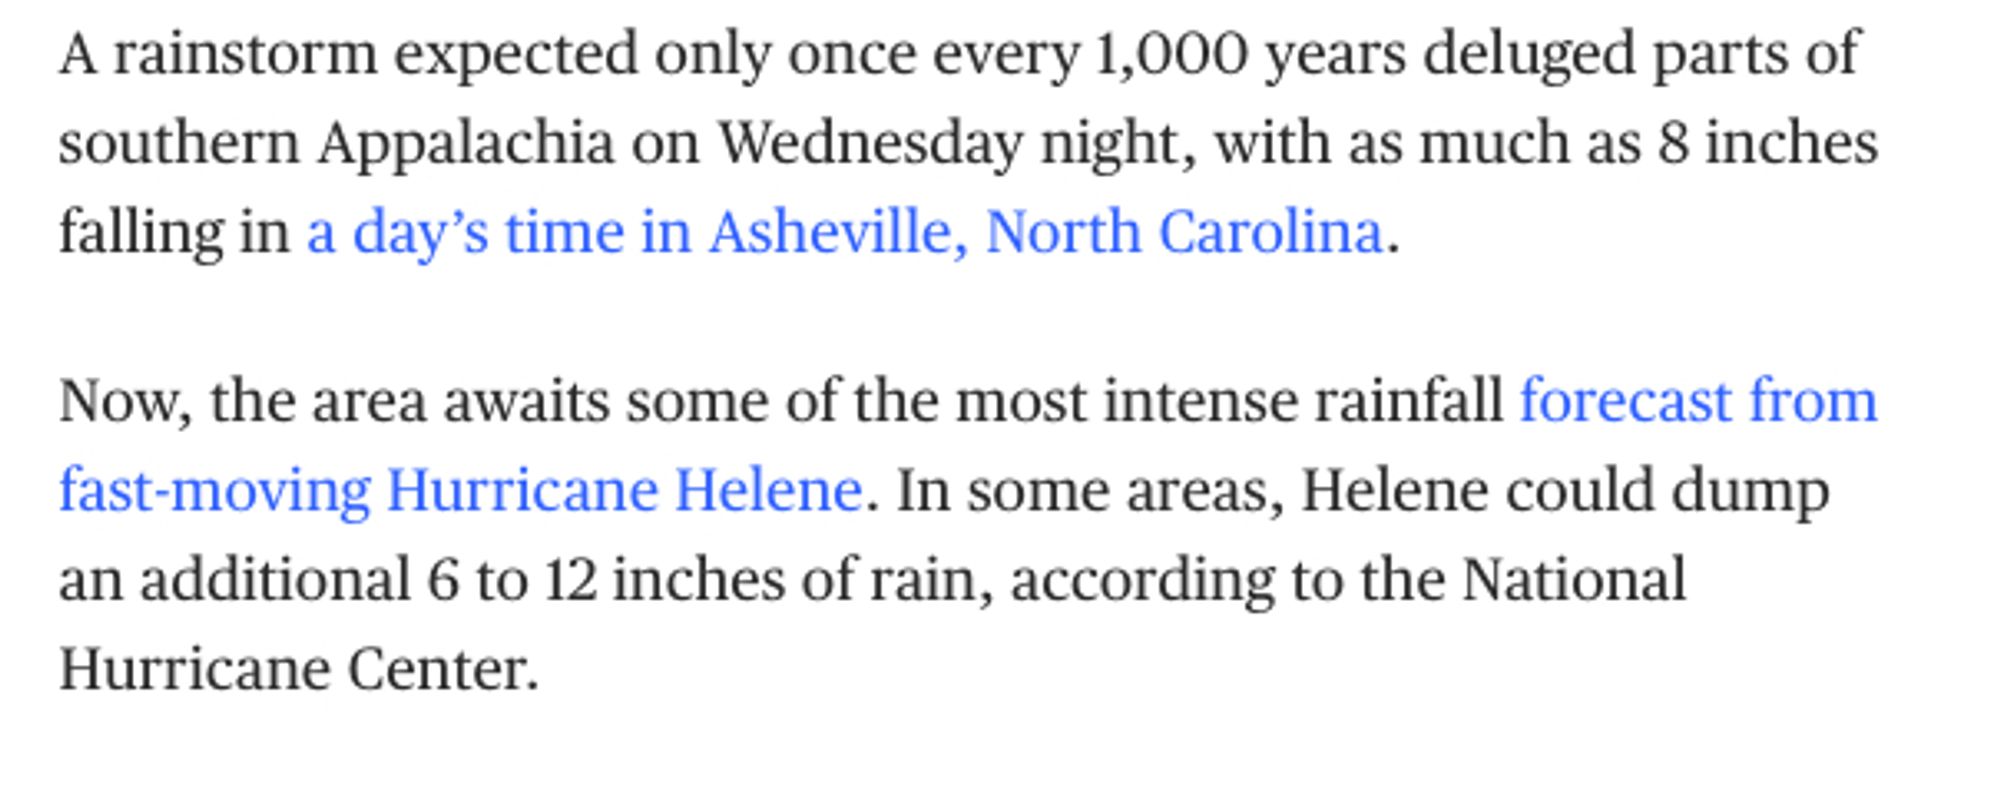
Researchers in Asheville, North Carolina have warned for years that rainfall is becoming increasingly dangerous. But experiencing it firsthand with Hurricane Helene is something totally different.
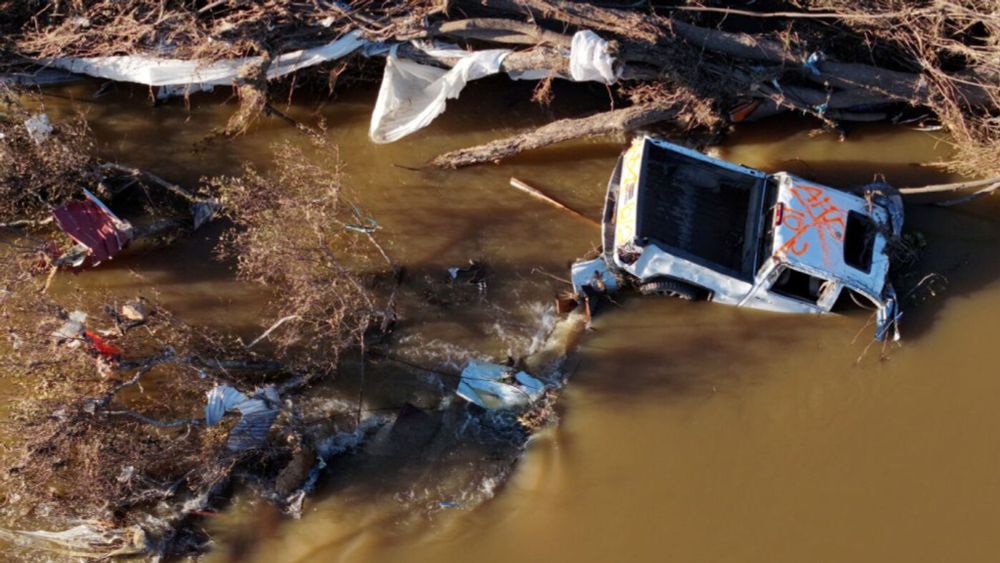
Researchers in Asheville, North Carolina have warned for years that rainfall is becoming increasingly dangerous. But experiencing it firsthand with Hurricane Helene is something totally different.
The Australian Meteorological and Oceanographic Organisation is holding a public event on heat + health on the 9th Oct - come if you want to learn more about how heat + humidity affects the human body, and what conditions we can expect for the future events.humanitix.com/the-climate-...
Get Tickets on Humanitix - The Climate of the Future: Can we handle the heat? hosted by AMOS. Susan Wakil Health Building, The University of Sydney (in-person), Western Ave, Camperdown NSW 2050, Aust...
We're seeing news of 1 in a 1000 year rainfall events, and of rivers reaching record height from Helene For a while, something has worried me about estimates of flood and precipitation return levels in the South and Southeast US, and (for once) it's not climate change. 1/

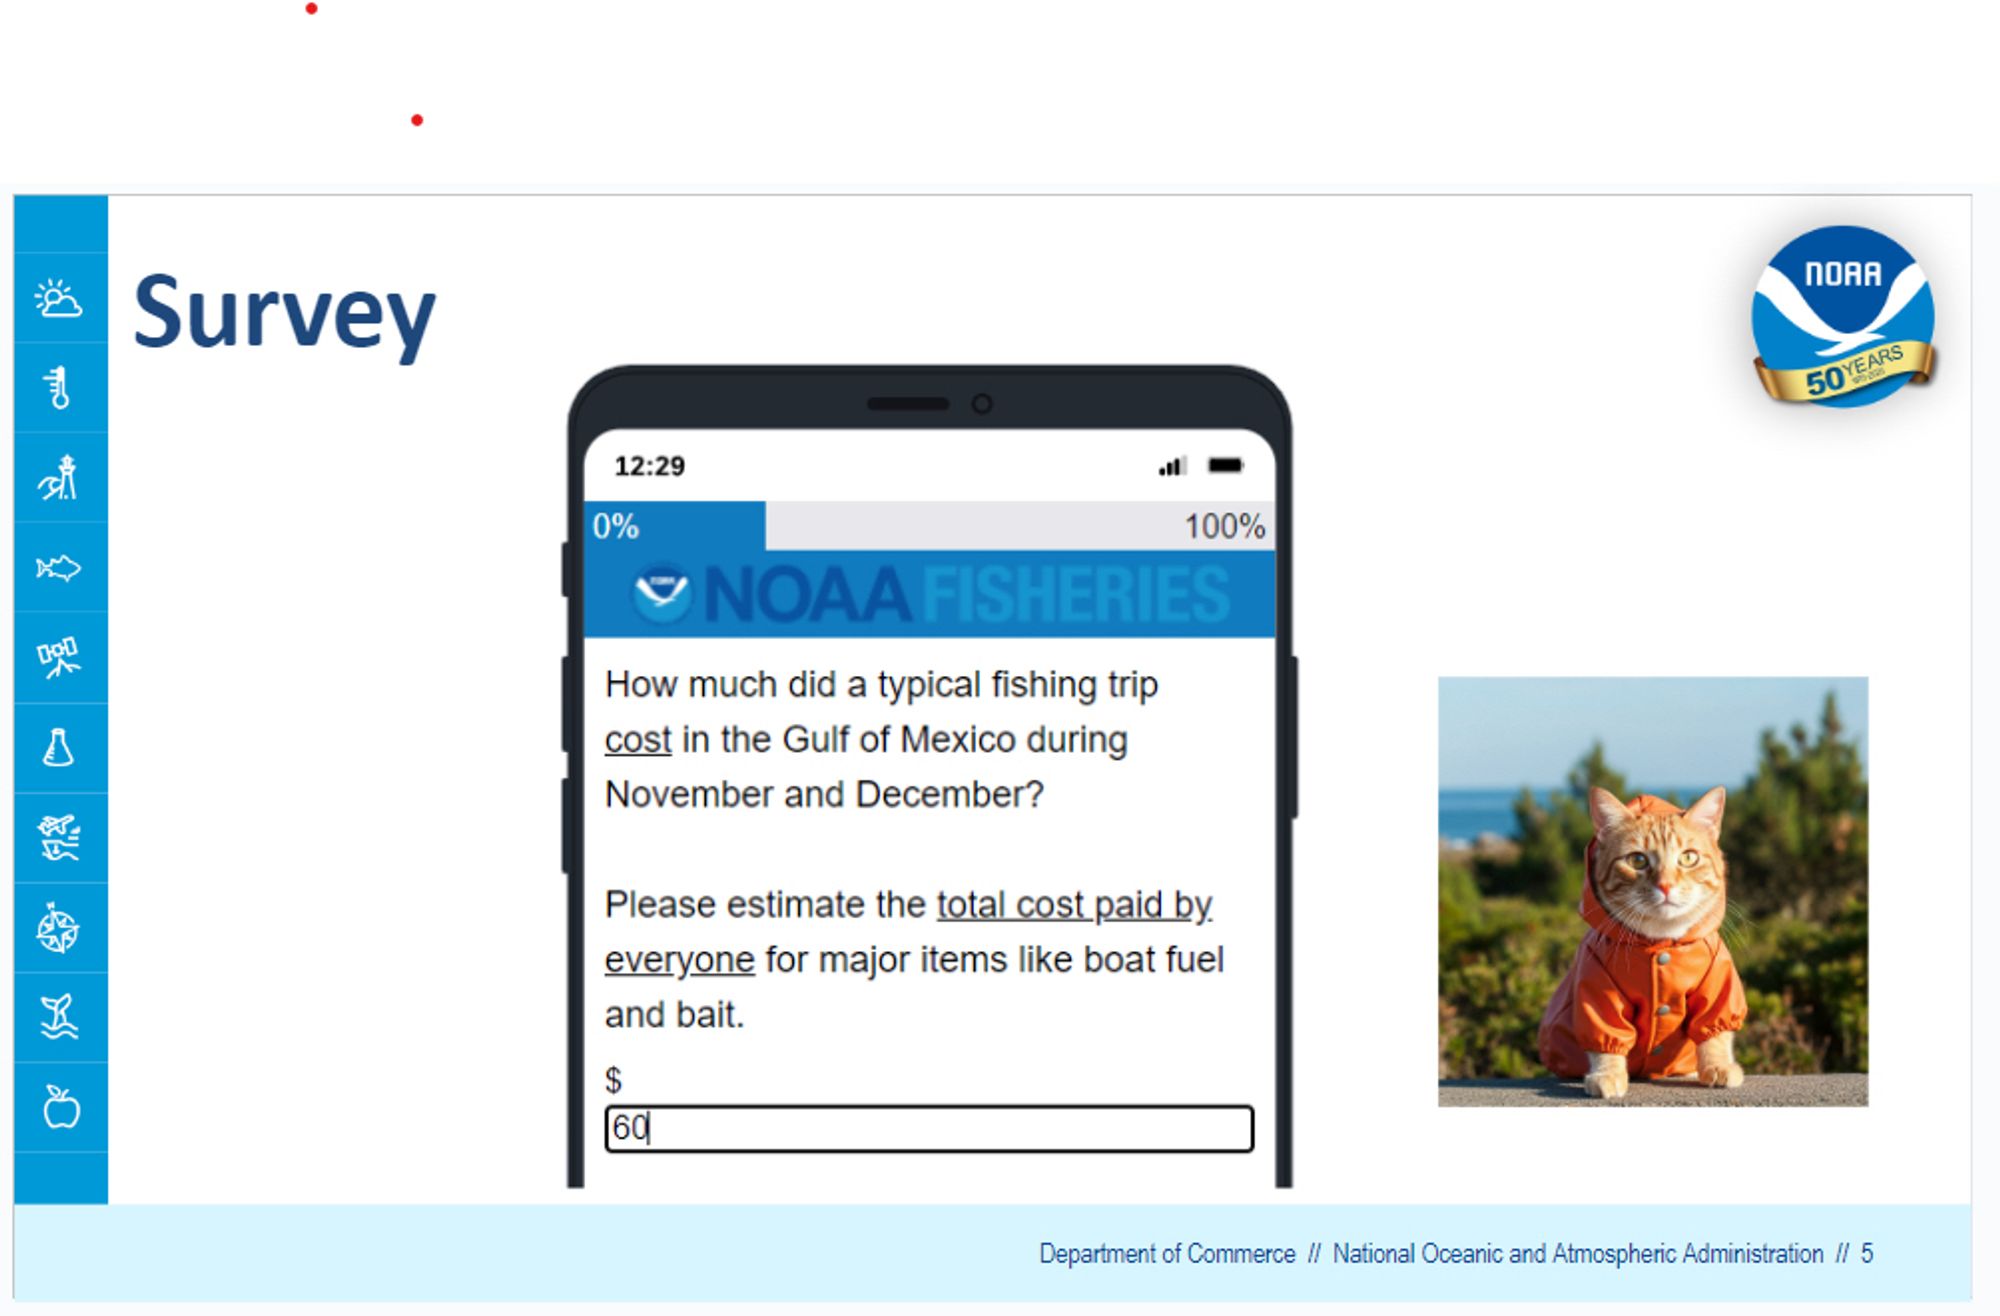
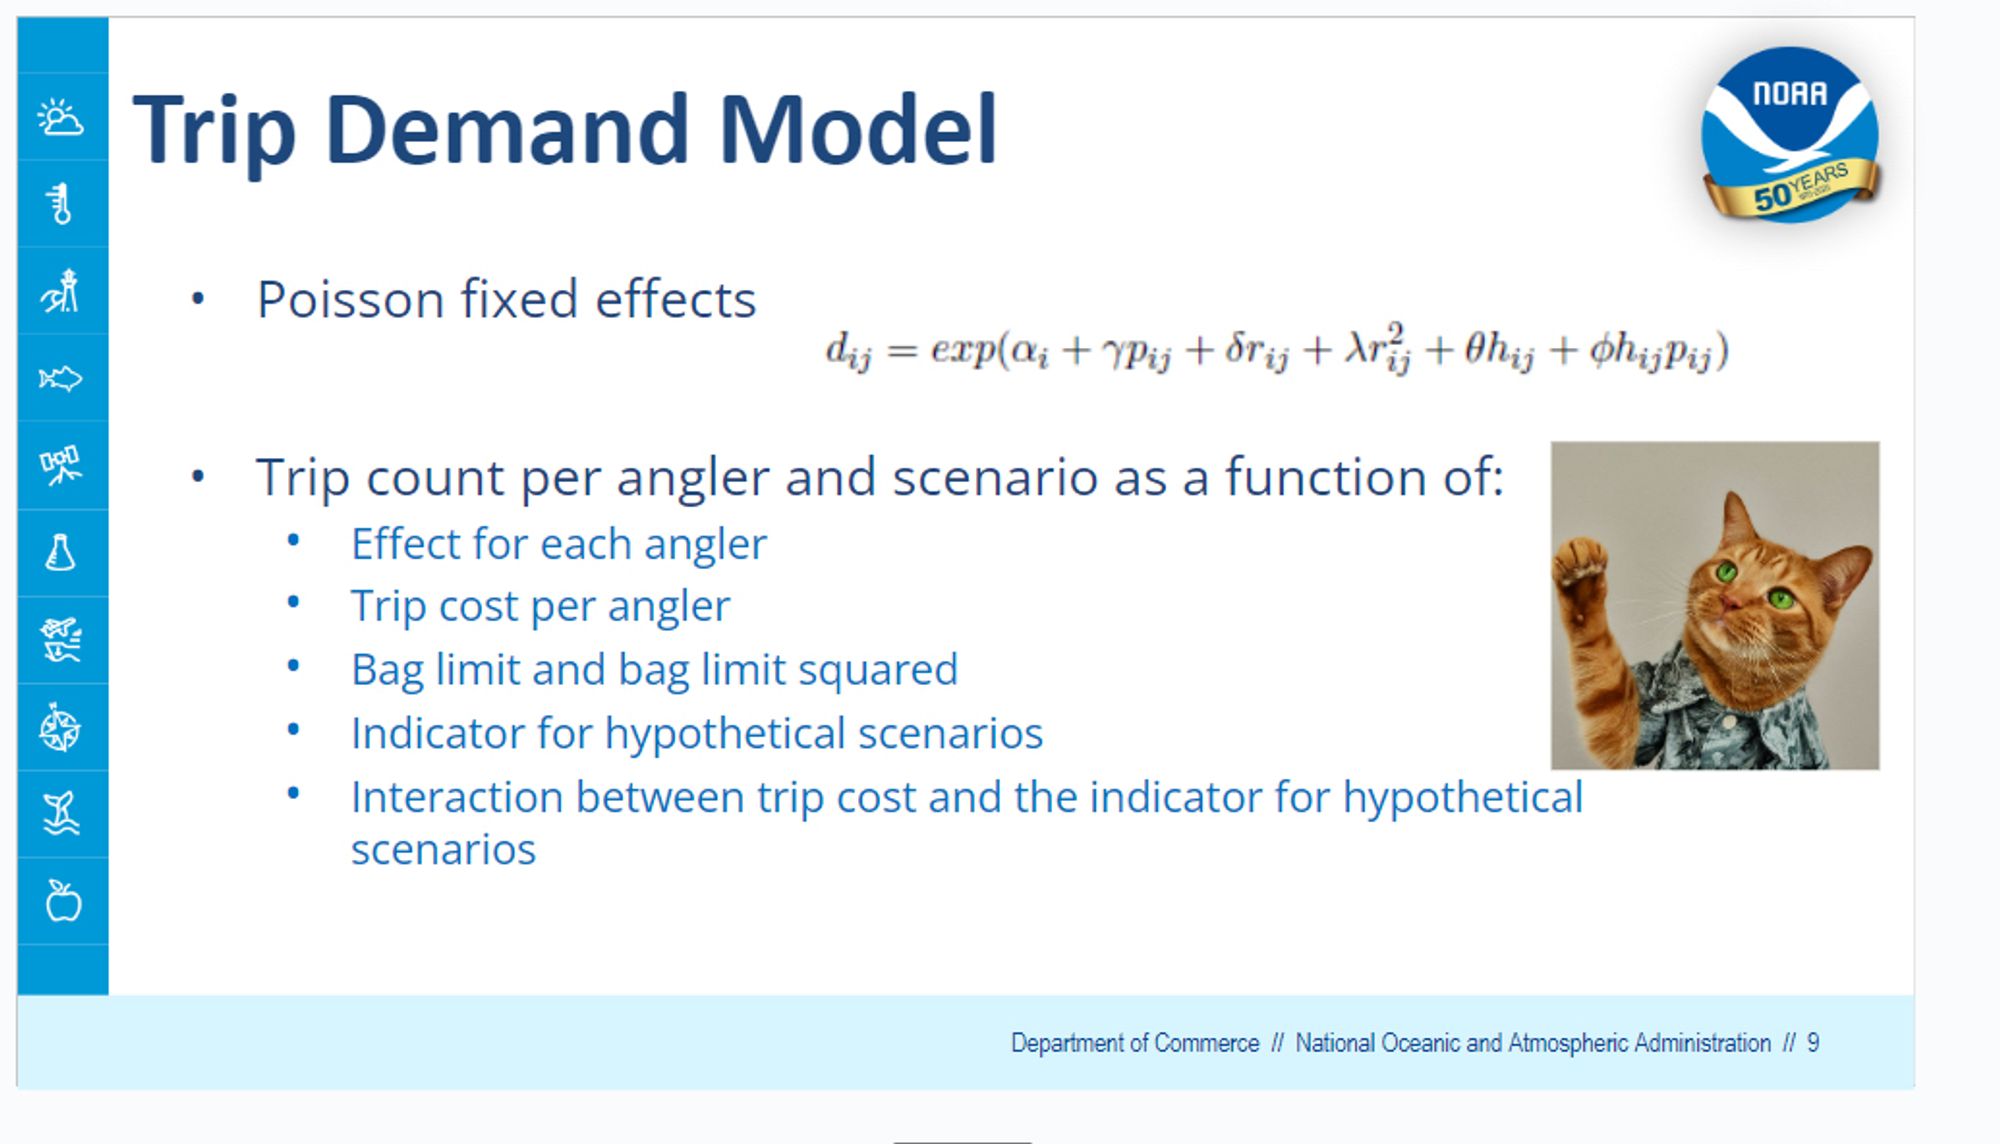
I watched another member of my department present today and he started by saying “by the way if you find this stuff boring, there is a picture of a cat wearing something on every slide but only one is a real cat so you can look at those instead” Everyone in the room paid attention. SCHOOLED. 📈📉
I'm glad you asked, Dave - it just so happens that this popped up in my Facebook memories today. May I suggest a sequel? youtu.be/LiYZxOlCN10?...

YouTube video by Real Human Stories
How nerdy are we trying to get on Bsky? I am discovering that people fit heavy-tailed distributions (e.g. Gamma) to gridded datasets to estimate likelihood and return times of extreme events 😬 www.drought.gov/data-maps-to... standardized-precipitation-index-spi-nclimgrid-monthly This is risky 1/
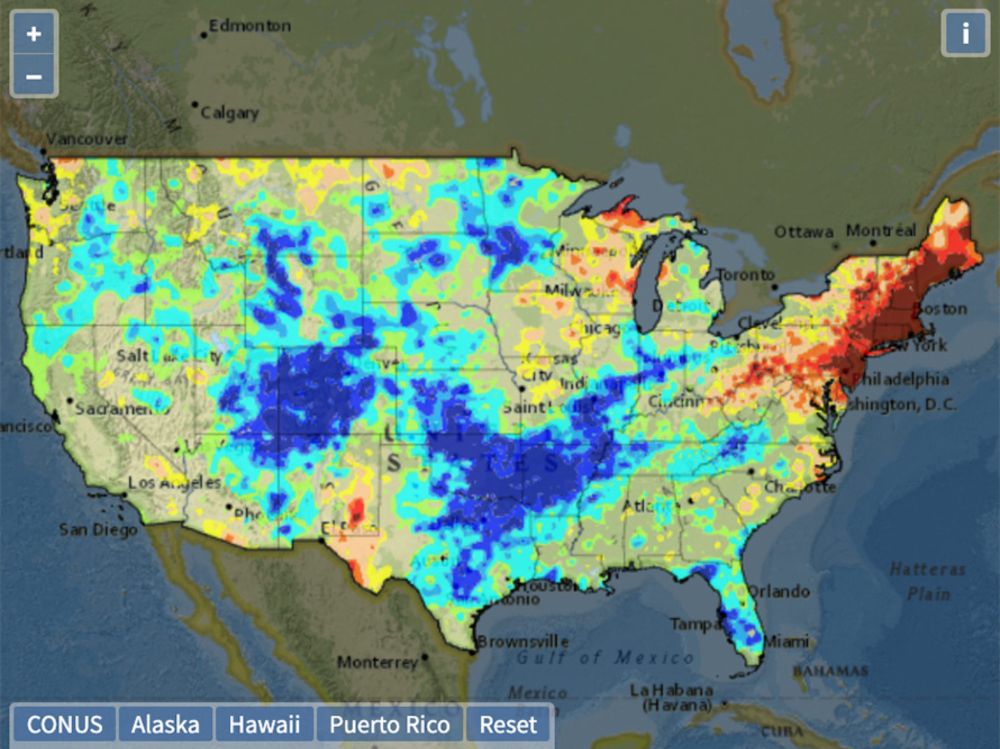
The US Gridded Standardized Precipitation Index (SPI) is derived from the nClimGrid-Monthly dataset and includes timescales of 1, 2, 3, 6, 9, 12, 24, 36, 48, 60 and 72 months.
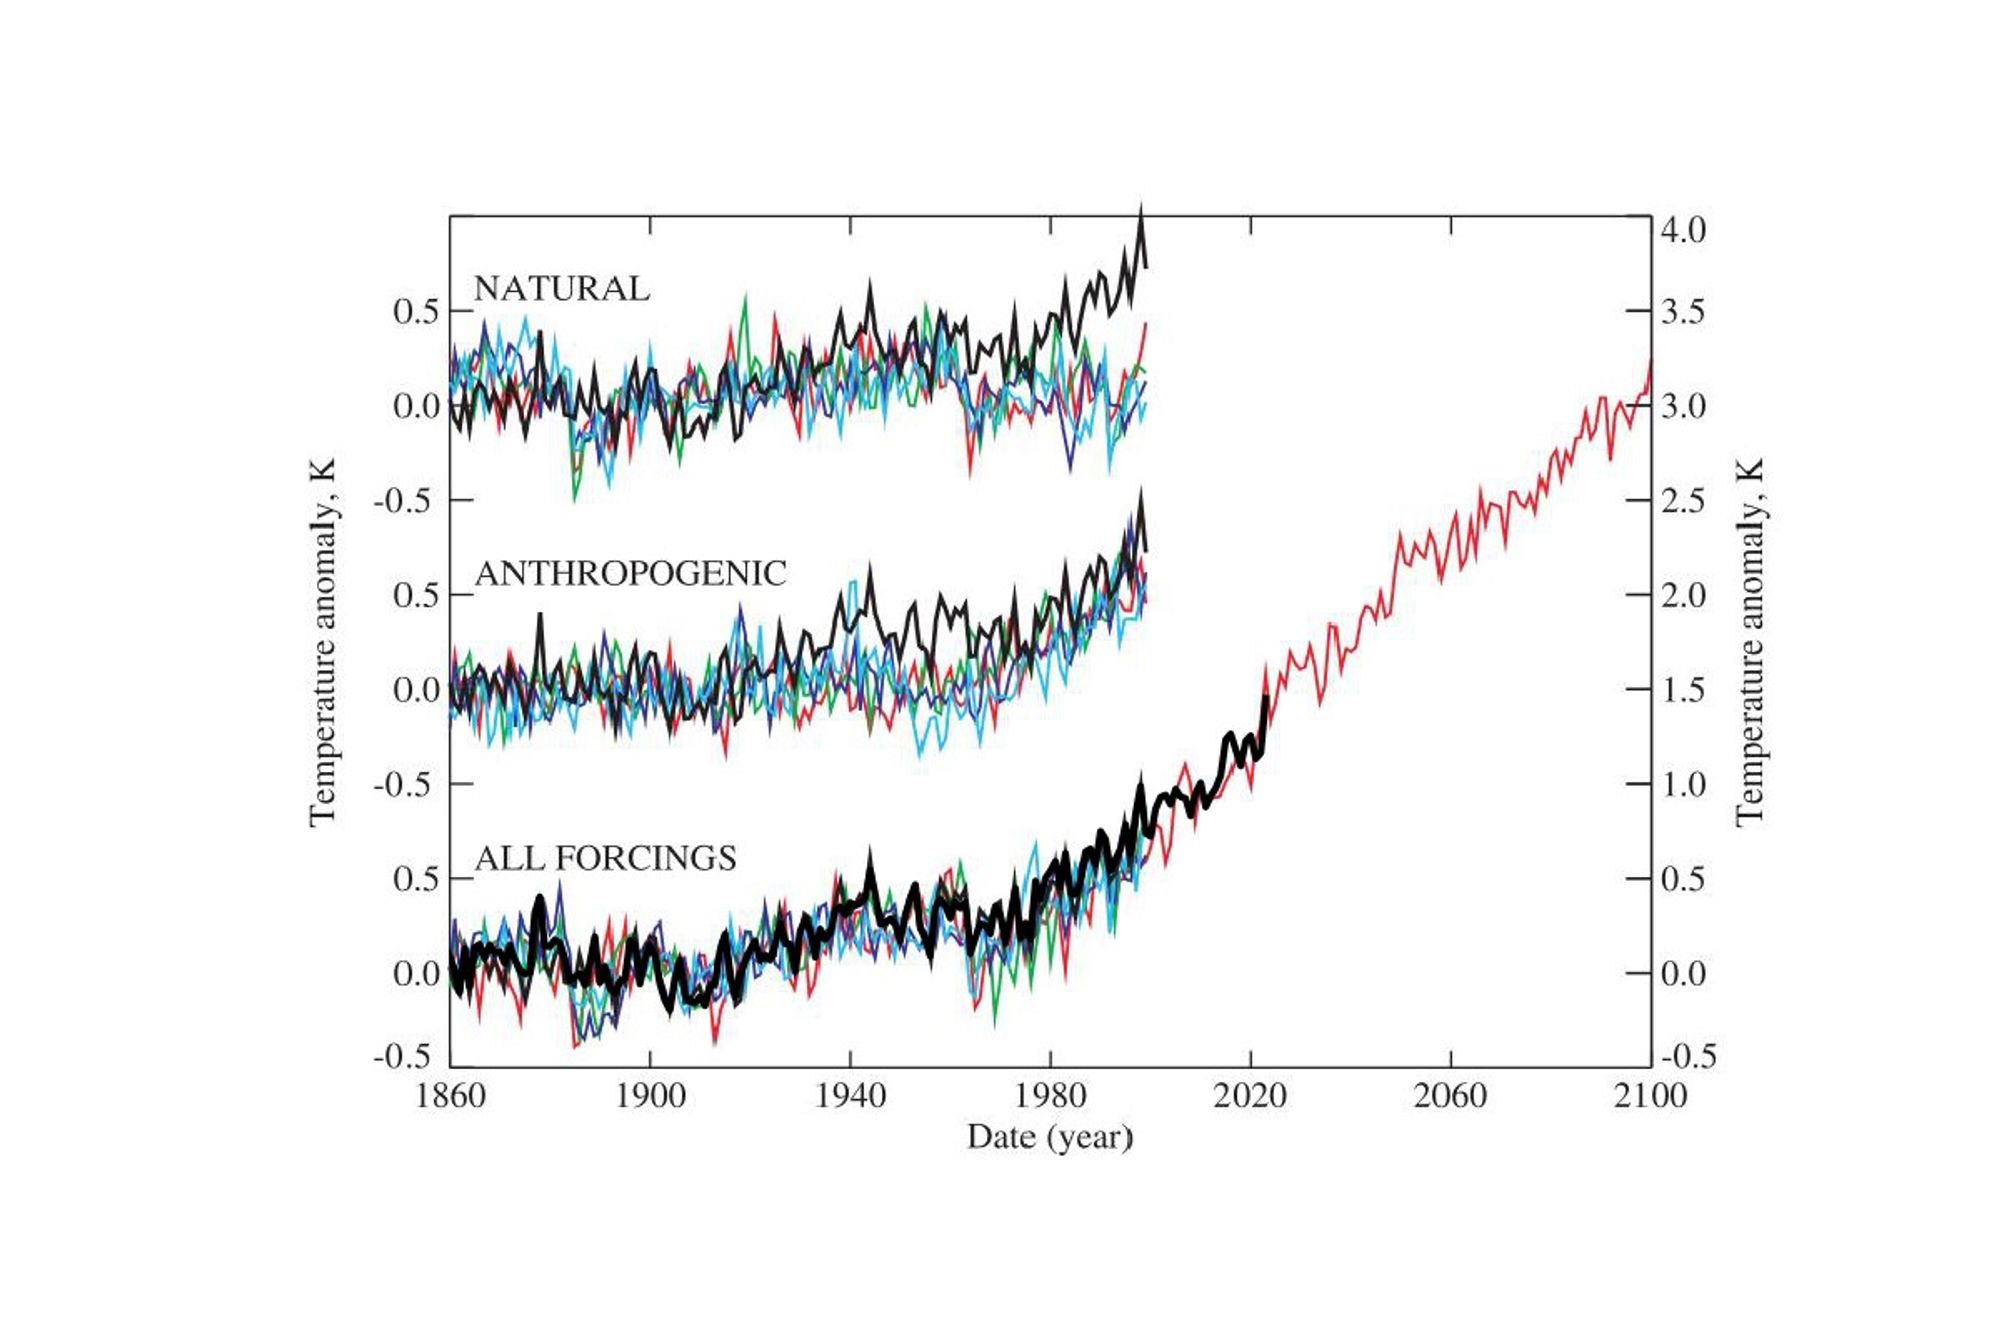
In 2000 we published a paper showing how well our climate model simulated past temperatures. We also included a future projection. Now when we compare observed temperatures to 2023 (in black) with the projection (red) it does remarkably well! Thanks to @garethsjones.bsky.social who updated the plot.