AG
Andrea Gokus
@agokus.bsky.social
McDonnell PostDoc Fellow at WashU in Saint Louis, working on active galactic nuclei.
Enthusiastic about music 🎶 , space 🚀, dogs🐕 and saving planet Earth 🌎.
32 followers45 following27 posts
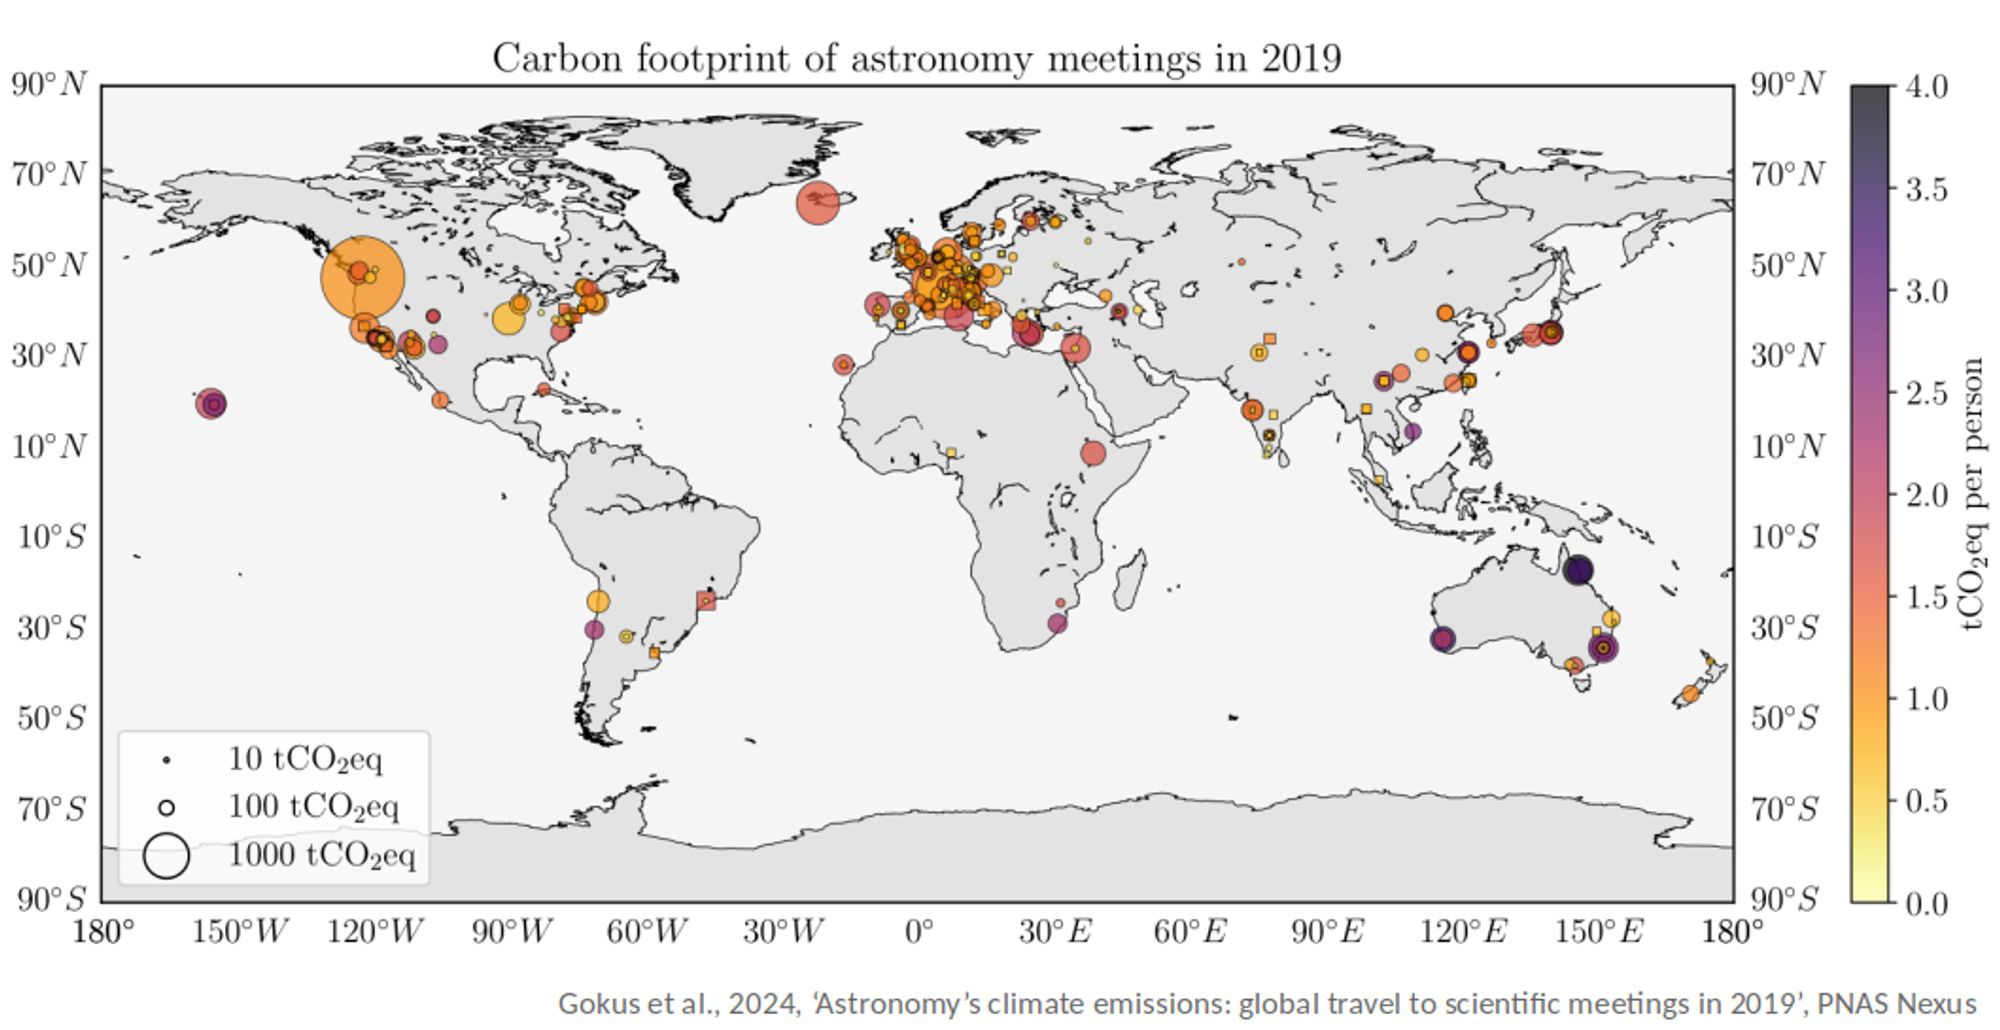
#Astronomy is a very internationally collaborative field, but as can be seen from the map, the majority of meetings tend to take place in Europe and North America. Meetings in remote places cause more flights → more emissions. Our estimation is at least 42,500 tCO2e in total.
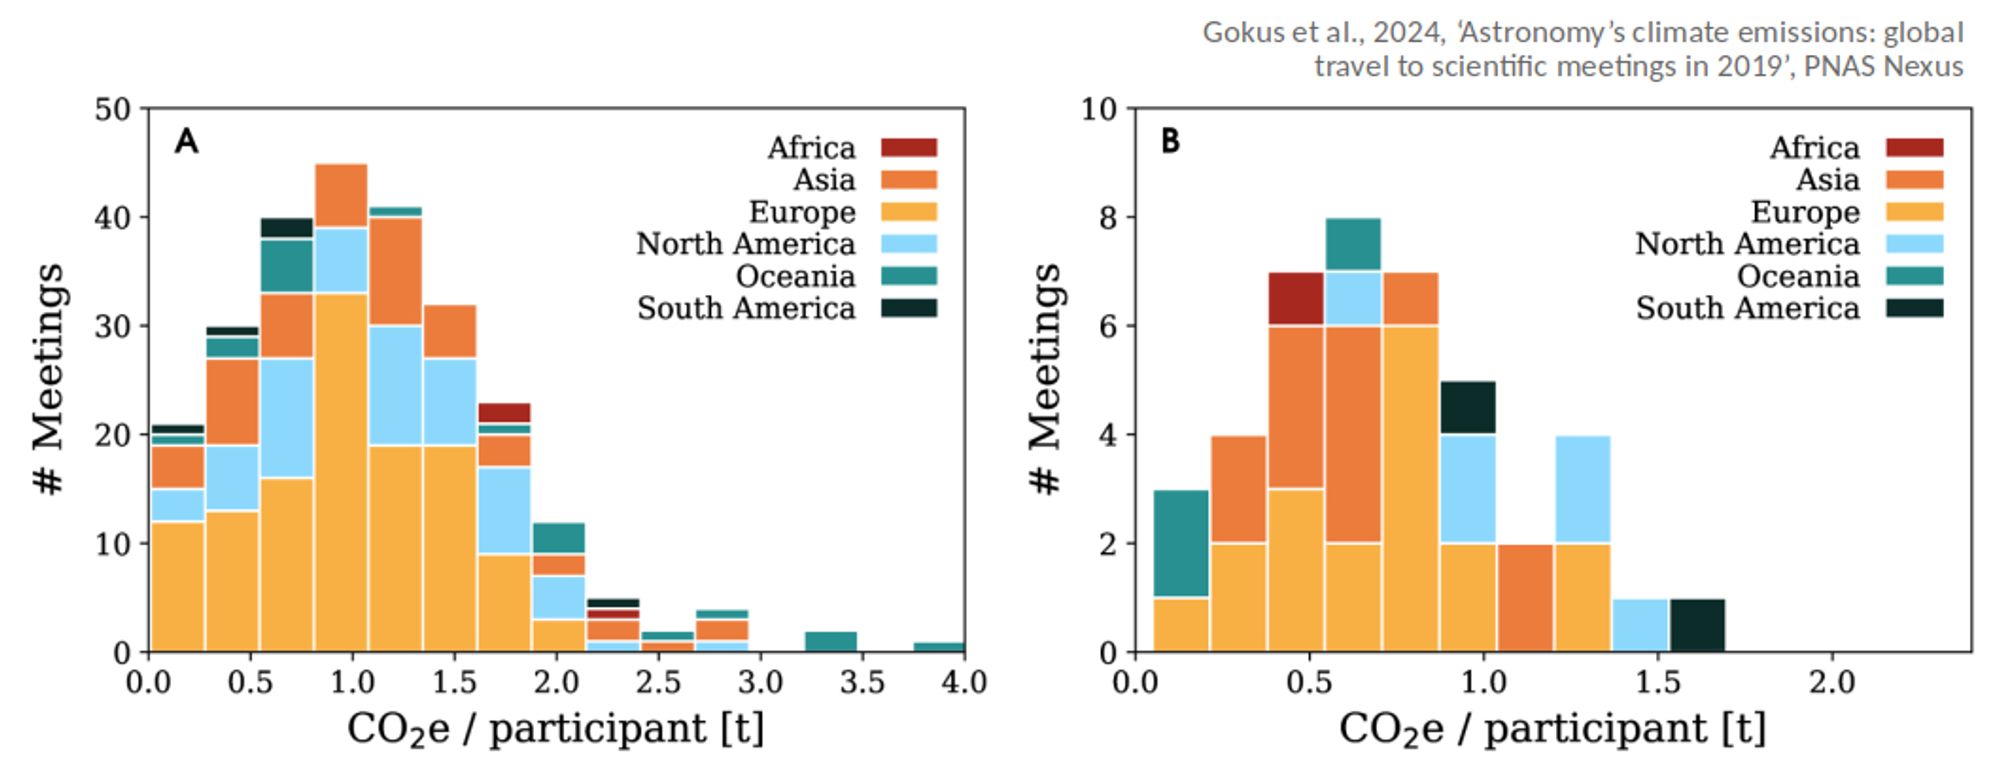
The distributions of the average CO2-equivalent emissions/person/meeting, here split for conferences and schools (since they pursue different goals for participation), show how widespread travel-related emissions are, depending on the meeting.
AG
Andrea Gokus
@agokus.bsky.social
McDonnell PostDoc Fellow at WashU in Saint Louis, working on active galactic nuclei.
Enthusiastic about music 🎶 , space 🚀, dogs🐕 and saving planet Earth 🌎.
32 followers45 following27 posts