
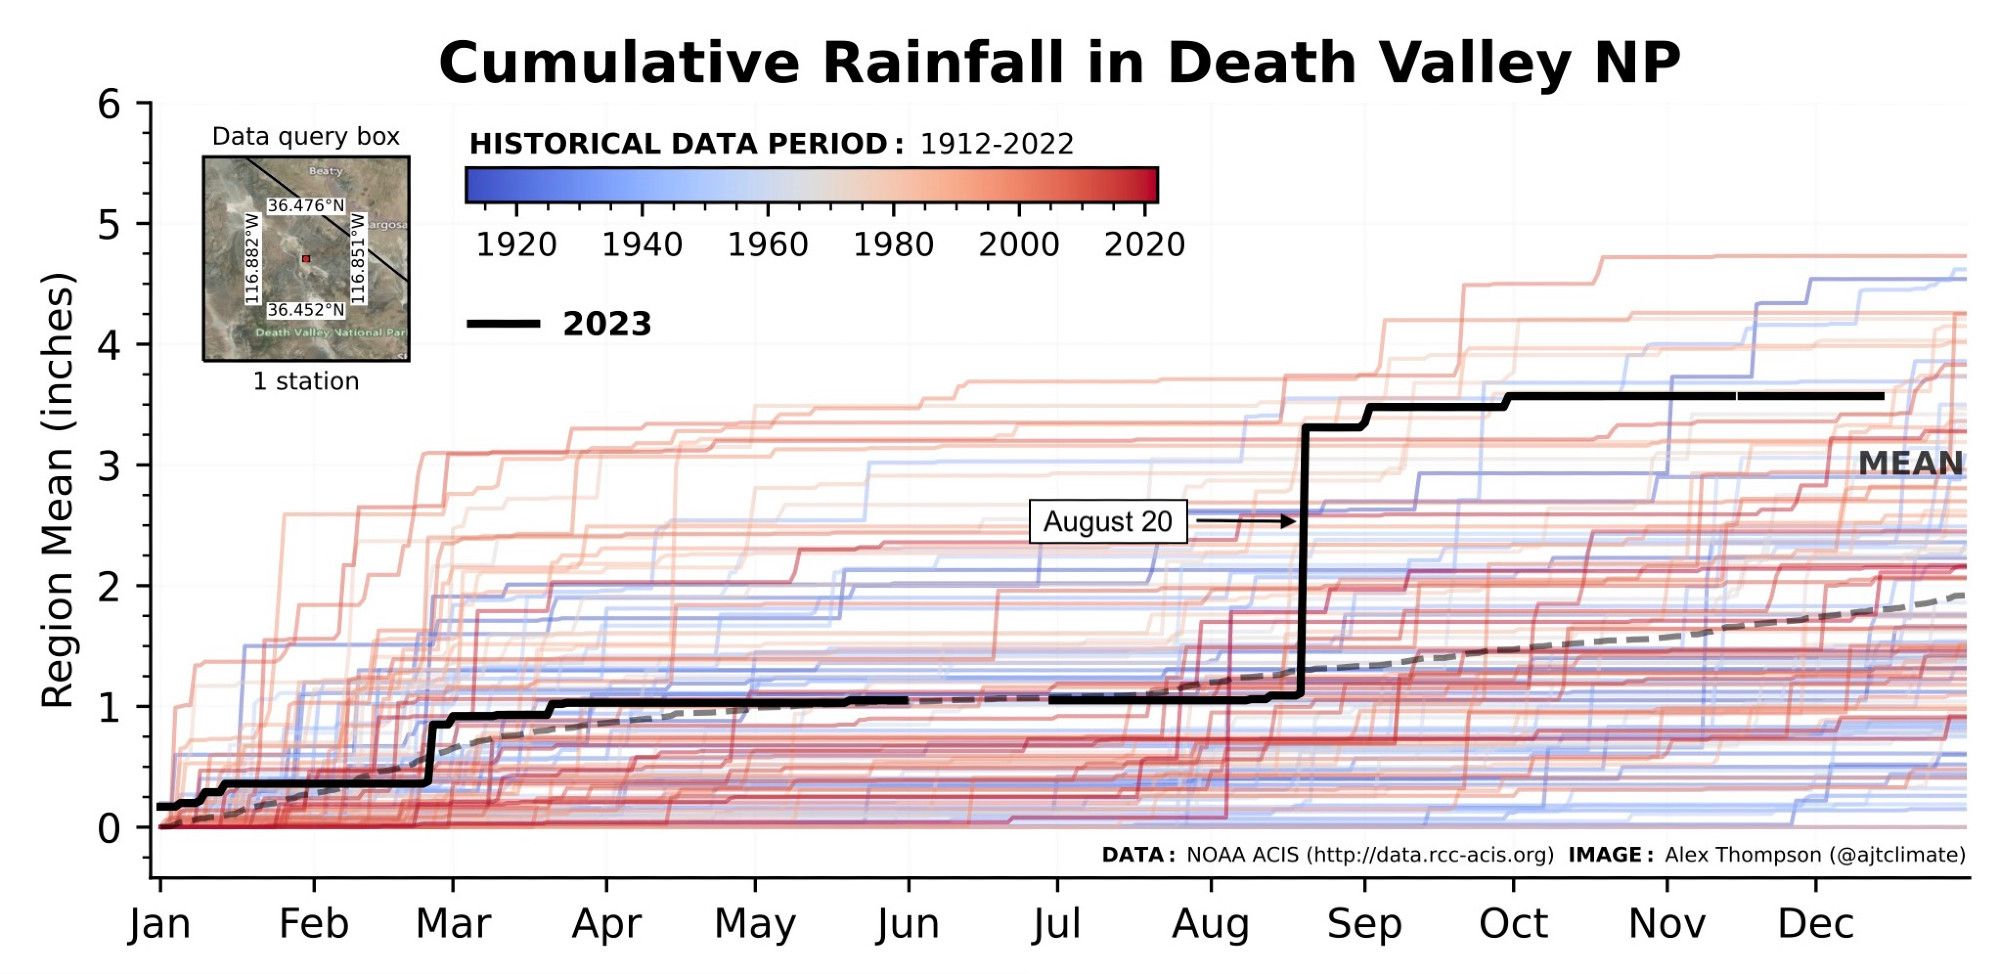
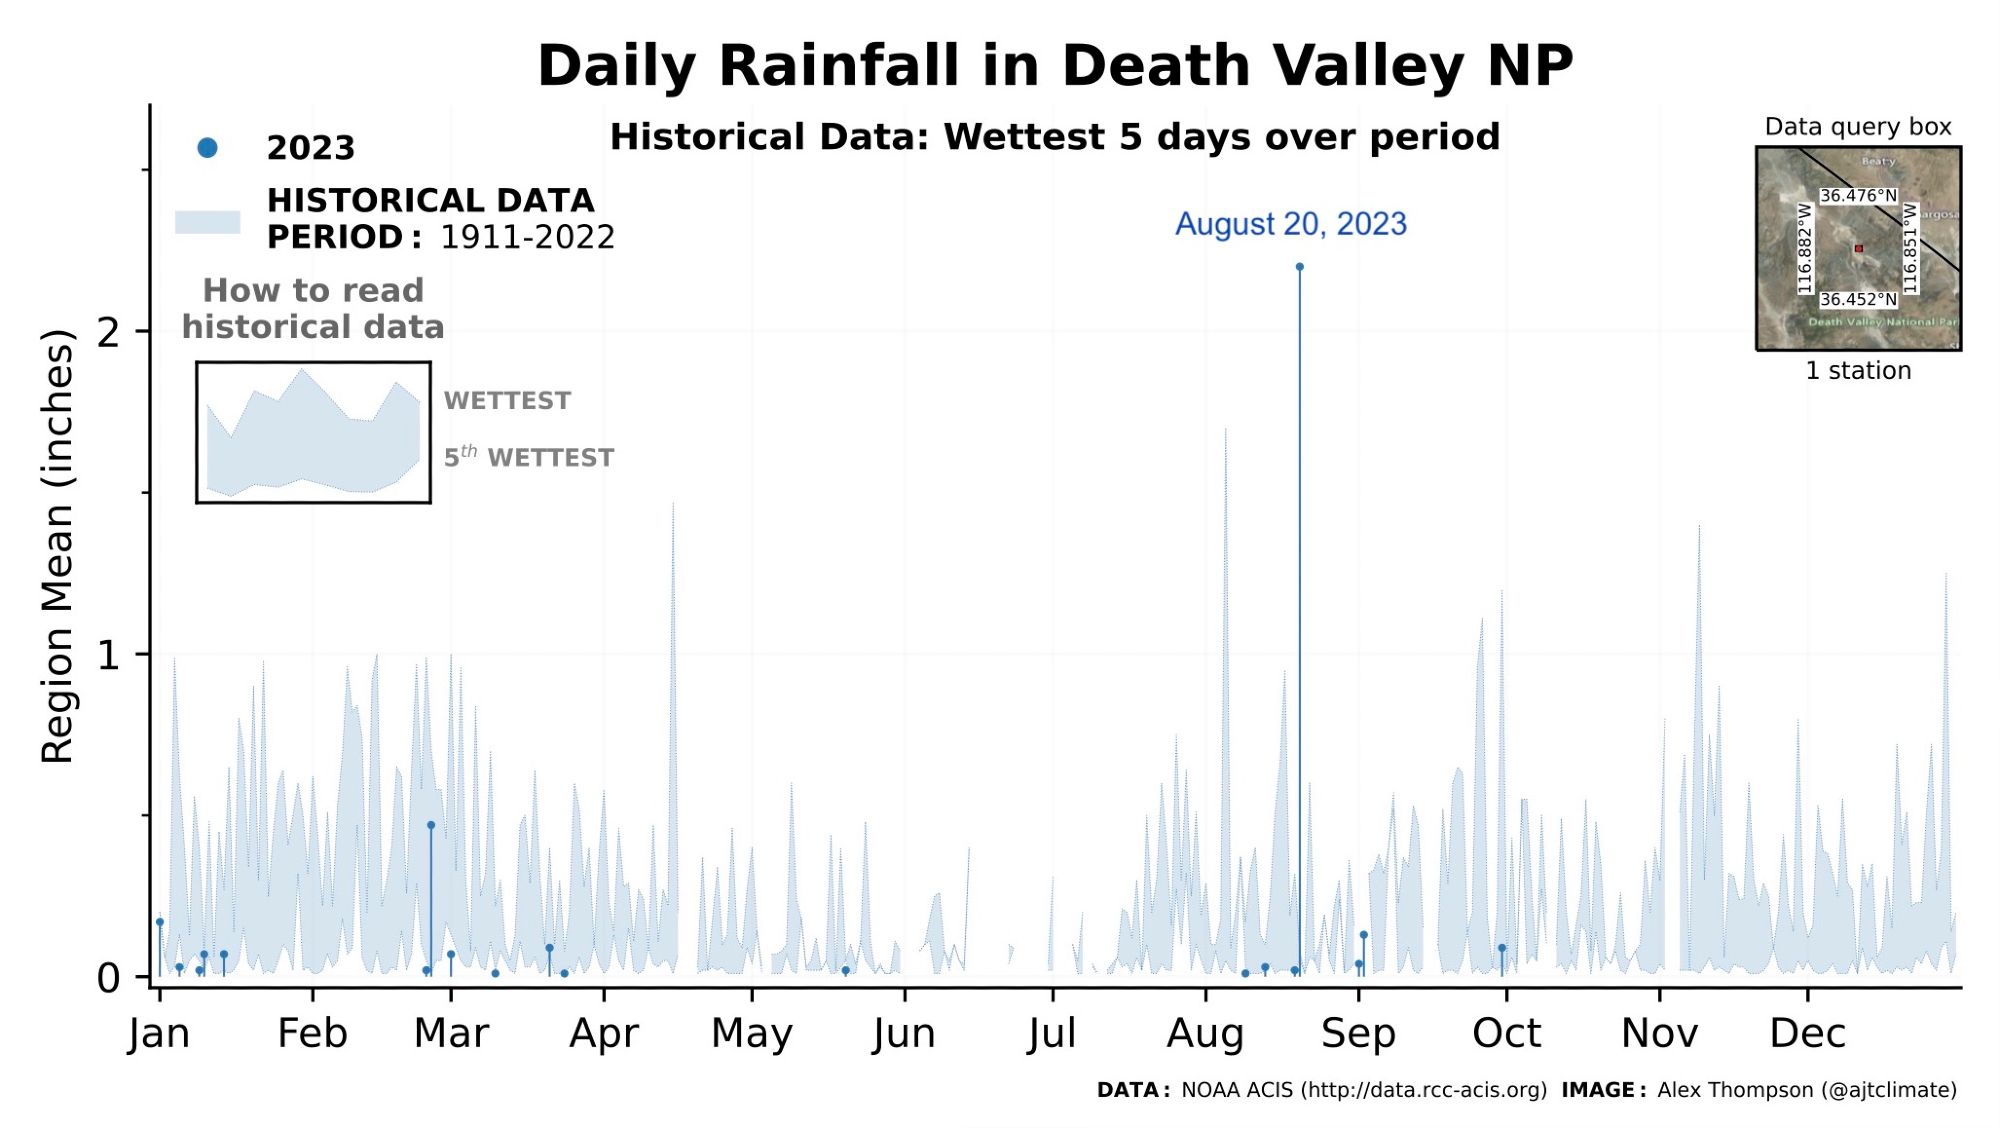
The last ClimateDataVisualizer example for AGU is the August 20, 2023 rainfall event in Death Valley NP from remnants of Hurricane Hilary. This event was the single highest recorded day since 1912 and accounted for an entire year's worth of 🌧️ in a single day
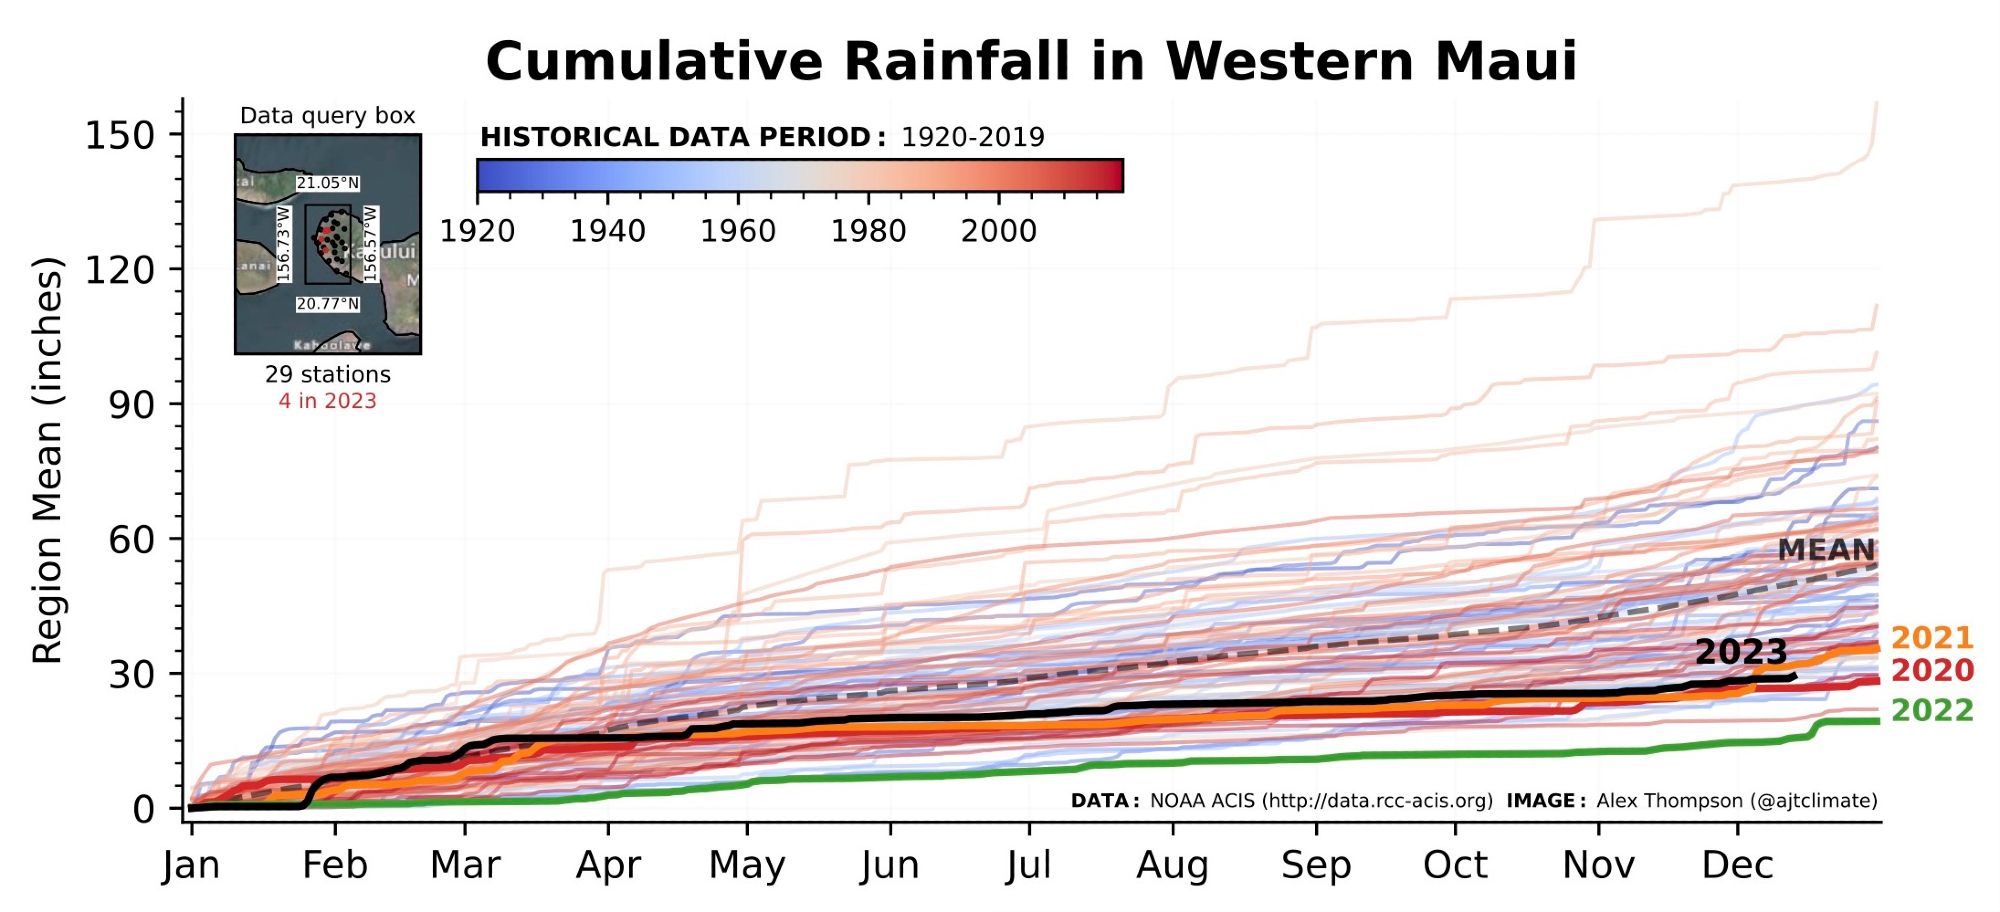
Today’s ClimateDataVisualizer example for AGU is annual rainfall for Western Maui in the years preceding 2023’s devastating wildfire. Some of the lowest annual rainfall totals since 1920 occurred in the last few years, drying out the region and priming it for a severe wildfire.
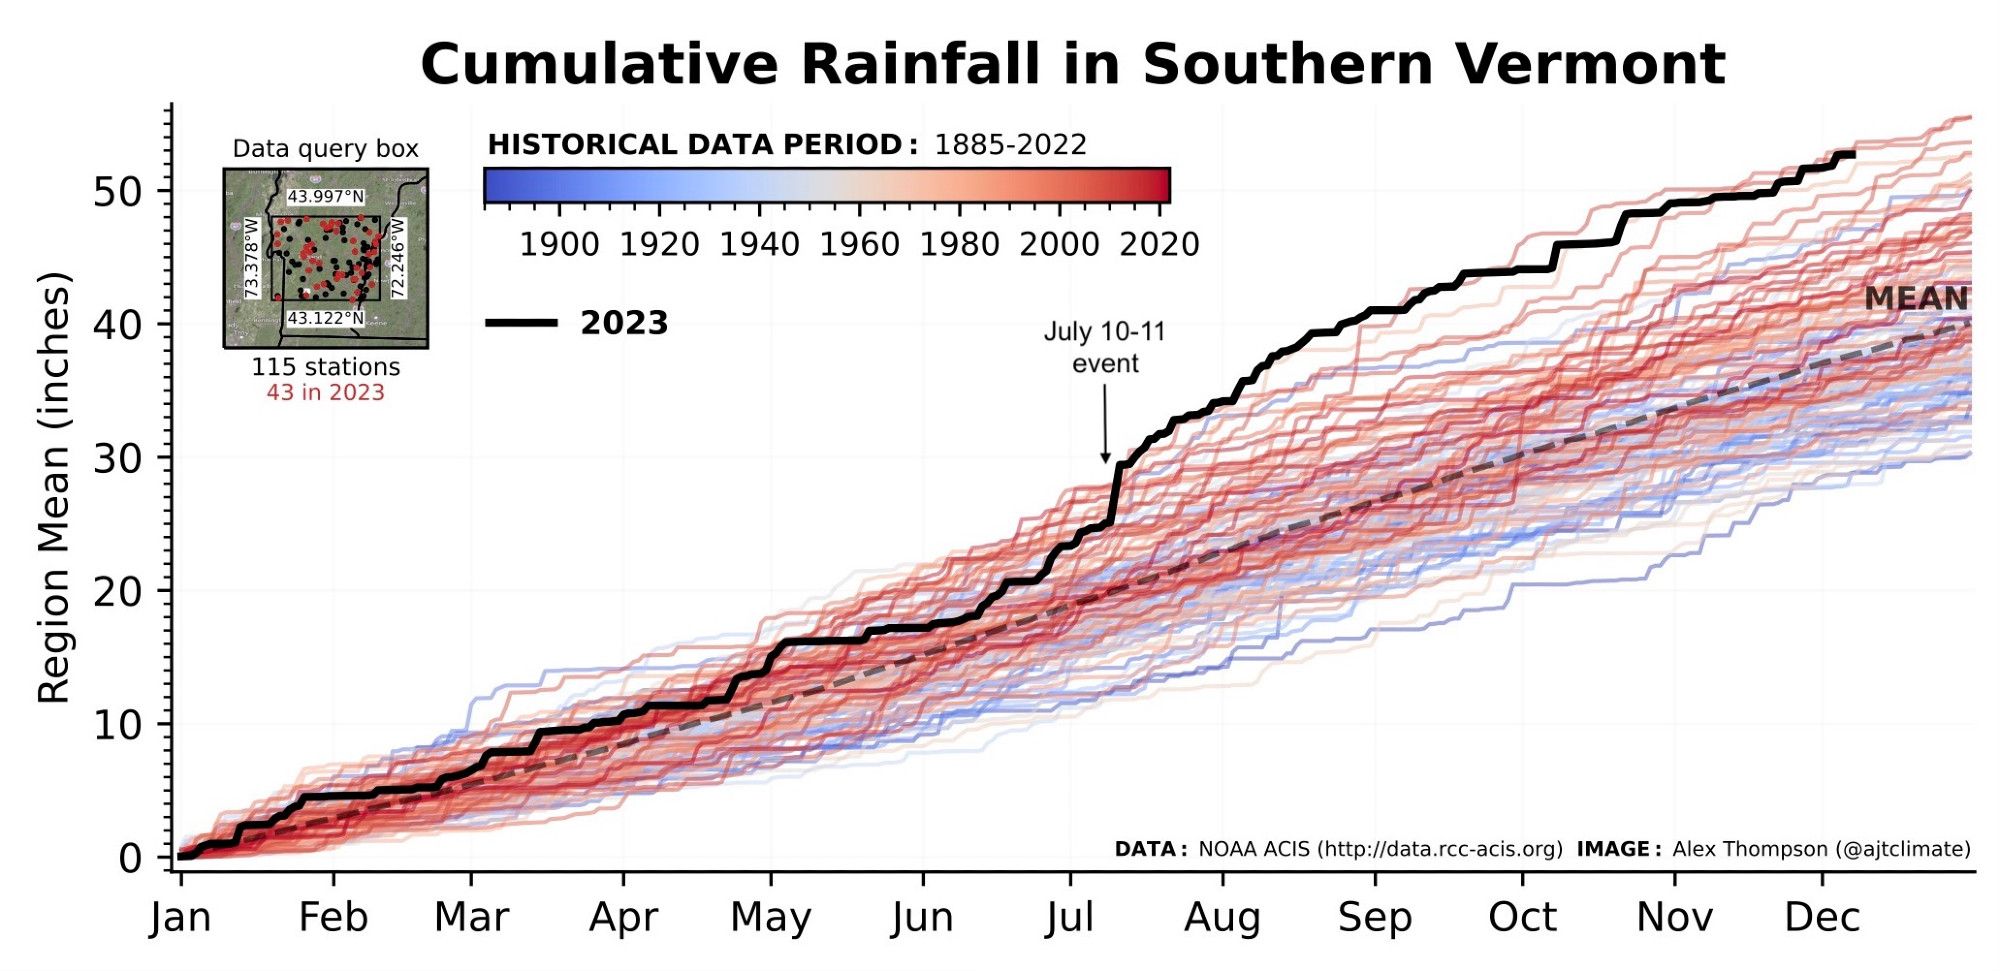
Today’s ClimateDataVisualizer example for AGU is the near-record 2023 cumulative rainfall year in Southern Vermont, which includes an extreme rainfall event on July 10-11. The lines are colored by year and show that as the climate warms, total annual rainfall tends to increase.
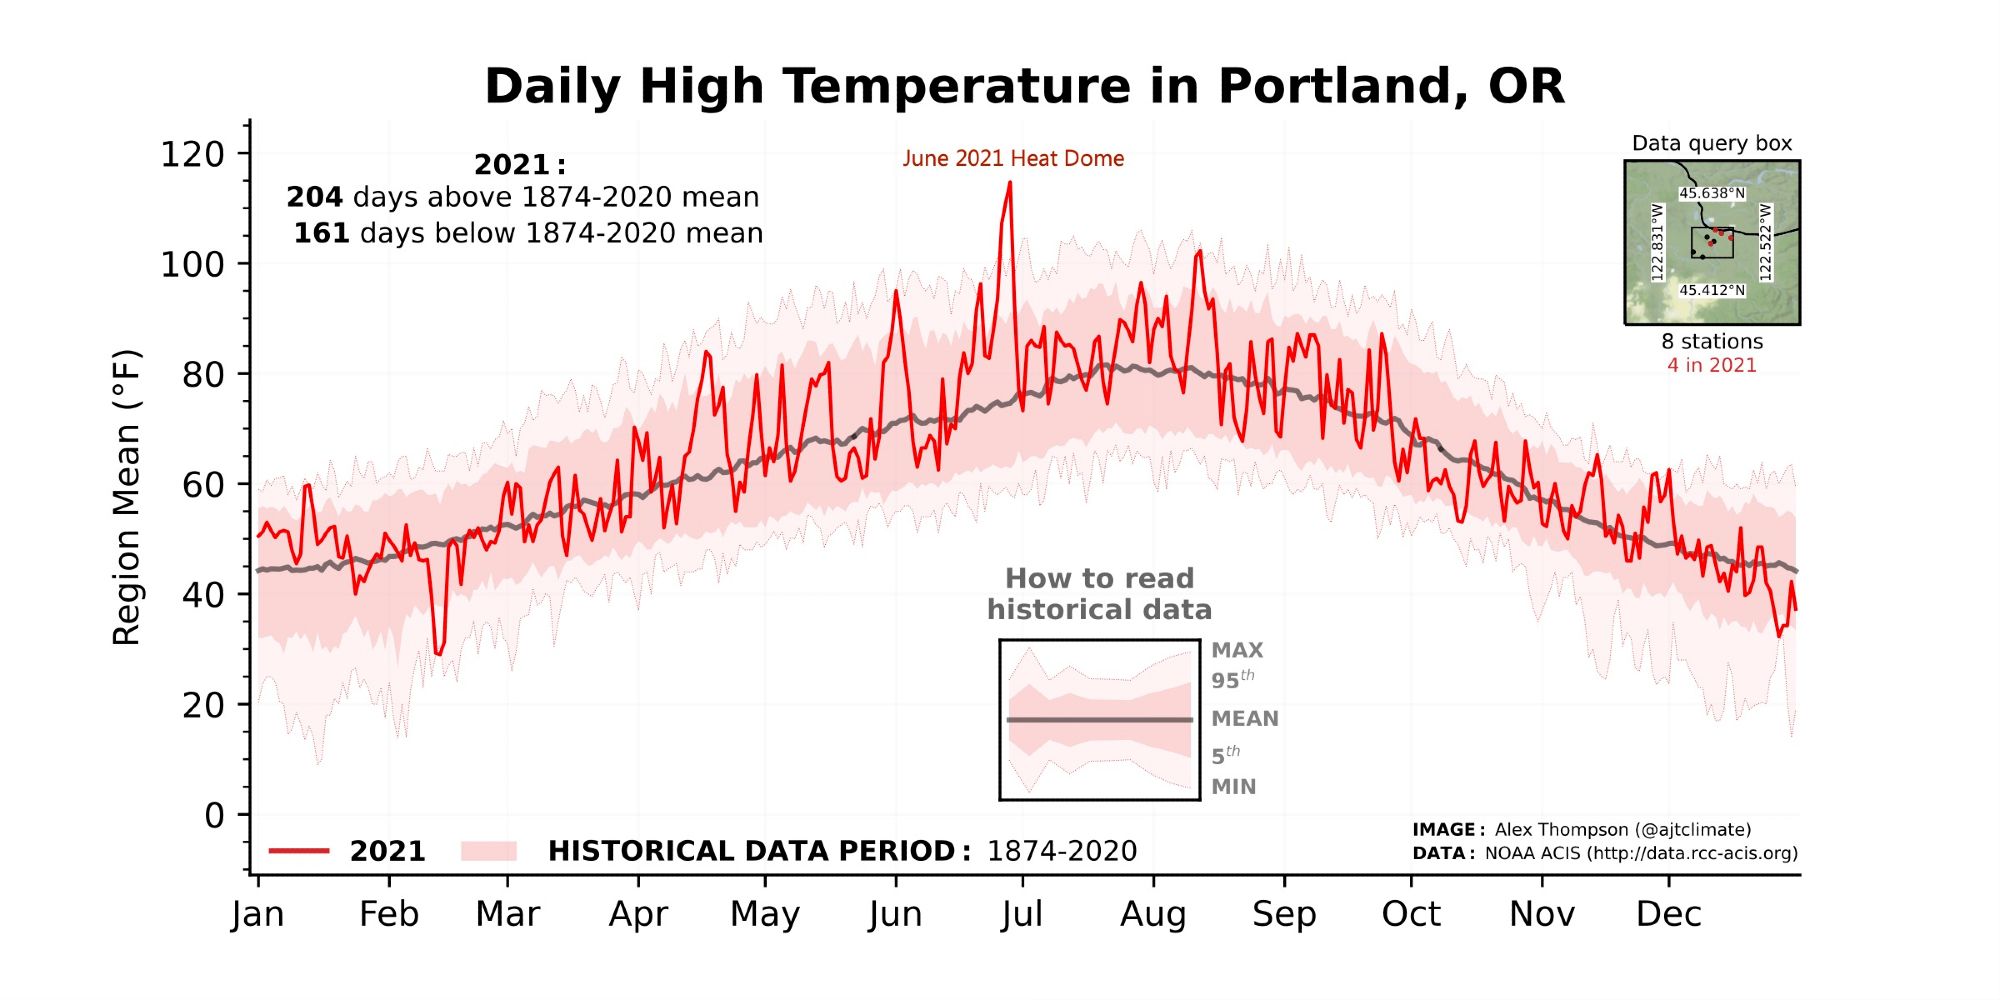
Today’s ClimateDataVizualizer example for AGU is the 2021 Pacific NW heat dome as shown in Portland, OR. NOAA ACIS observations show daily high temps on June 26-28, 2021 up to 9°F higher than any previous day since 1874. In fact, the Portland-wide avg from 4 stations topped out at 115°F on June 28!
This storm inspired me to create this web tool and I am also excited to share that I will be presenting a poster at the virtual AGU session in January on a new study of mine that analyzes the historical context of this event's rainfall! Hope to see you there! (6/6)
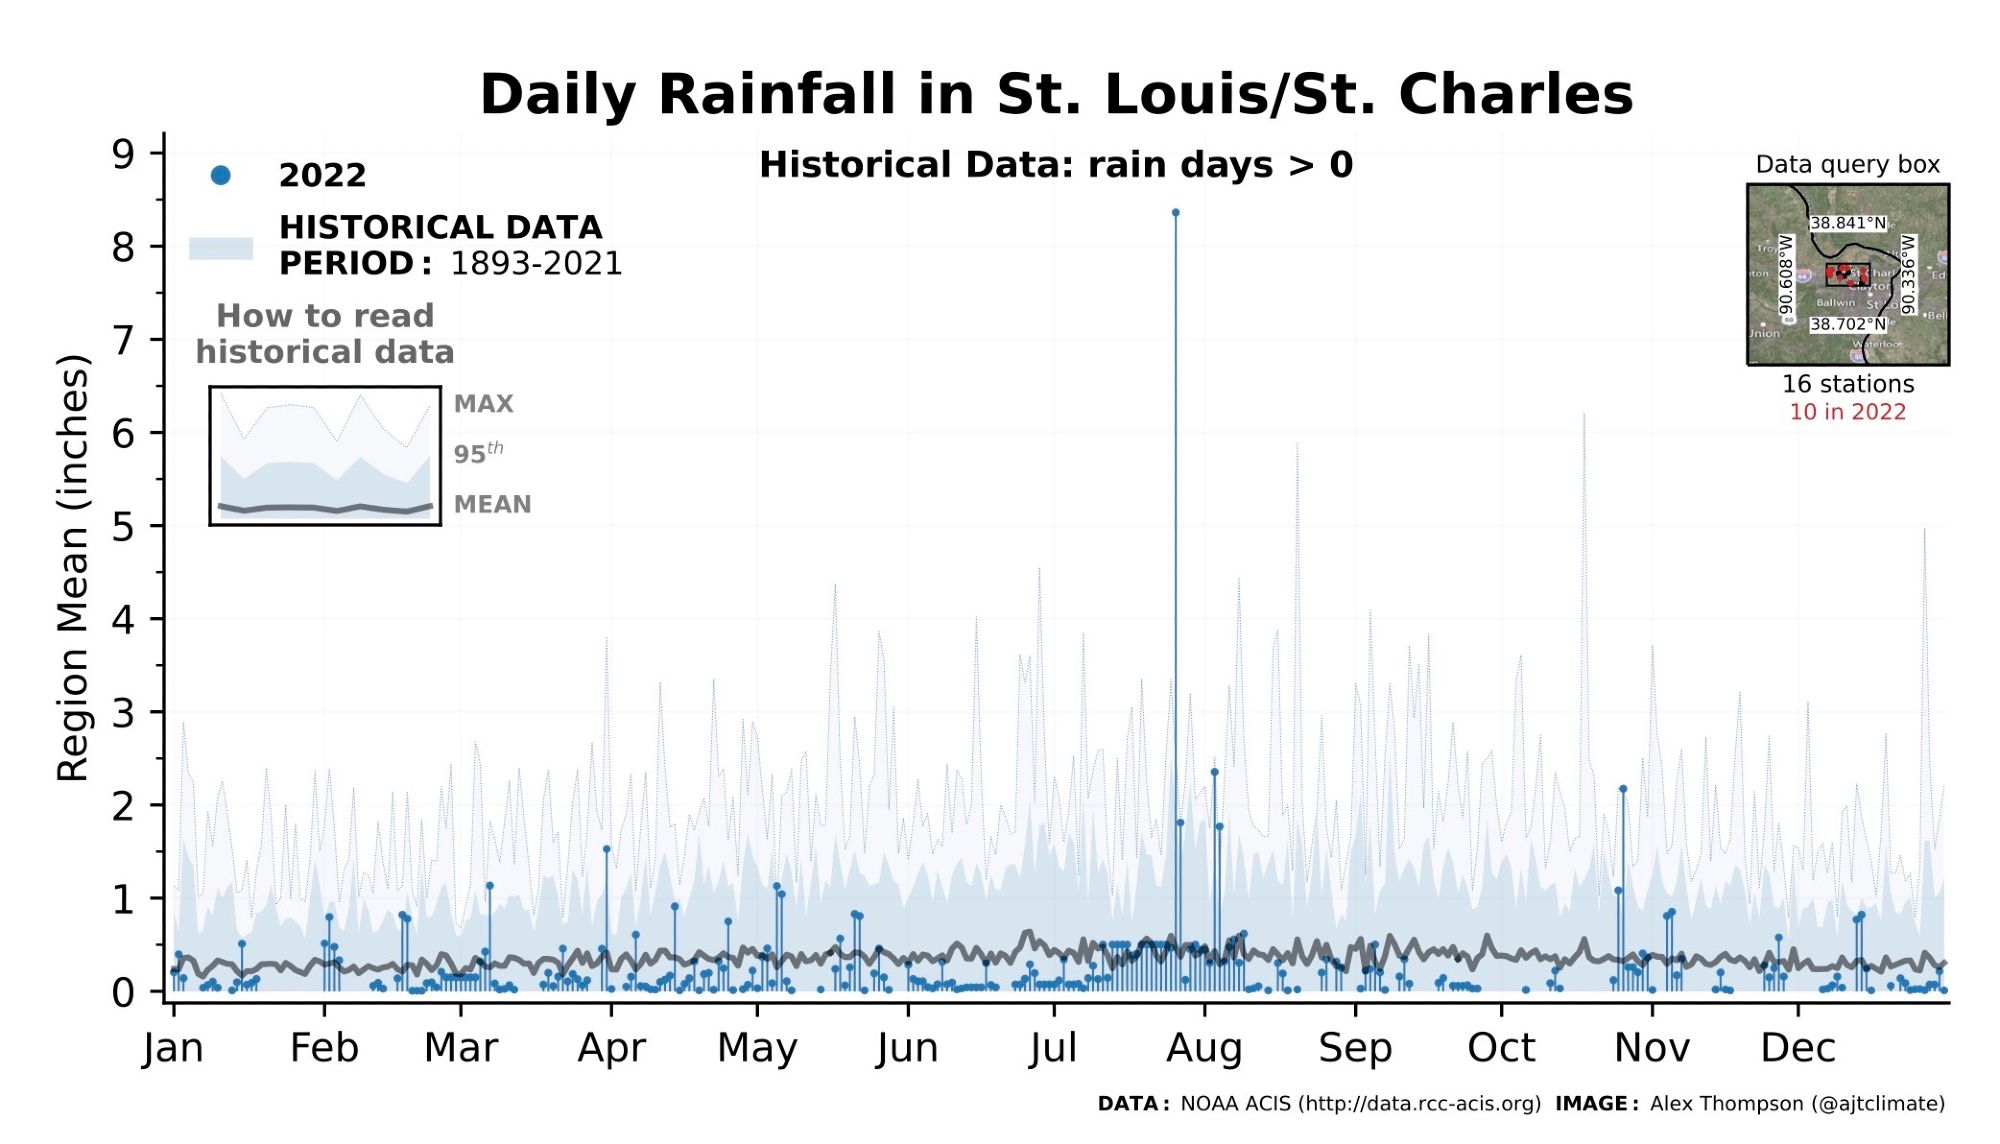
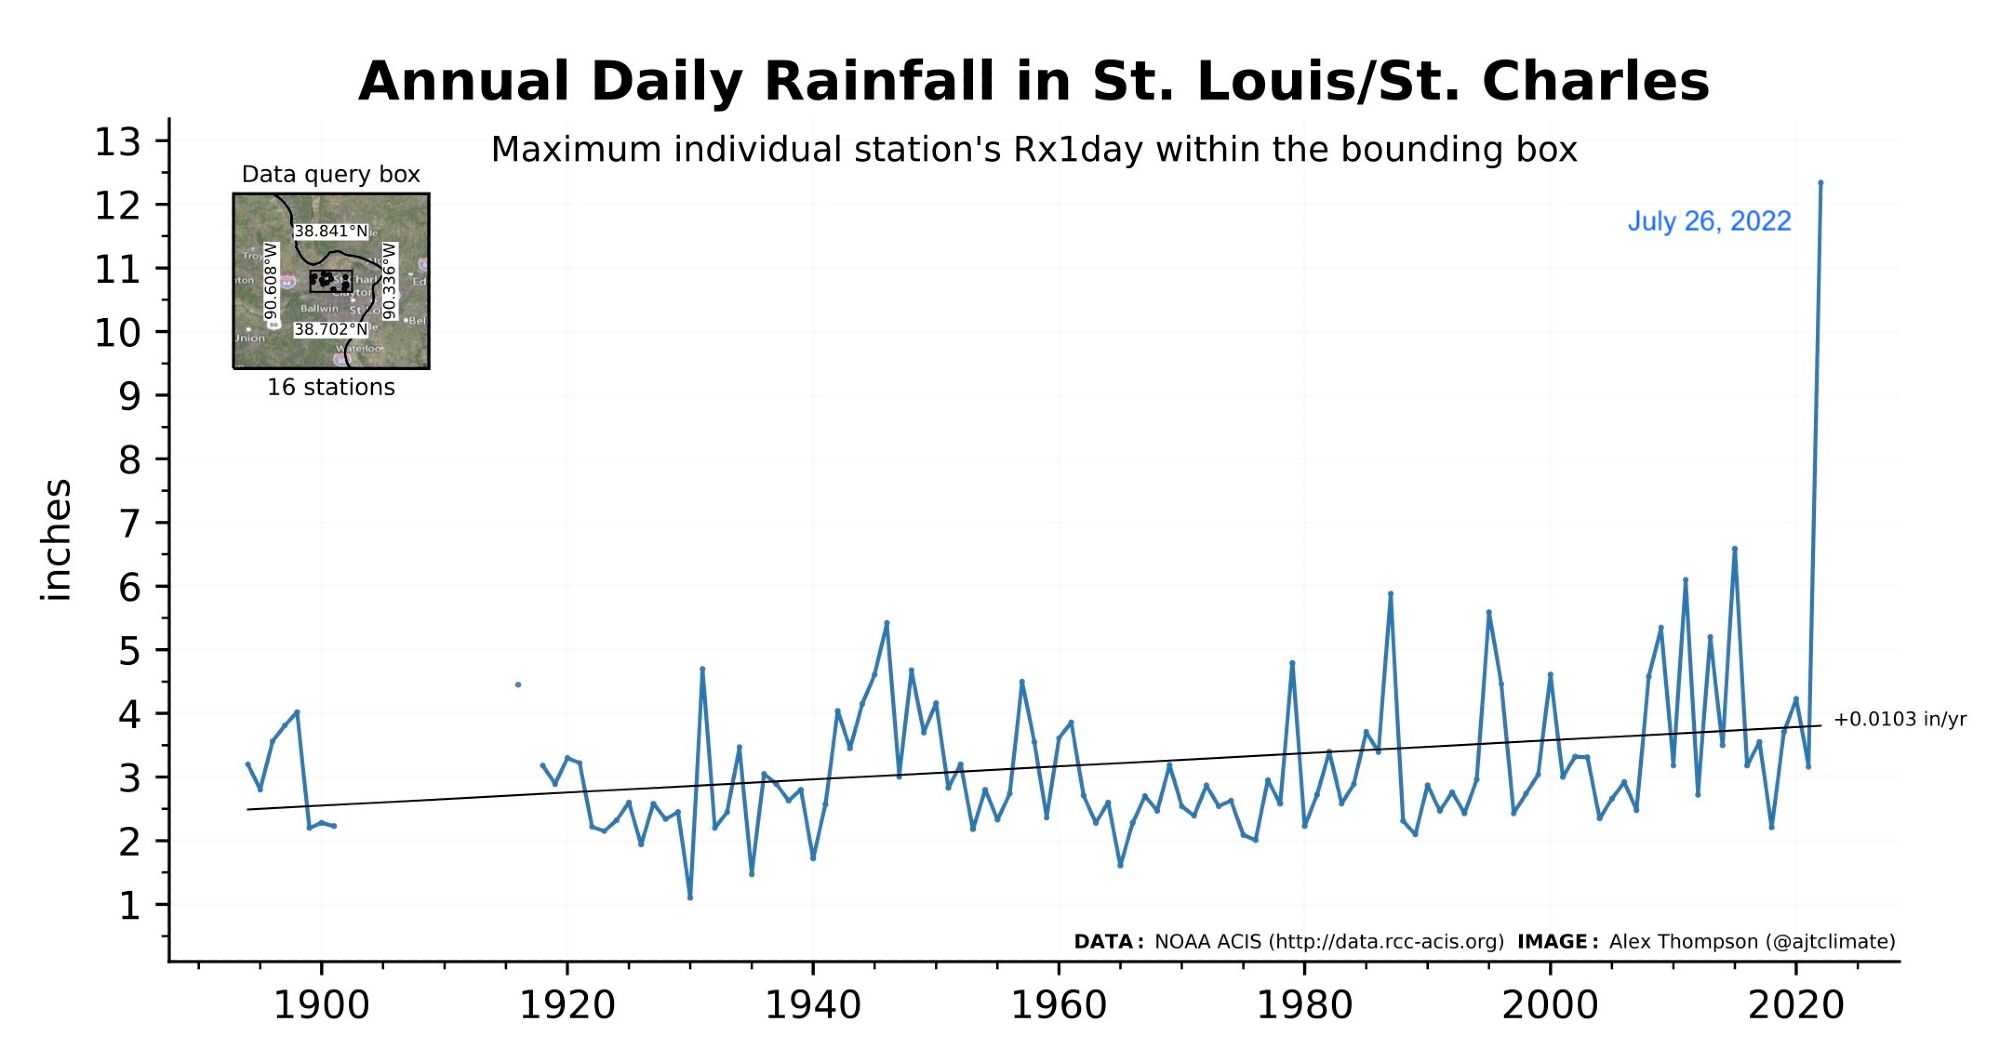
This week, I'll share a few examples of recent extreme climate events and how you can use the web tool to explore them. First up is the extreme rainfall event on July 26, 2022 in St. Louis. Check out how extreme this event was relative to previous yearly max rain events! (5/6)
A user help guide is available to walk users through the steps of using the tool. I plan on adding new features to the website in the future like daily weather maps of temp and precip from the NOAA ACIS gridded dataset. (4/6)
I currently have two different types of data visualizations (annual cycle and time series) for four daily climate variables: maximum temp, minimum temp, rainfall, and snowfall. Annual cumulative plots are also available for rainfall and snowfall. (3/6)
Climate Data Visualizer is designed for users to visualize daily and extreme temp/precip within the context of local climate history. The tool queries data from NOAA ACIS - an amazing database of daily station-based observations going back to the late 1800s. (2/6)