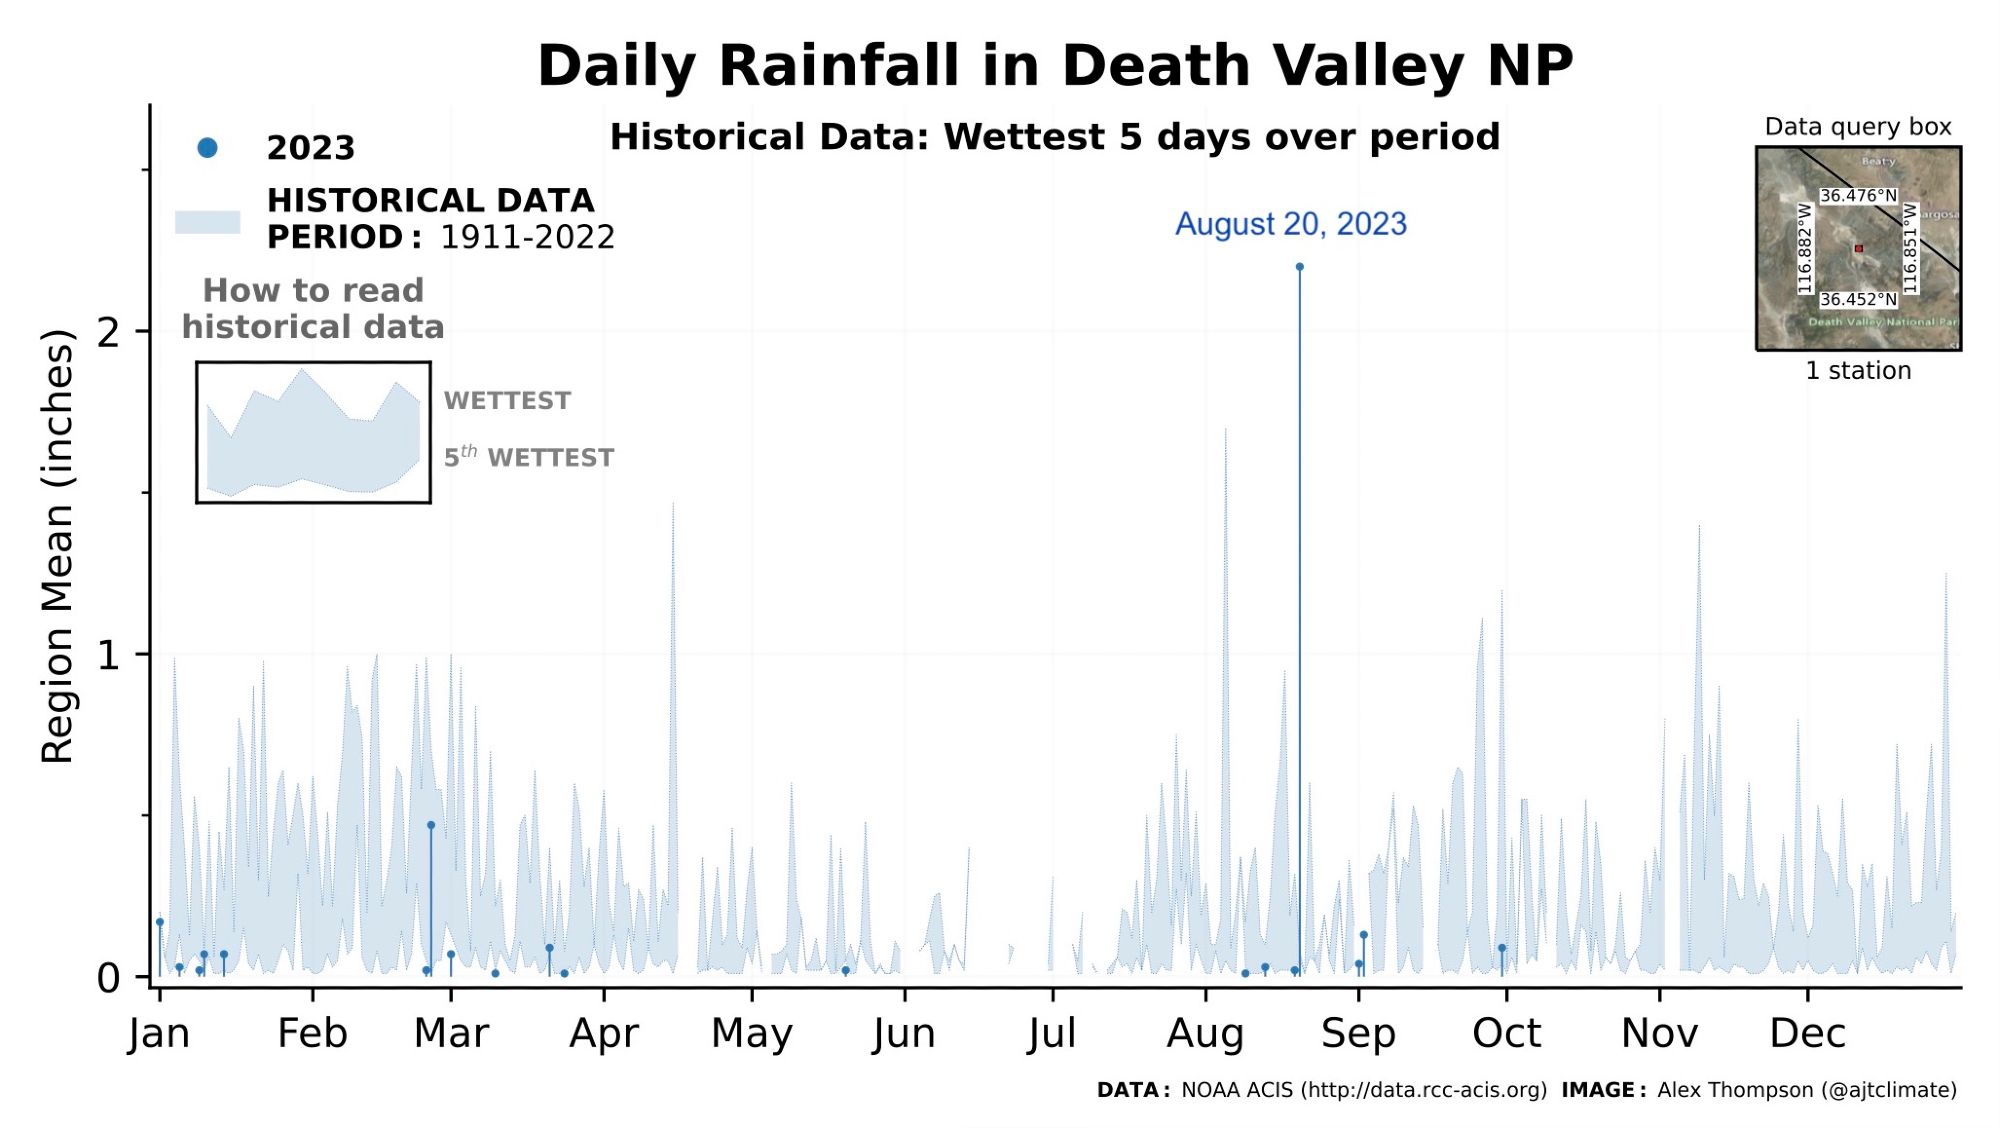
The last ClimateDataVisualizer example for AGU is the August 20, 2023 rainfall event in Death Valley NP from remnants of Hurricane Hilary. This event was the single highest recorded day since 1912 and accounted for an entire year's worth of 🌧️ in a single day
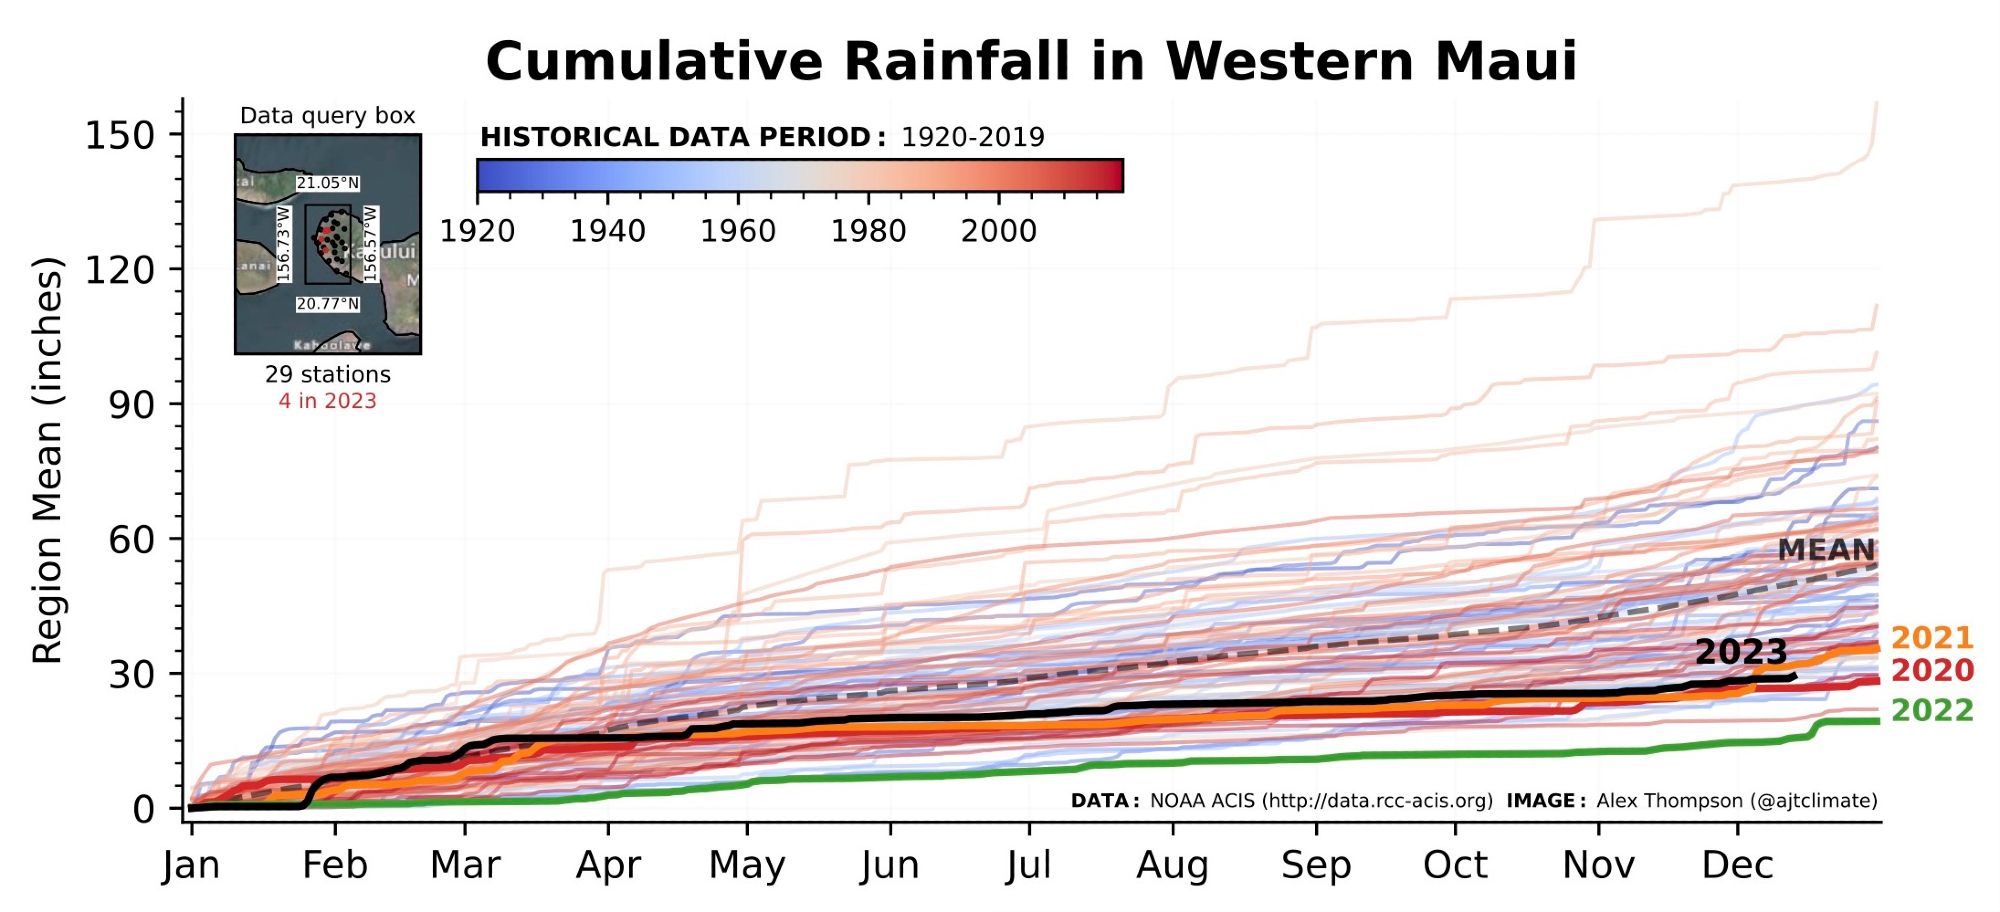
Today’s ClimateDataVisualizer example for AGU is annual rainfall for Western Maui in the years preceding 2023’s devastating wildfire. Some of the lowest annual rainfall totals since 1920 occurred in the last few years, drying out the region and priming it for a severe wildfire.
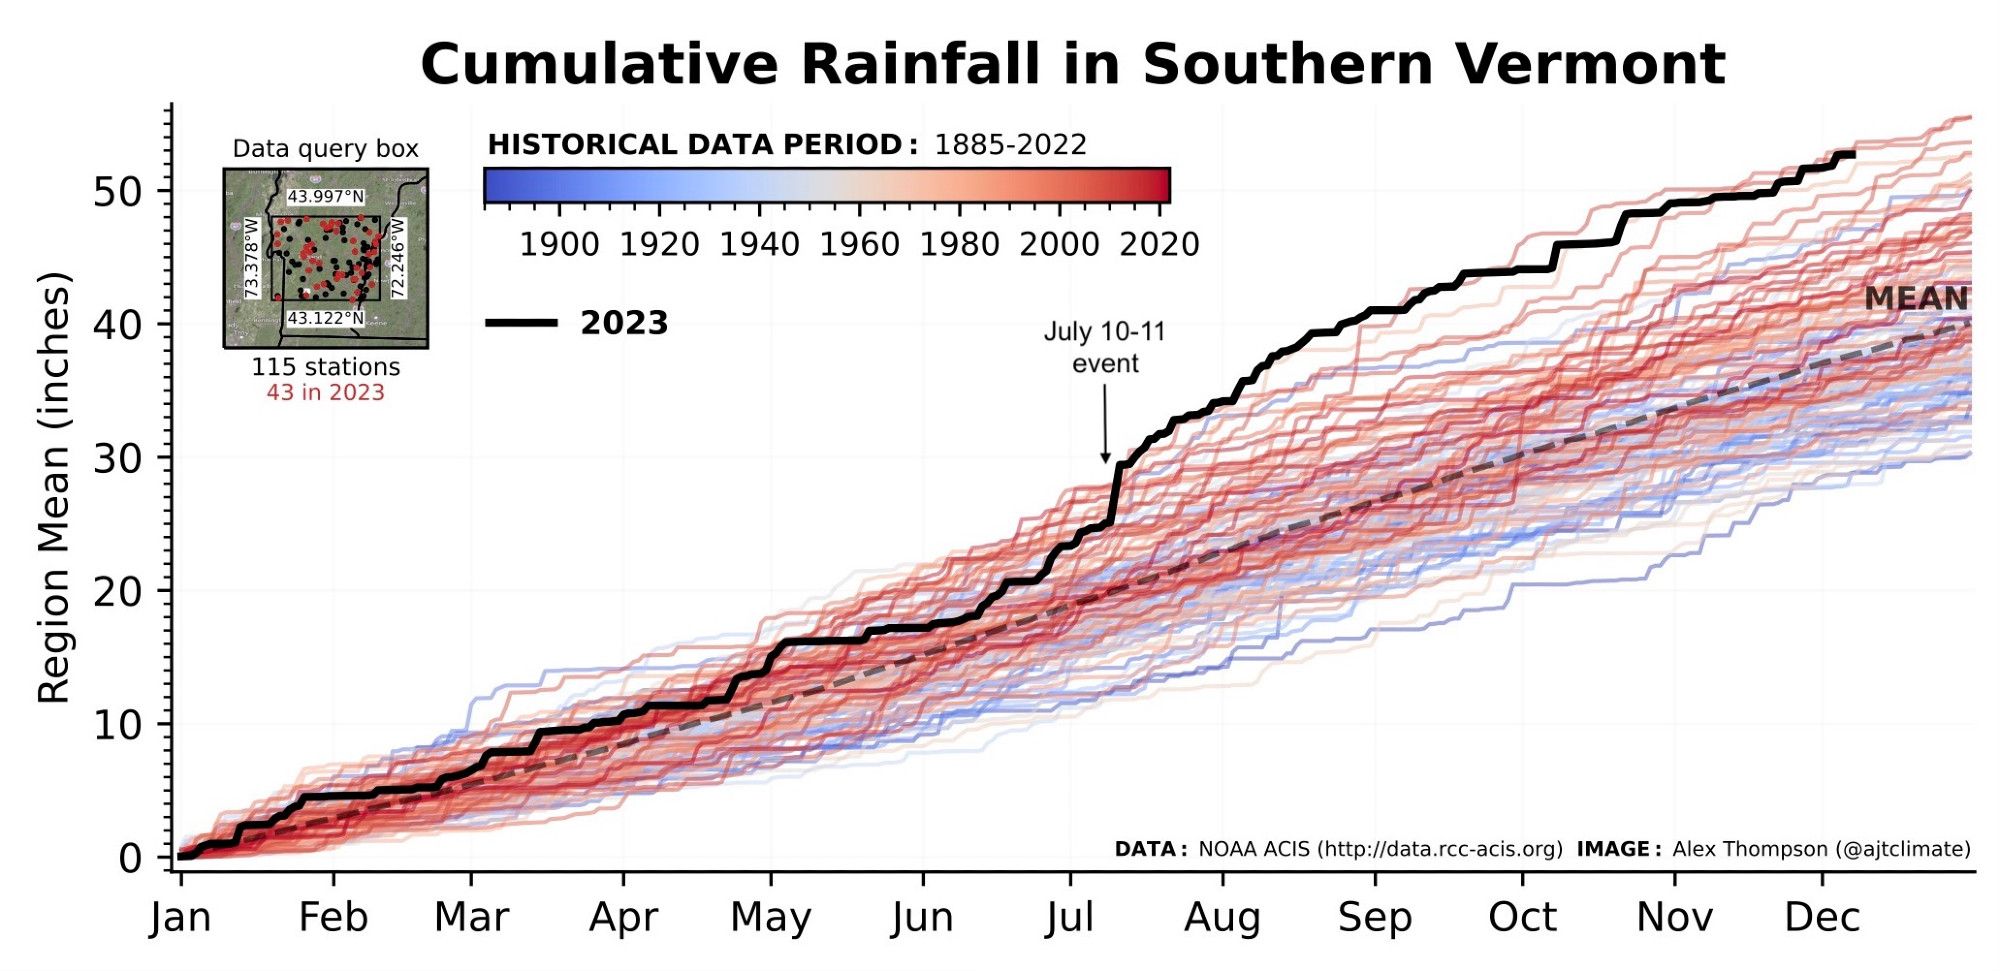
Today’s ClimateDataVisualizer example for AGU is the near-record 2023 cumulative rainfall year in Southern Vermont, which includes an extreme rainfall event on July 10-11. The lines are colored by year and show that as the climate warms, total annual rainfall tends to increase.
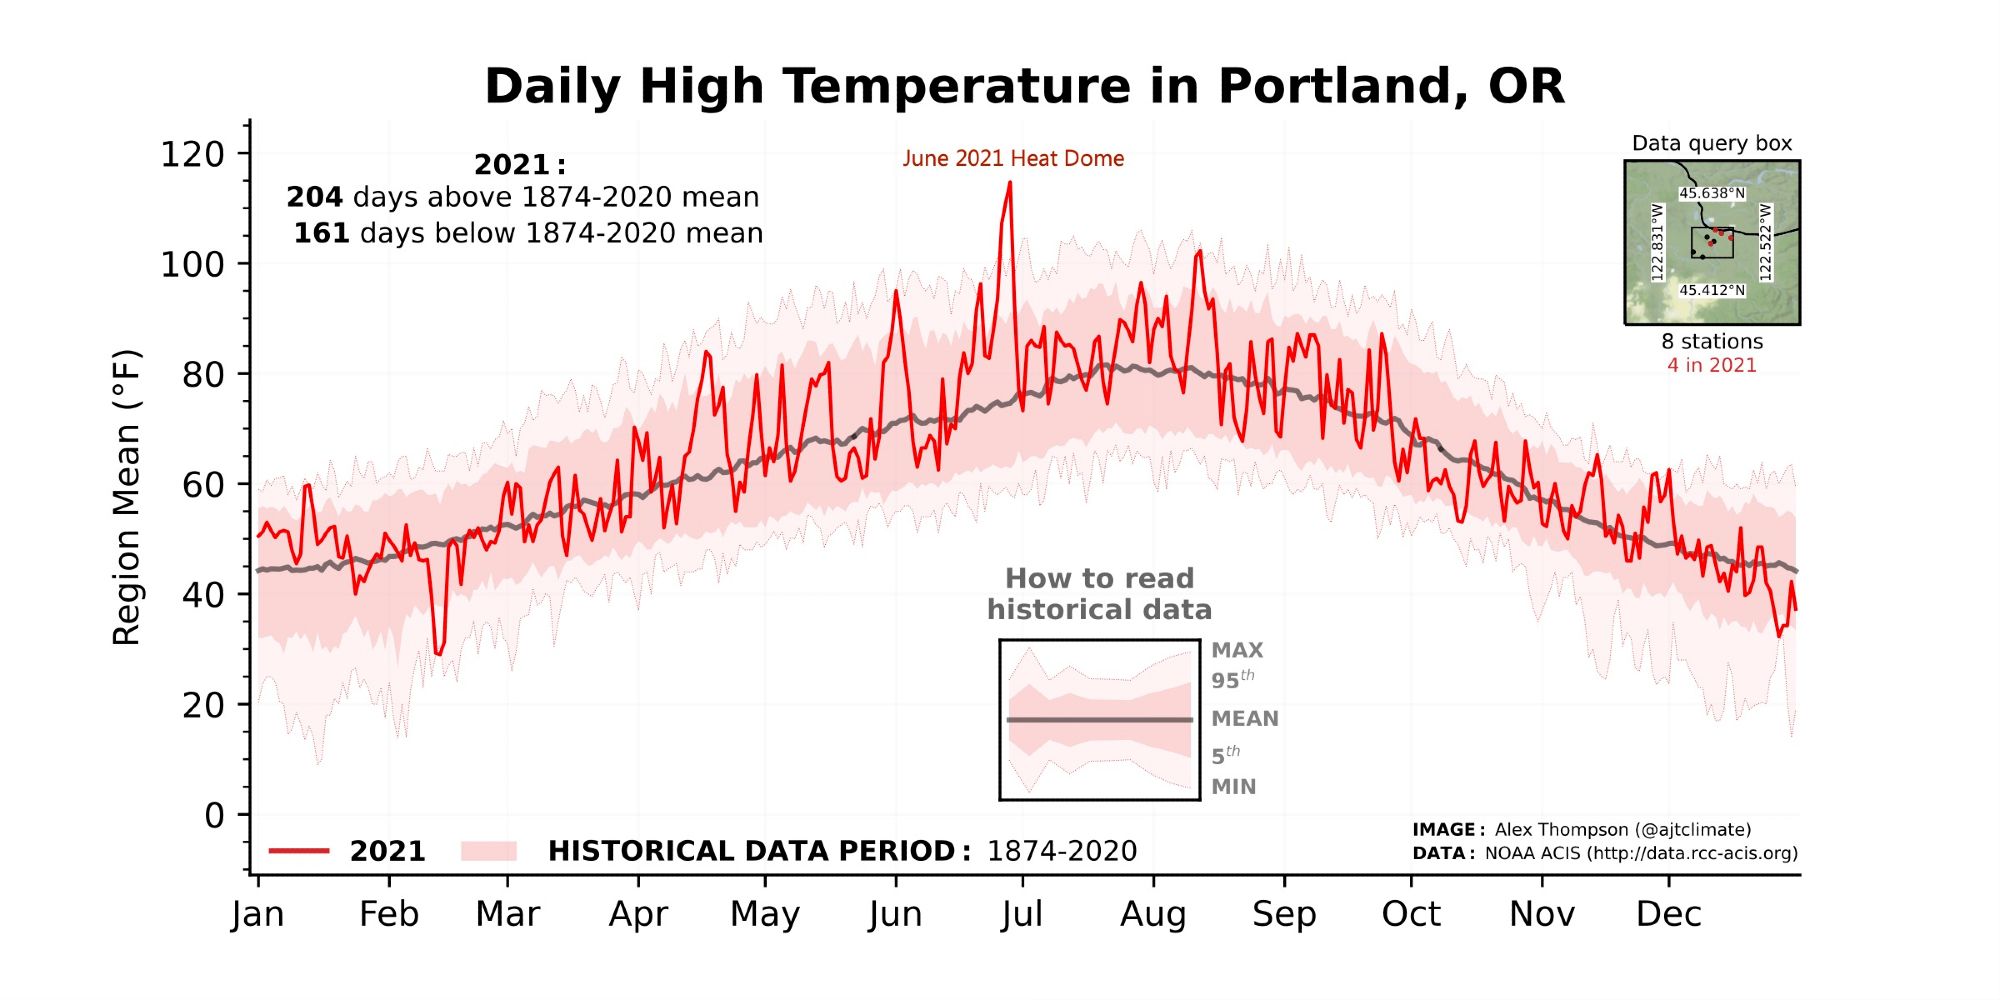
Today’s ClimateDataVizualizer example for AGU is the 2021 Pacific NW heat dome as shown in Portland, OR. NOAA ACIS observations show daily high temps on June 26-28, 2021 up to 9°F higher than any previous day since 1874. In fact, the Portland-wide avg from 4 stations topped out at 115°F on June 28!
Although I am attending AGU virtually this year with a newborn at home, I wanted to share a climate data web tool I have been working on over the past several months called Climate Data Visualizer. Give it a try at climate-data-viz.com! A quick 🧵(1/6)
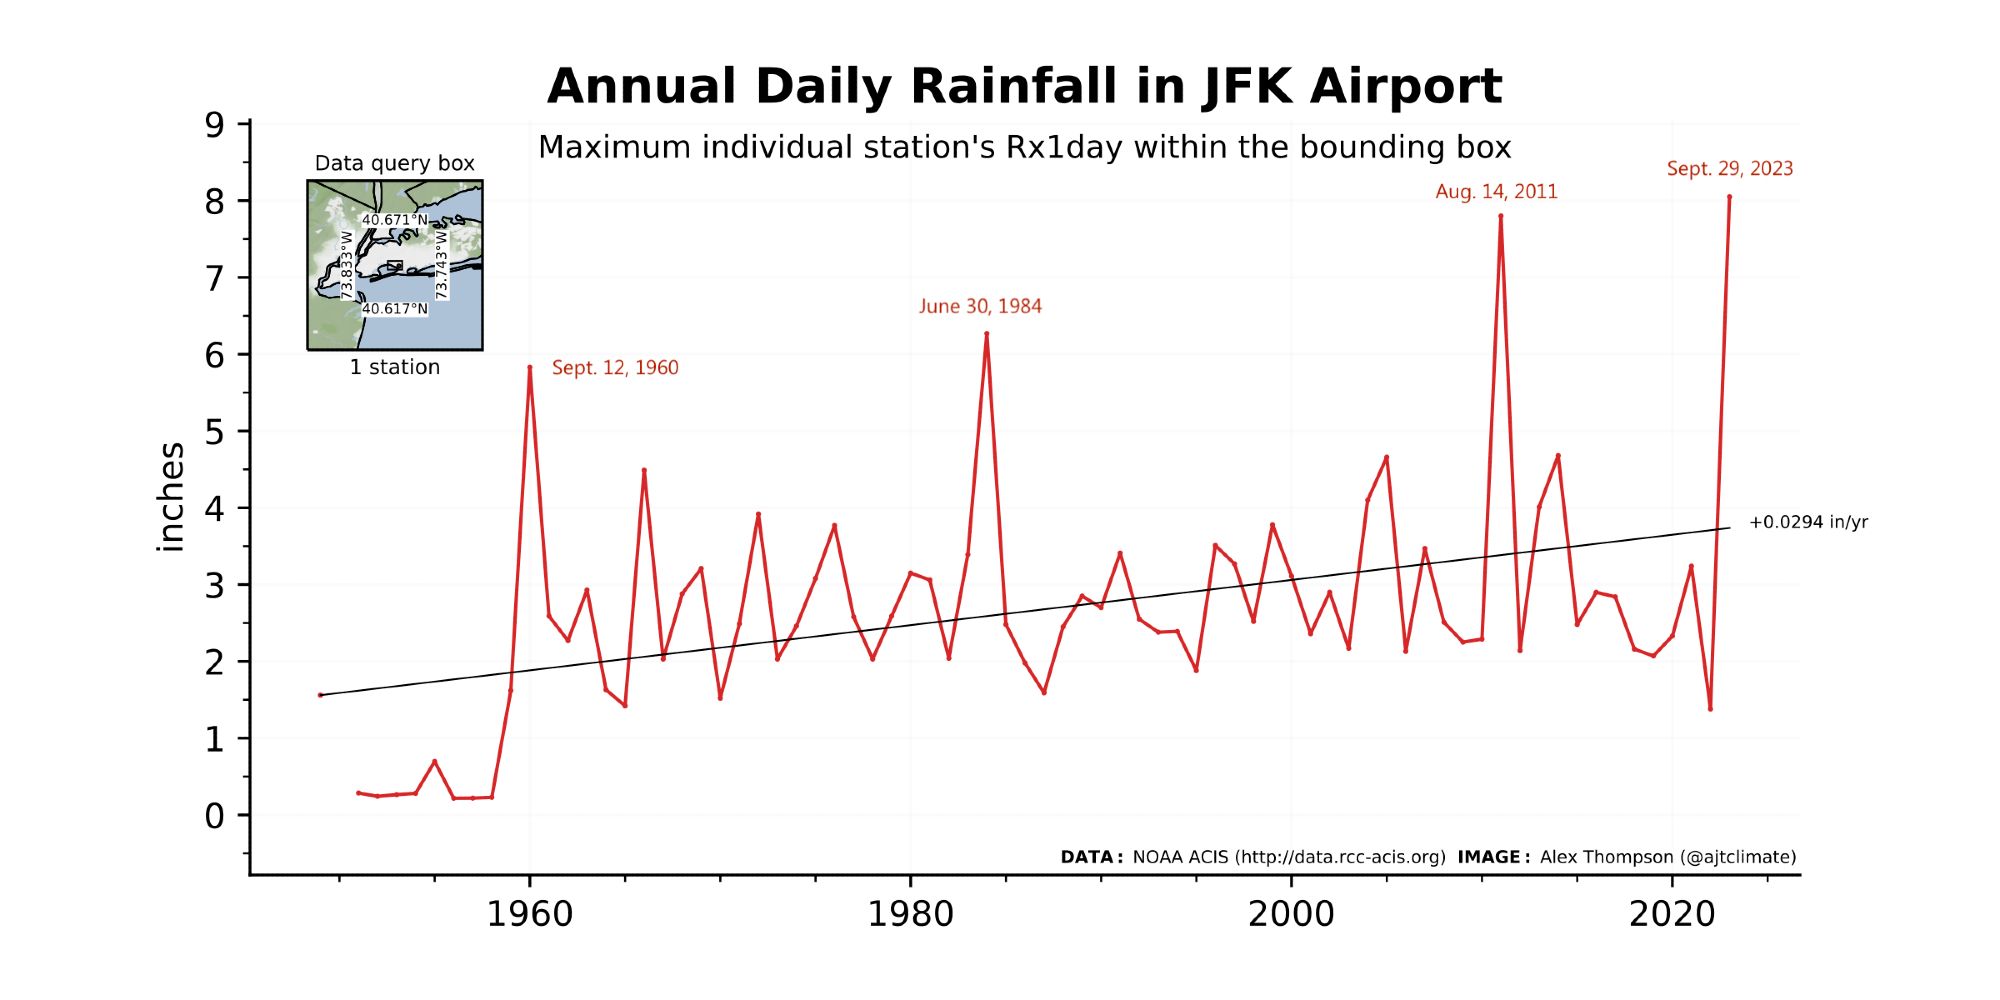
Time series of annual daily max rainfall (rx1 day) from JFK Airport. Yesterday's 24 total of 8.05 inches beat the previous record from 2011 by about 0.25 inches!
For my first post on 🟦 I want to share a Python-based app I am making that visualizes the complete climate history of any place in the US. It's a work-in-progress, but I plan to make it a standalone website in the near future! The current app can be accessed here: sites.google.com/view/ajtclim...