BLUE
Profile banner
AO
Annals of Botany
@annbot.bsky.social
Bluesky feed for Annals of Botany articles.
305 followers14 following694 posts
AOannbot.bsky.social

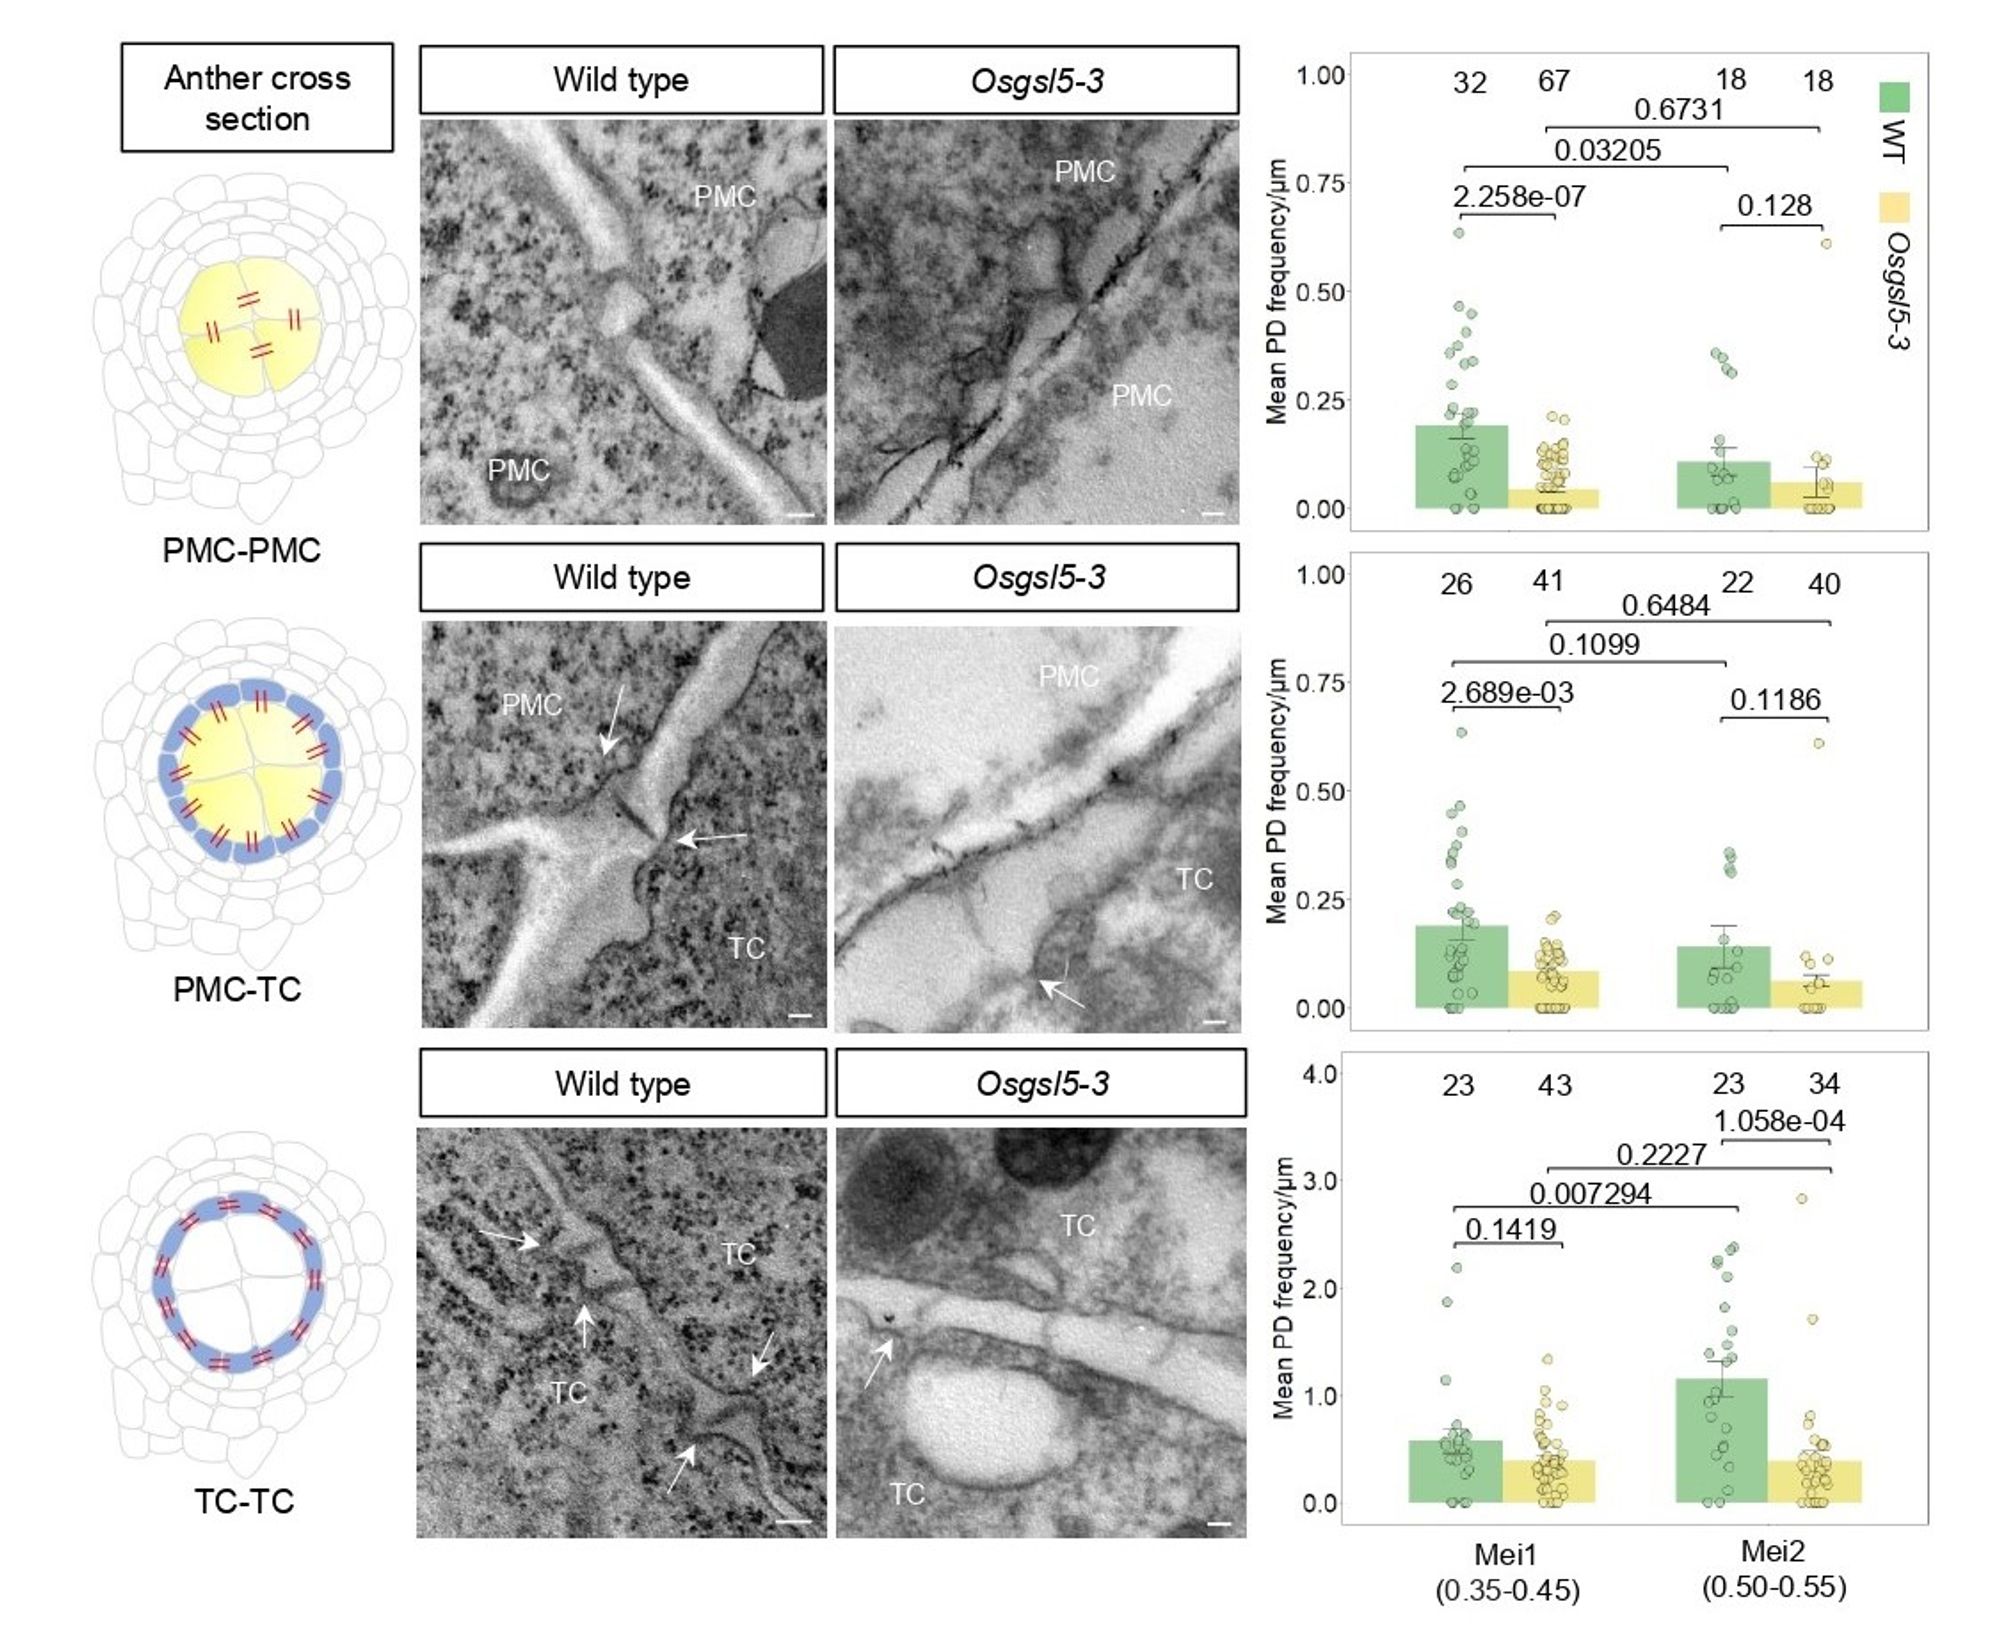
🌾 In a rice mutant lacking proper callose accumulation (Osgsl5-3), the reduction of plasmodesmata was even greater, suggesting callose is critical for maintaining cell-to-cell connectivity during this key reproductive stage. (5/8)

Figure showing plasmodesmata (PD) frequency changes during the transition to meiosis in Osgsl5-3 mutant rice anthers. The diagrams on the left show a cross-section of premeiotic anthers, highlighting the connections (PD in red) between pollen mother cells (PMC) and surrounding tapetal cells (TC). The middle images, taken using transmission electron microscopy, compare these connections in both wild-type (WT) and Osgsl5-3 mutant anthers. The right panels show how the number of PD connections per unit of cell wall changes in WT and Osgsl5-3 anthers during two stages: premeiotic interphase (Mei1) and early meiosis (Mei2). The graph bars include p-values (significance of the difference) and error bars representing the variation observed. Each dot represents the average PD frequency in an individual rice floret, and the numbers above indicate the sample sizes. Arrows point to membrane indentations at PD sites. Scale bar = 100 nm.
1

AOannbot.bsky.social

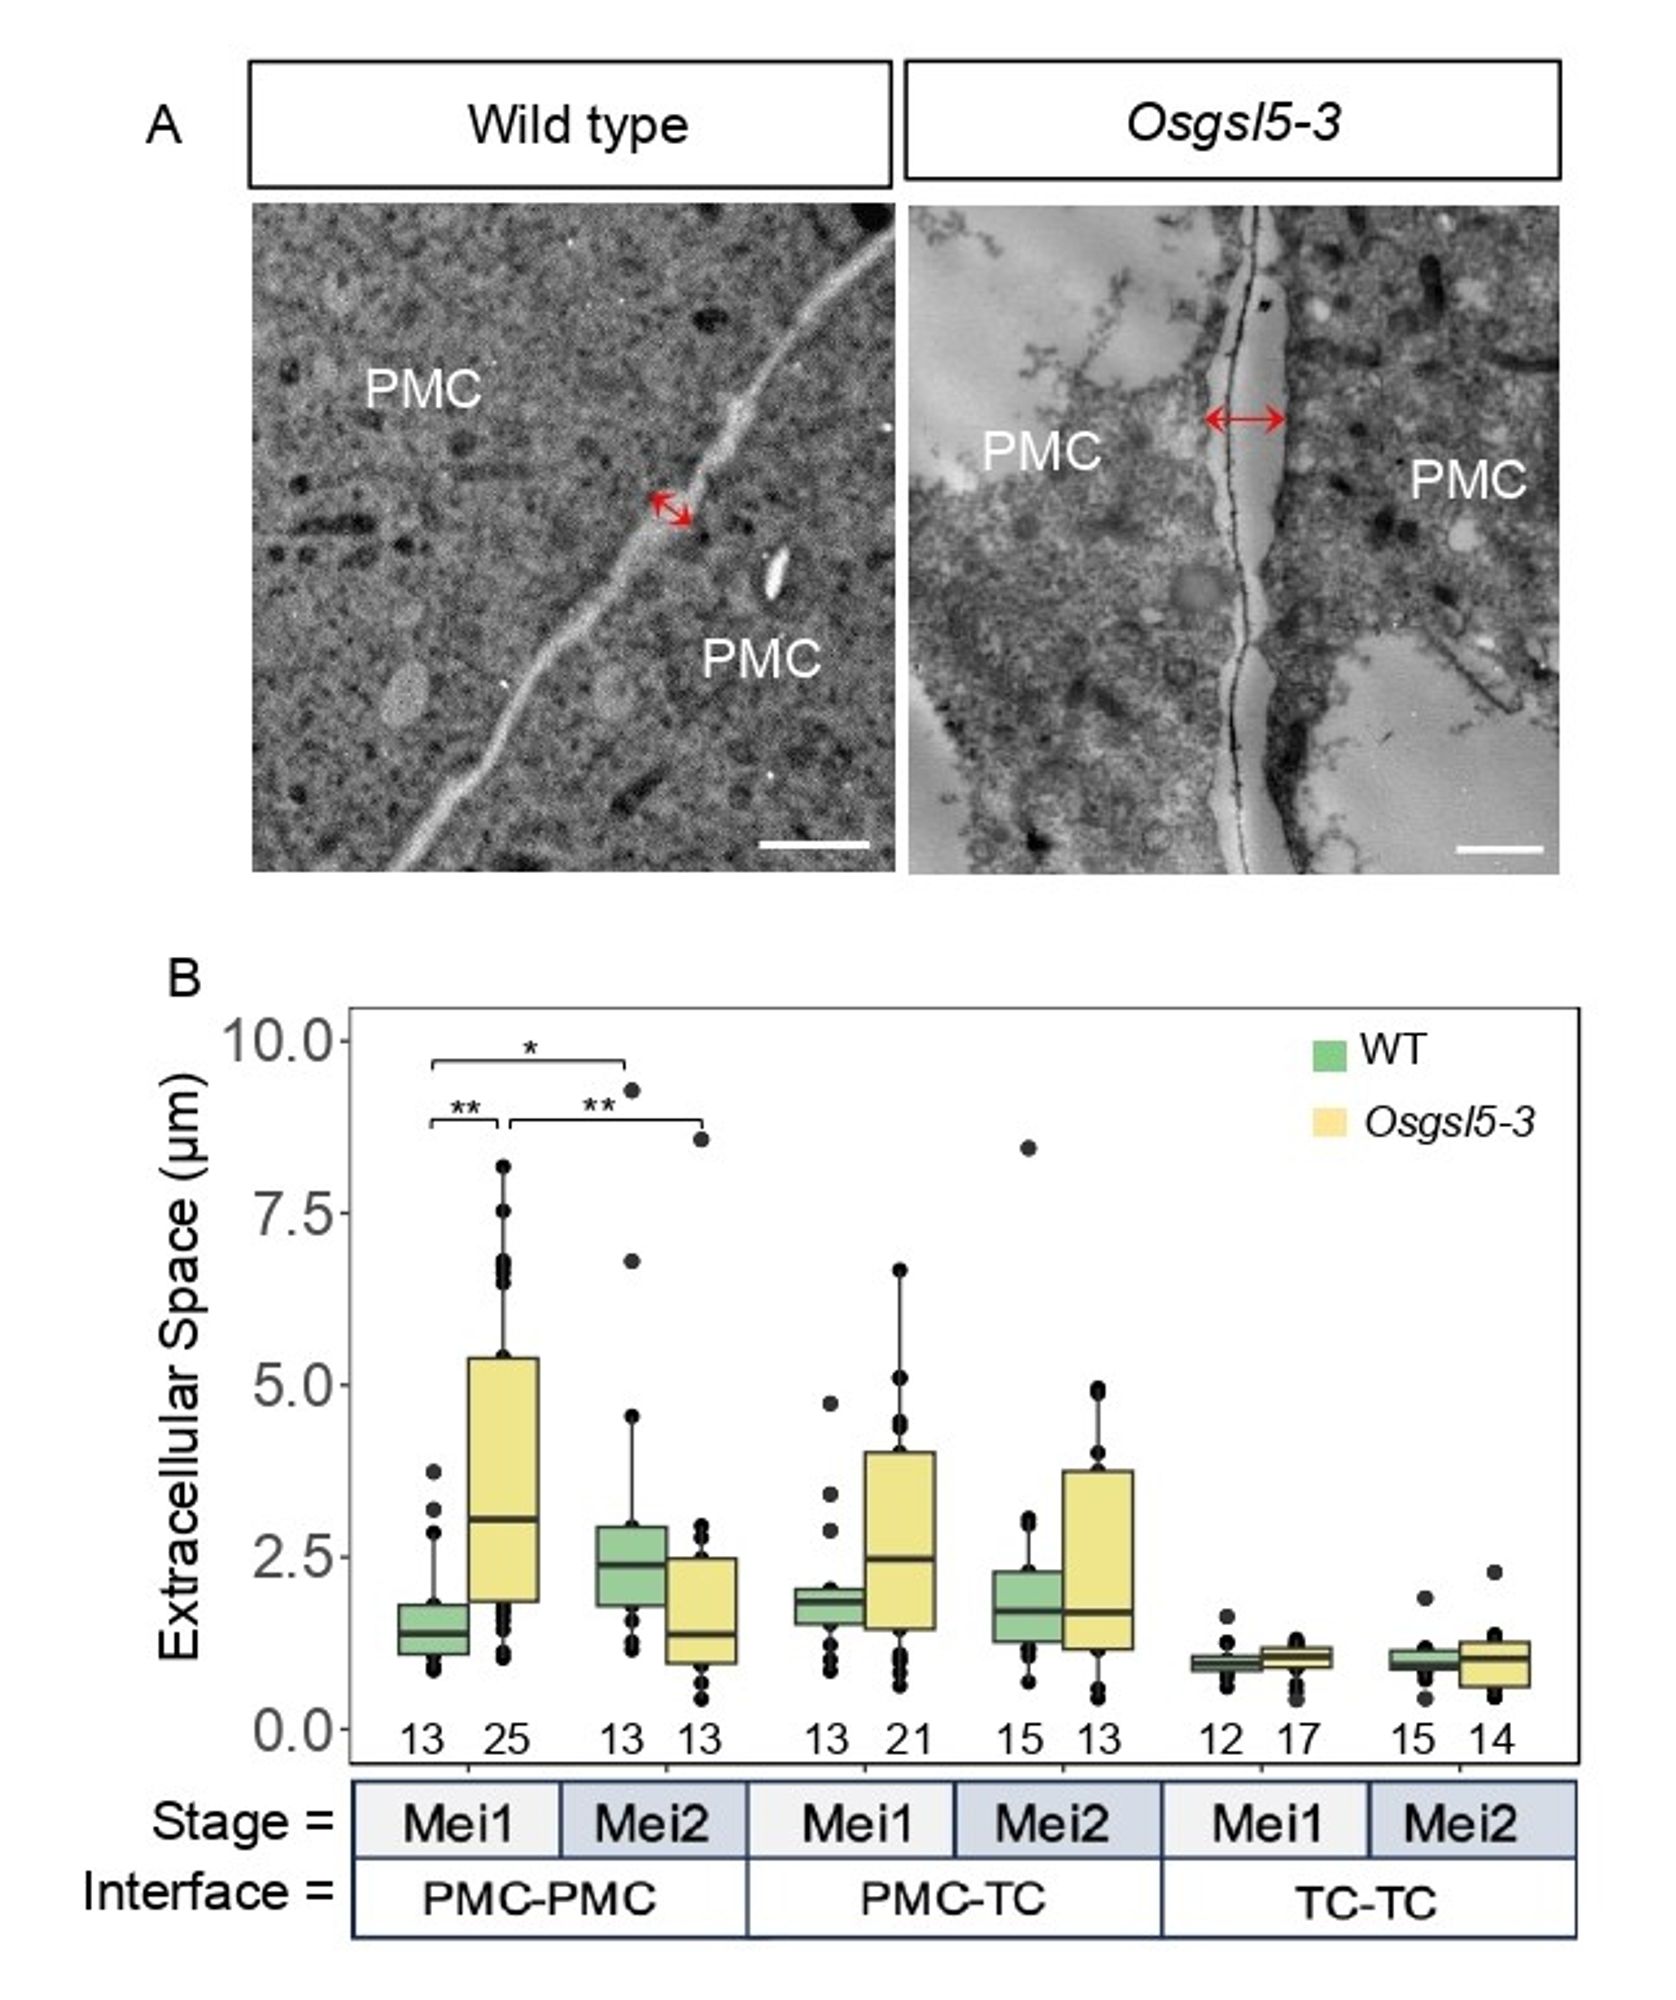
🚨 Another finding in the Osgsl5-3 mutant: increased distance between pollen mother cells and impaired premeiotic shaping. This suggests that callose plays a structural role in keeping cells organized for successful meiosis. (6/8)

Figure with two panels showing extracellular distance between adjacent pollen mother cells increases when rice anthers enter meiosis in the Osgsl5-3 mutant. In panel A, the electron microscope images show the gap between the plasma membranes (marked by the red double arrow) of two neighboring pollen mother cells in wild-type (WT) and Osgsl5-3 mutant anthers during the premeiotic stage (Mei1). The dark gray line between the cells represents the middle lamella, rich in pectin. Scale bar = 1μm. Panel B compares the distance between cells at three different interfaces in WT and Osgsl5-3 anthers, with all values normalized against the distance between tapetal cells (TC). The lines in each box represent the median, and asterisks indicate significant differences between the groups (*p ≤ 0.05, **p ≤ 0.01, ***p ≤ 0.001). The numbers below the graph indicate the sections analyzed for each cell interface and stage.
1
Profile banner
AO
Annals of Botany
@annbot.bsky.social
Bluesky feed for Annals of Botany articles.
305 followers14 following694 posts