BLUE
Profile banner
C
cee
@ceenell.bsky.social
lead of viz & analytics, usgs data science. d3.js & rstats. they/them 🏳️‍⚧️
121 followers171 following11 posts
Cceenell.bsky.social

CO breweries

0
Cceenell.bsky.social

CA wineries

0
Cceenell.bsky.social

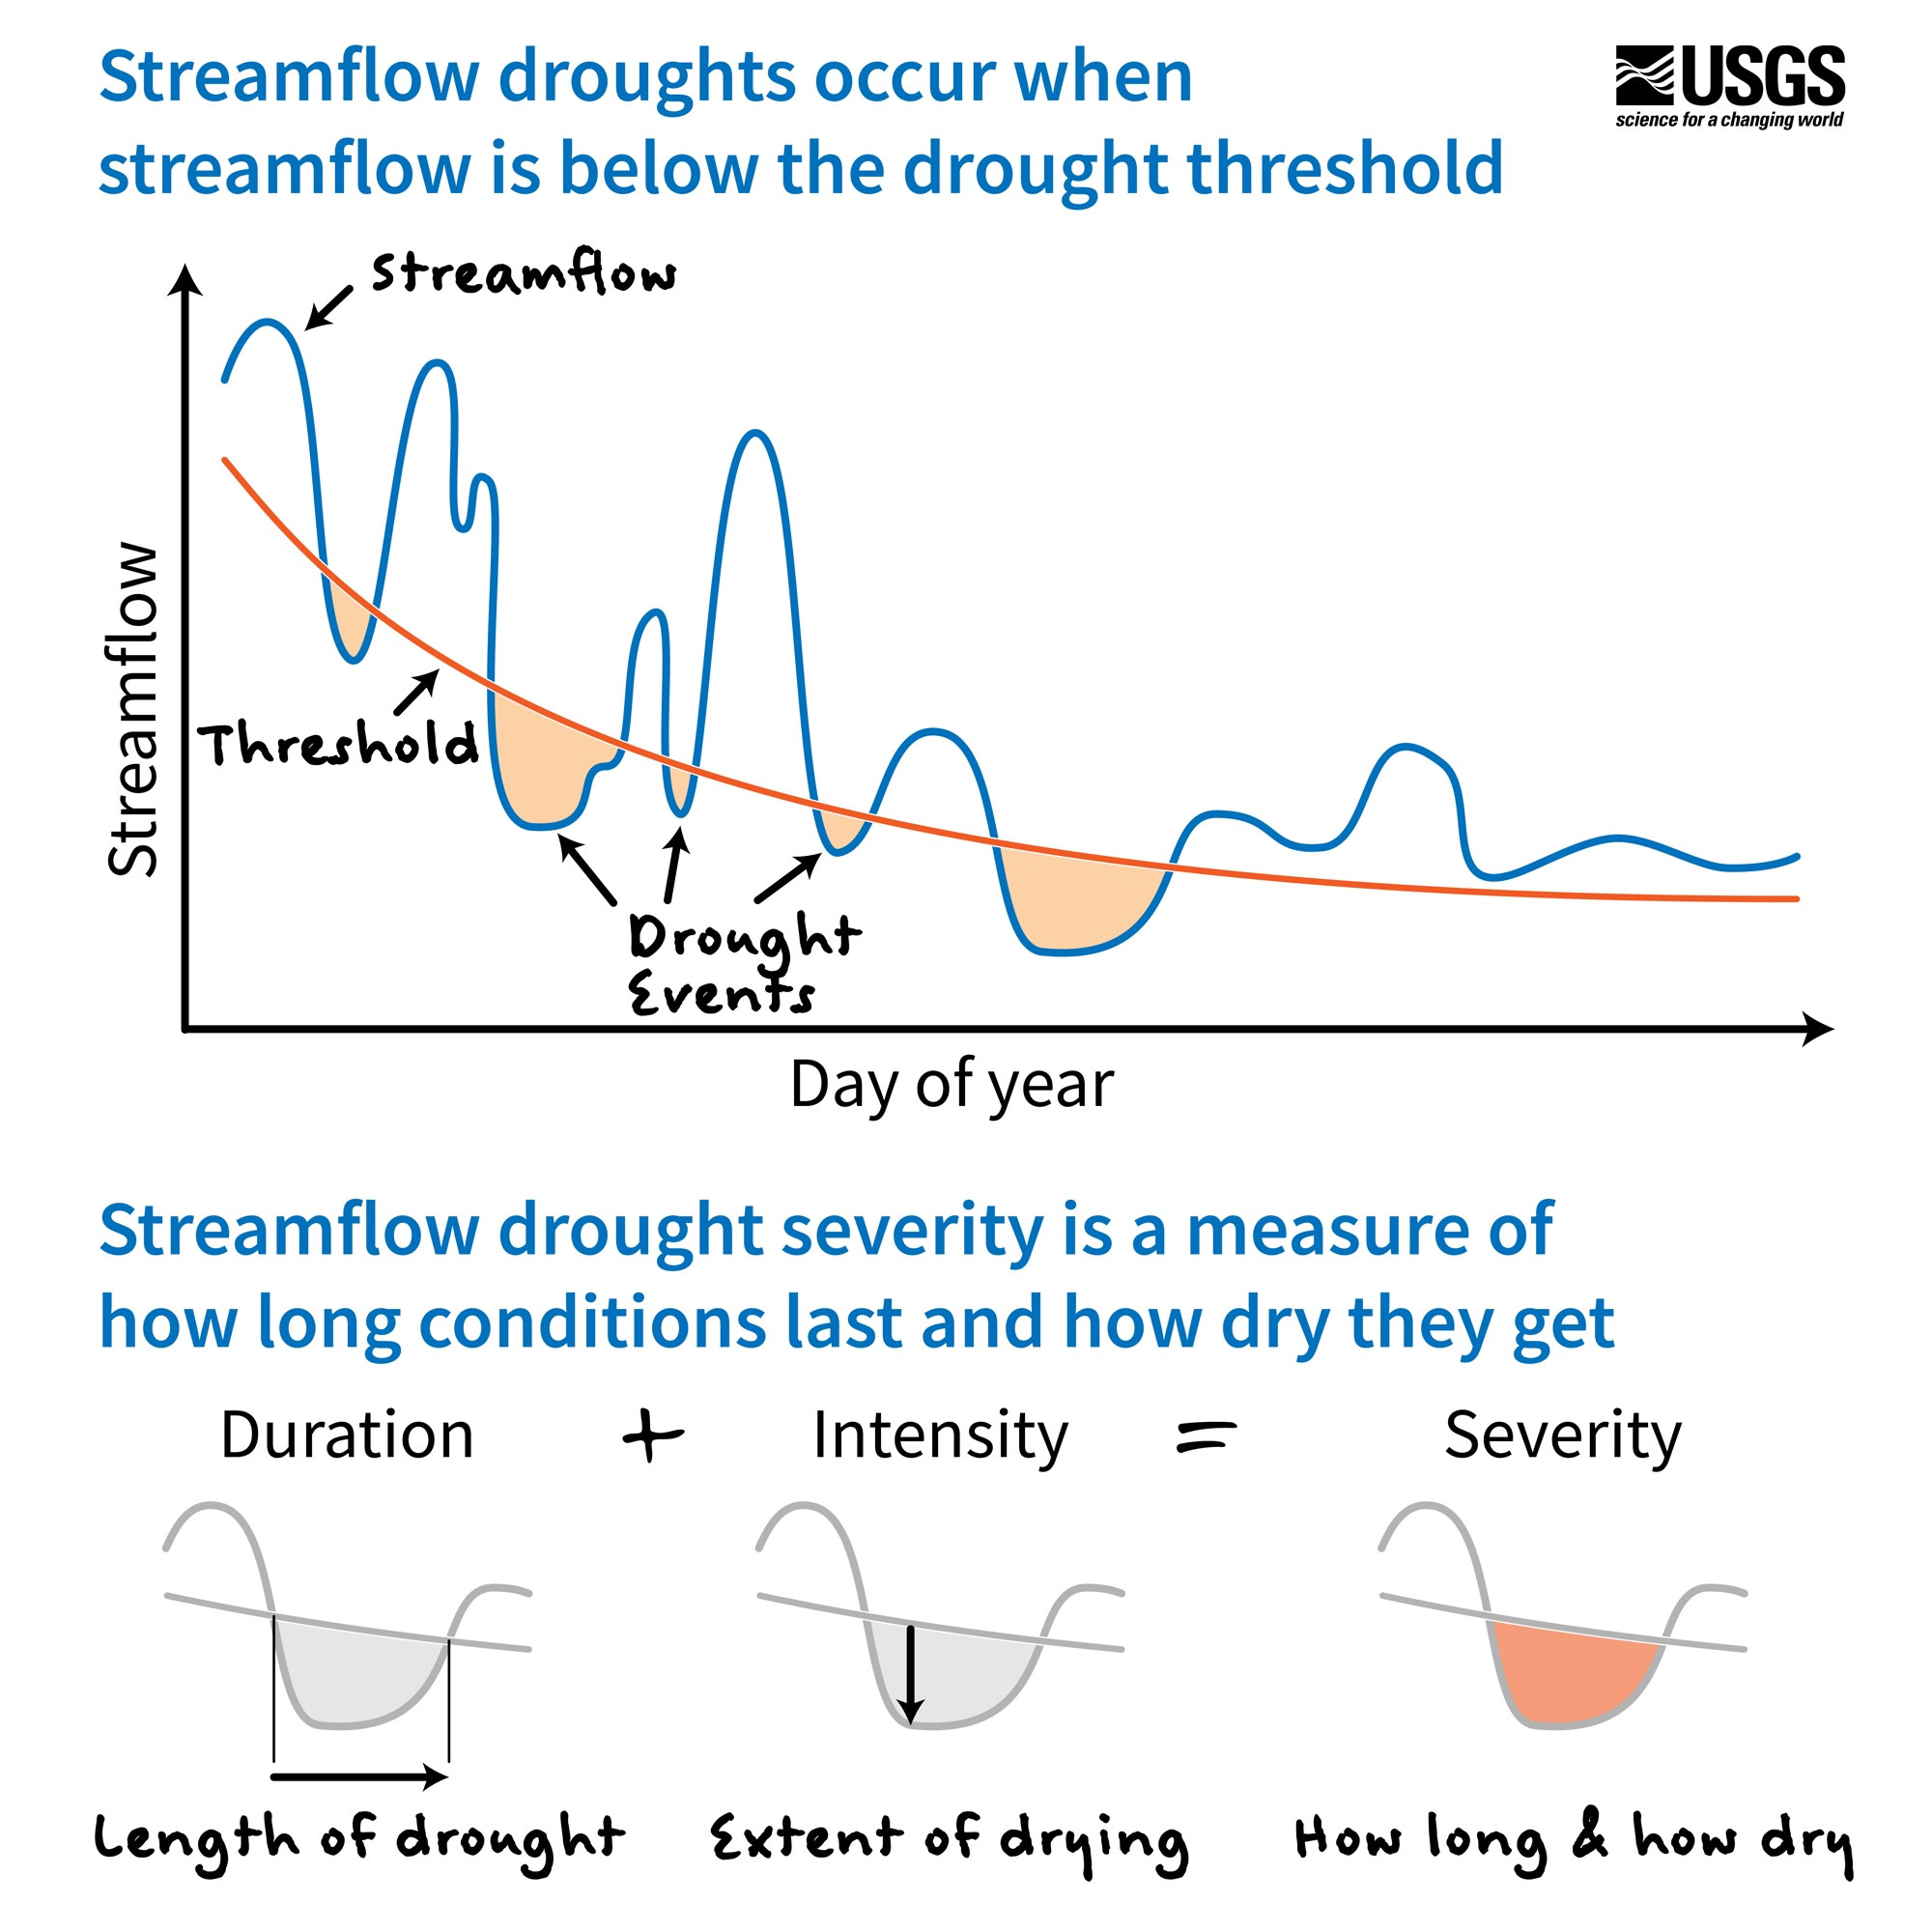
This timeline displays the 2,000 most severe drought events at individual streamgages between 1920 and 2020. Severity is a measure of how long (duration) and how dry (intensity) droughts were.

A hydrograph that demonstrates how streamflow drought and severity are defined. Streamflow droughts occur when streamflow is below the drought threshold. This is illustrated with a blue line representing daily fluctuations in streamflow, which occasionally dip below the orange drought threshold line. When this happens, this location would be in streamflow drought. Streamflow drought severity is a measure of how long conditions last and how dry they get. This concept is illustrated by looking at one drought event. Duration, or the length of the drought, and intensity, or the extent of drying, combine to calculate severity, which is the area under the curve between streamflow and the threshold.
0
Profile banner
C
cee
@ceenell.bsky.social
lead of viz & analytics, usgs data science. d3.js & rstats. they/them 🏳️‍⚧️
121 followers171 following11 posts