
I did. It was a simple question too, but the answer wasn't in the documentation. It was in the source code.
For what it is worth, a few librarians have confirmed their experience in this thread. Some included videos of the boxes and their experience. But you are right, the article is based on Reddit posts and posts there.
Considering my goal of reaching 2,500 subscribers, and based on the current conversion rate, I estimate that I need to reach over 30,000 users. At present, paid search is delivering around 80 users per day, with an average of 2-3 trial users per day. What are your thoughts?
I find it confusing whether I should focus on increasing the number of free trial users to improve the conversion rate or working on new features to attract new users.
I can't share all of my secrets! 😂🤣 https://www.a2gov.org/departments/planning/a2d2/zoning/Documents/Downtown%20Zoning%20History%20-%201987.pdf
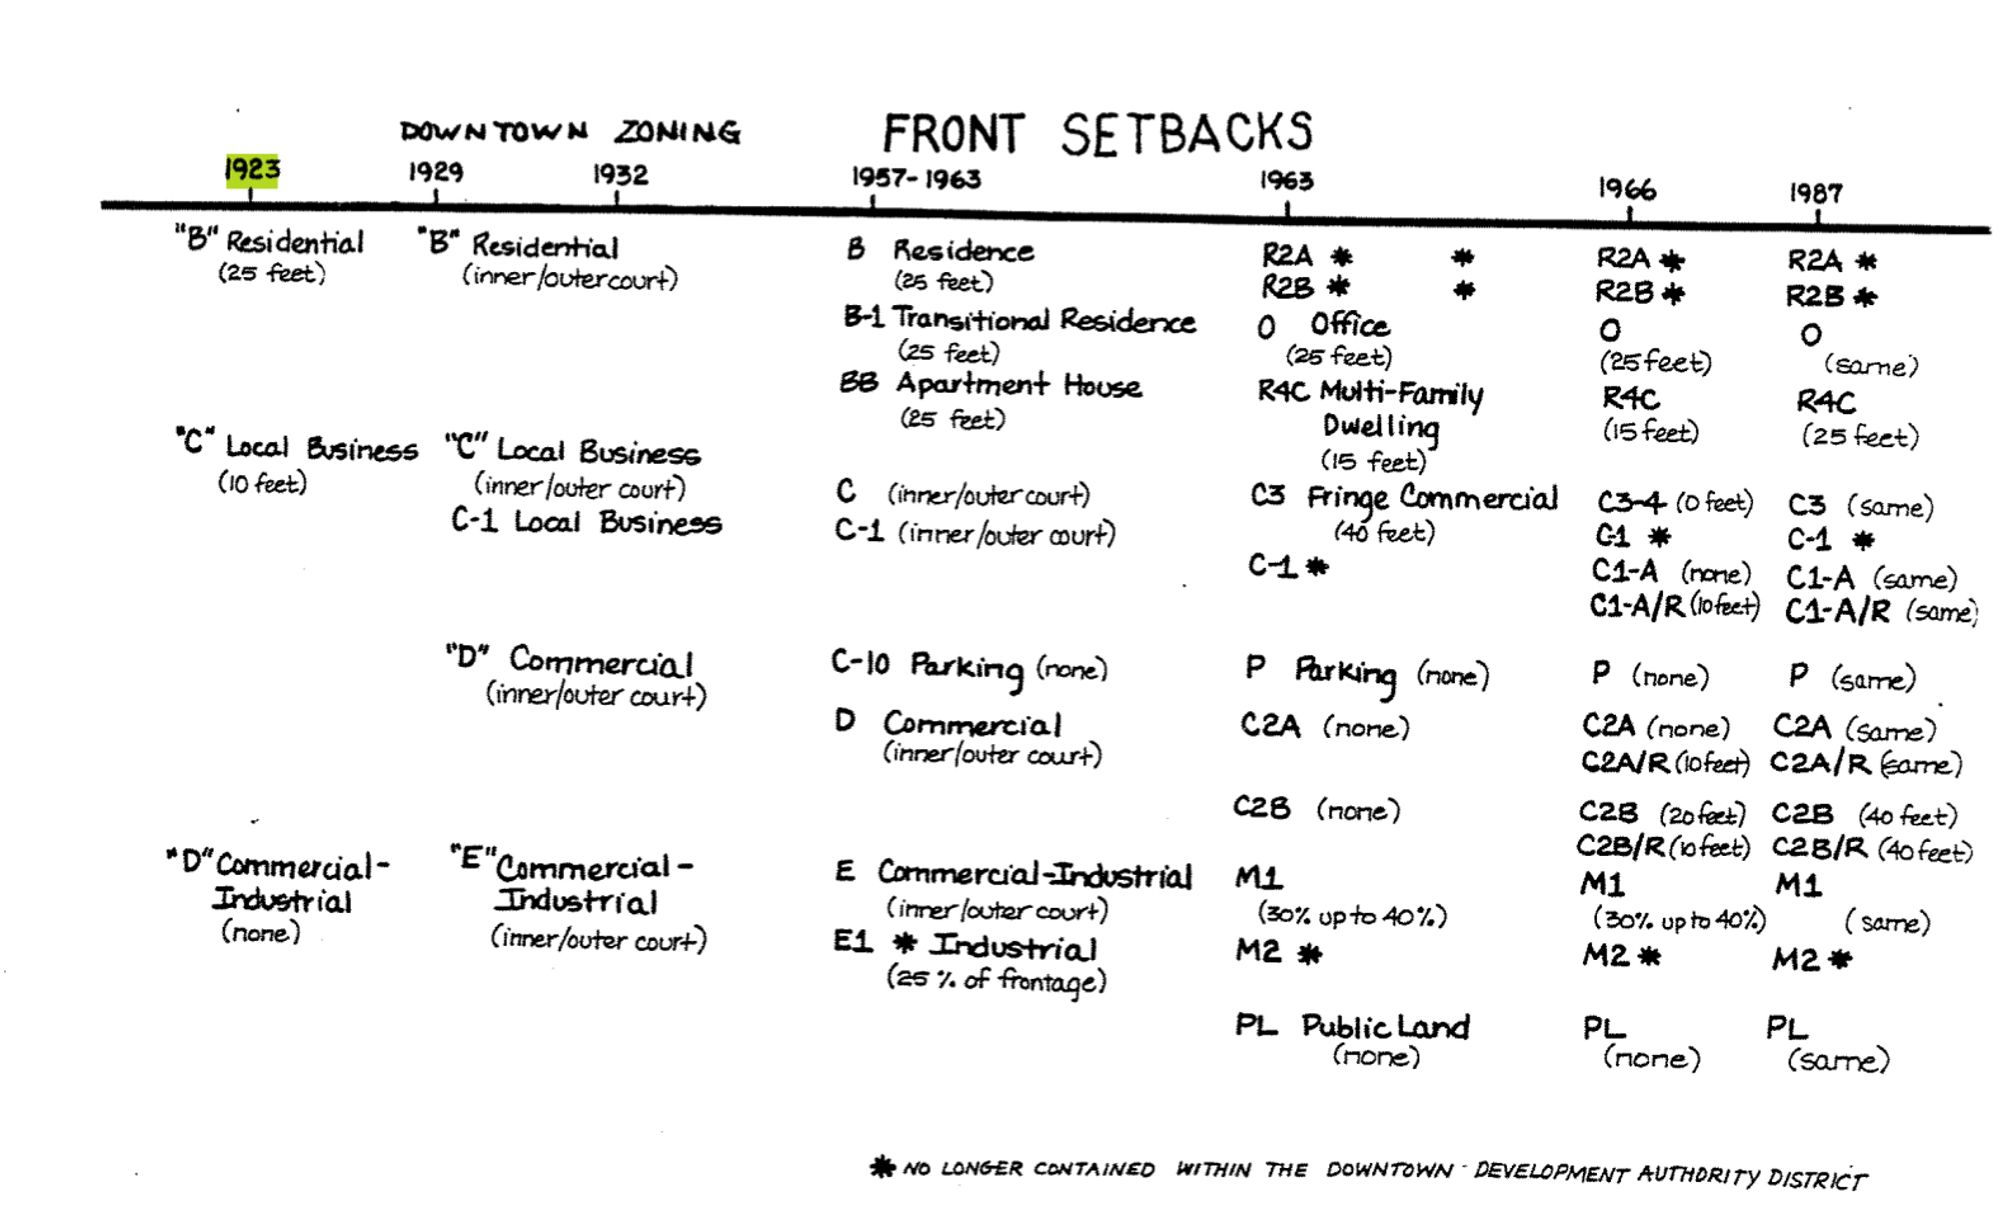
Next up is setbacks which built out our suburban landscape (hellscape). You’ll notice here, we immediately start with restrictions for residential and then maintain them. Setbacks really limit what can be built on a lot, all of which contributes to our current housing crisis in Ann Arbor.
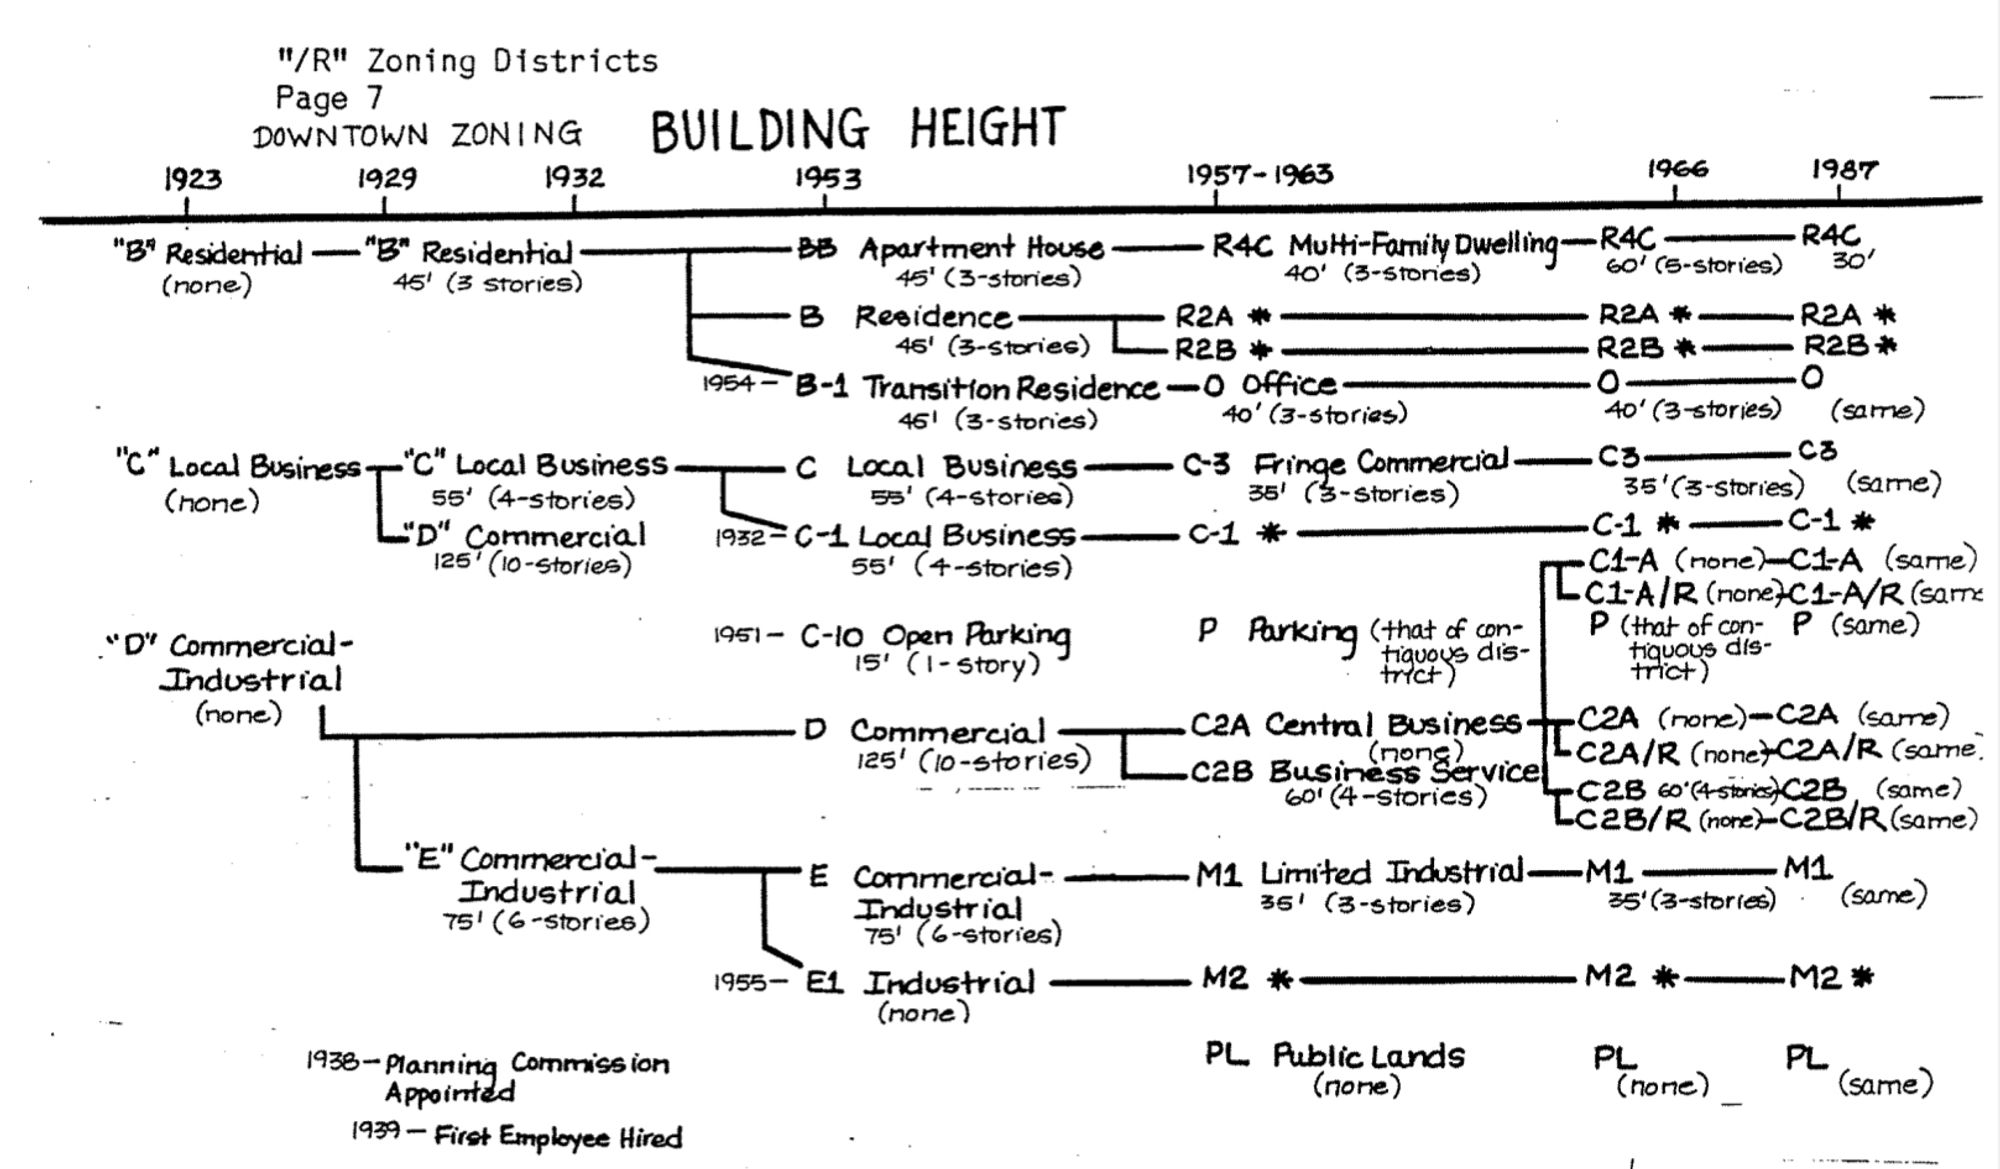
This timeline reveals an intriguing pattern: no height limits for 6 yrs, then a restriction of 45ft. During desegregation, height limits go down, then up, then down again. A deliberate imposition of height restrictions aimed to curtail housing density in Ann Arbor, creating a housing crisis.
The construction of these 26K housing units with larger lot sizes shaped the current built environment, purposely limiting our ability to increase housing density.
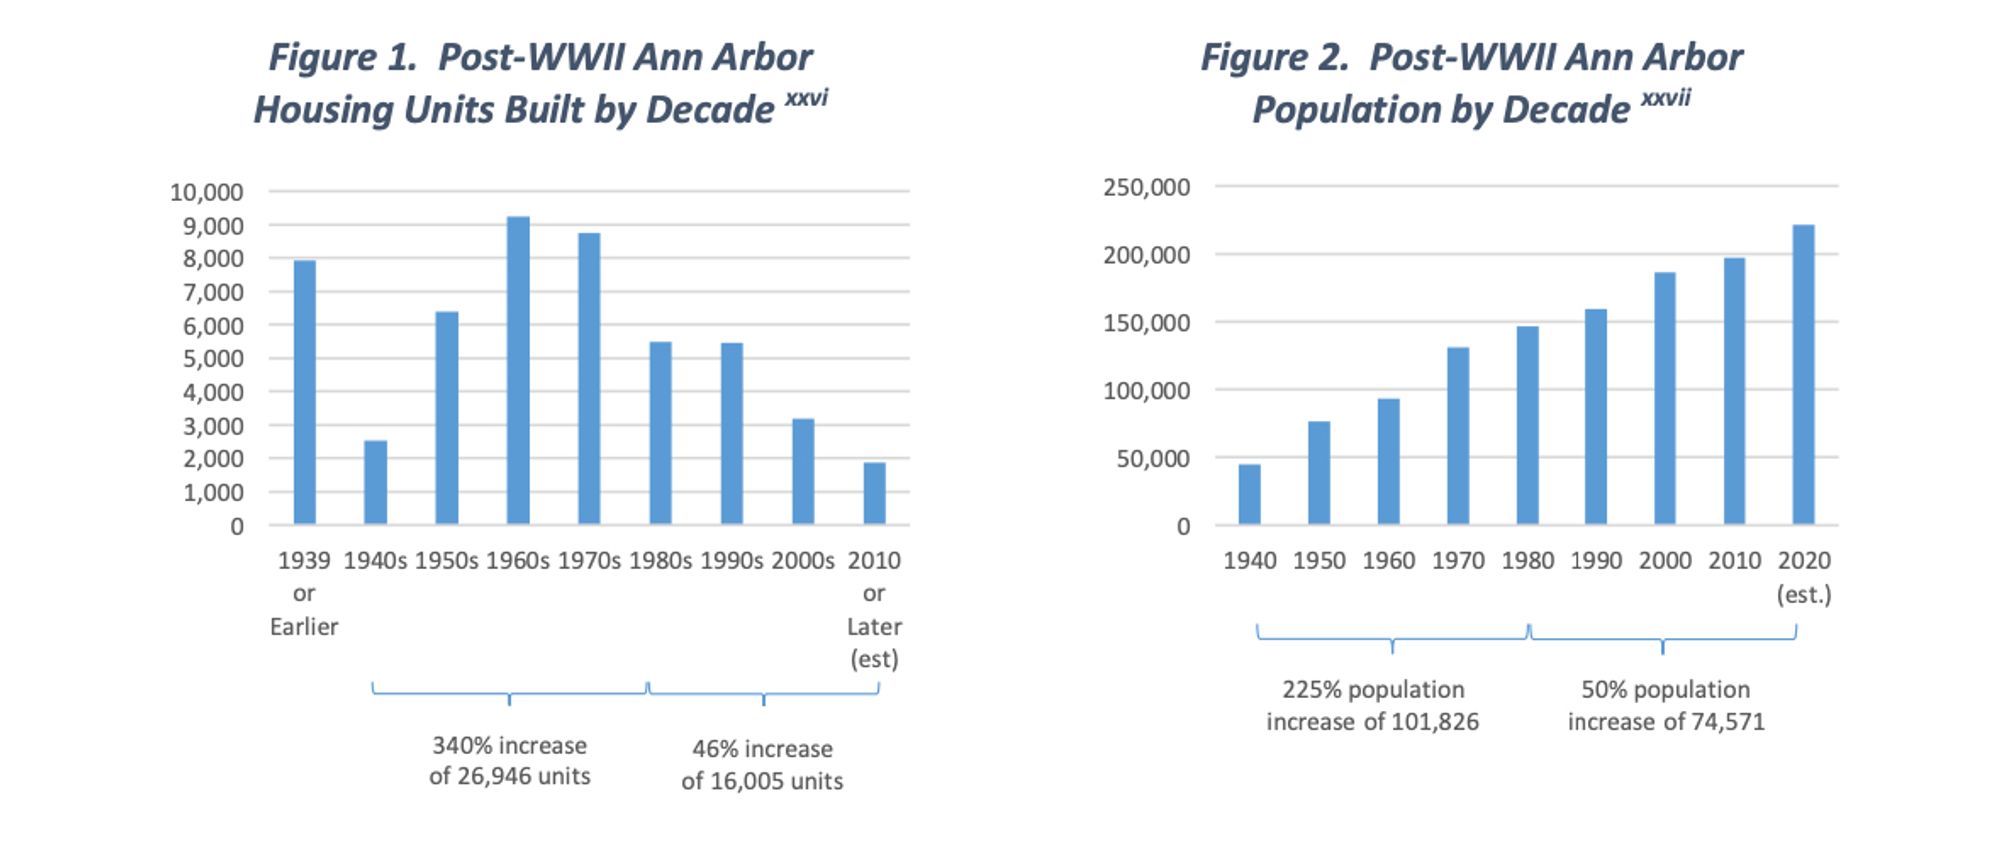
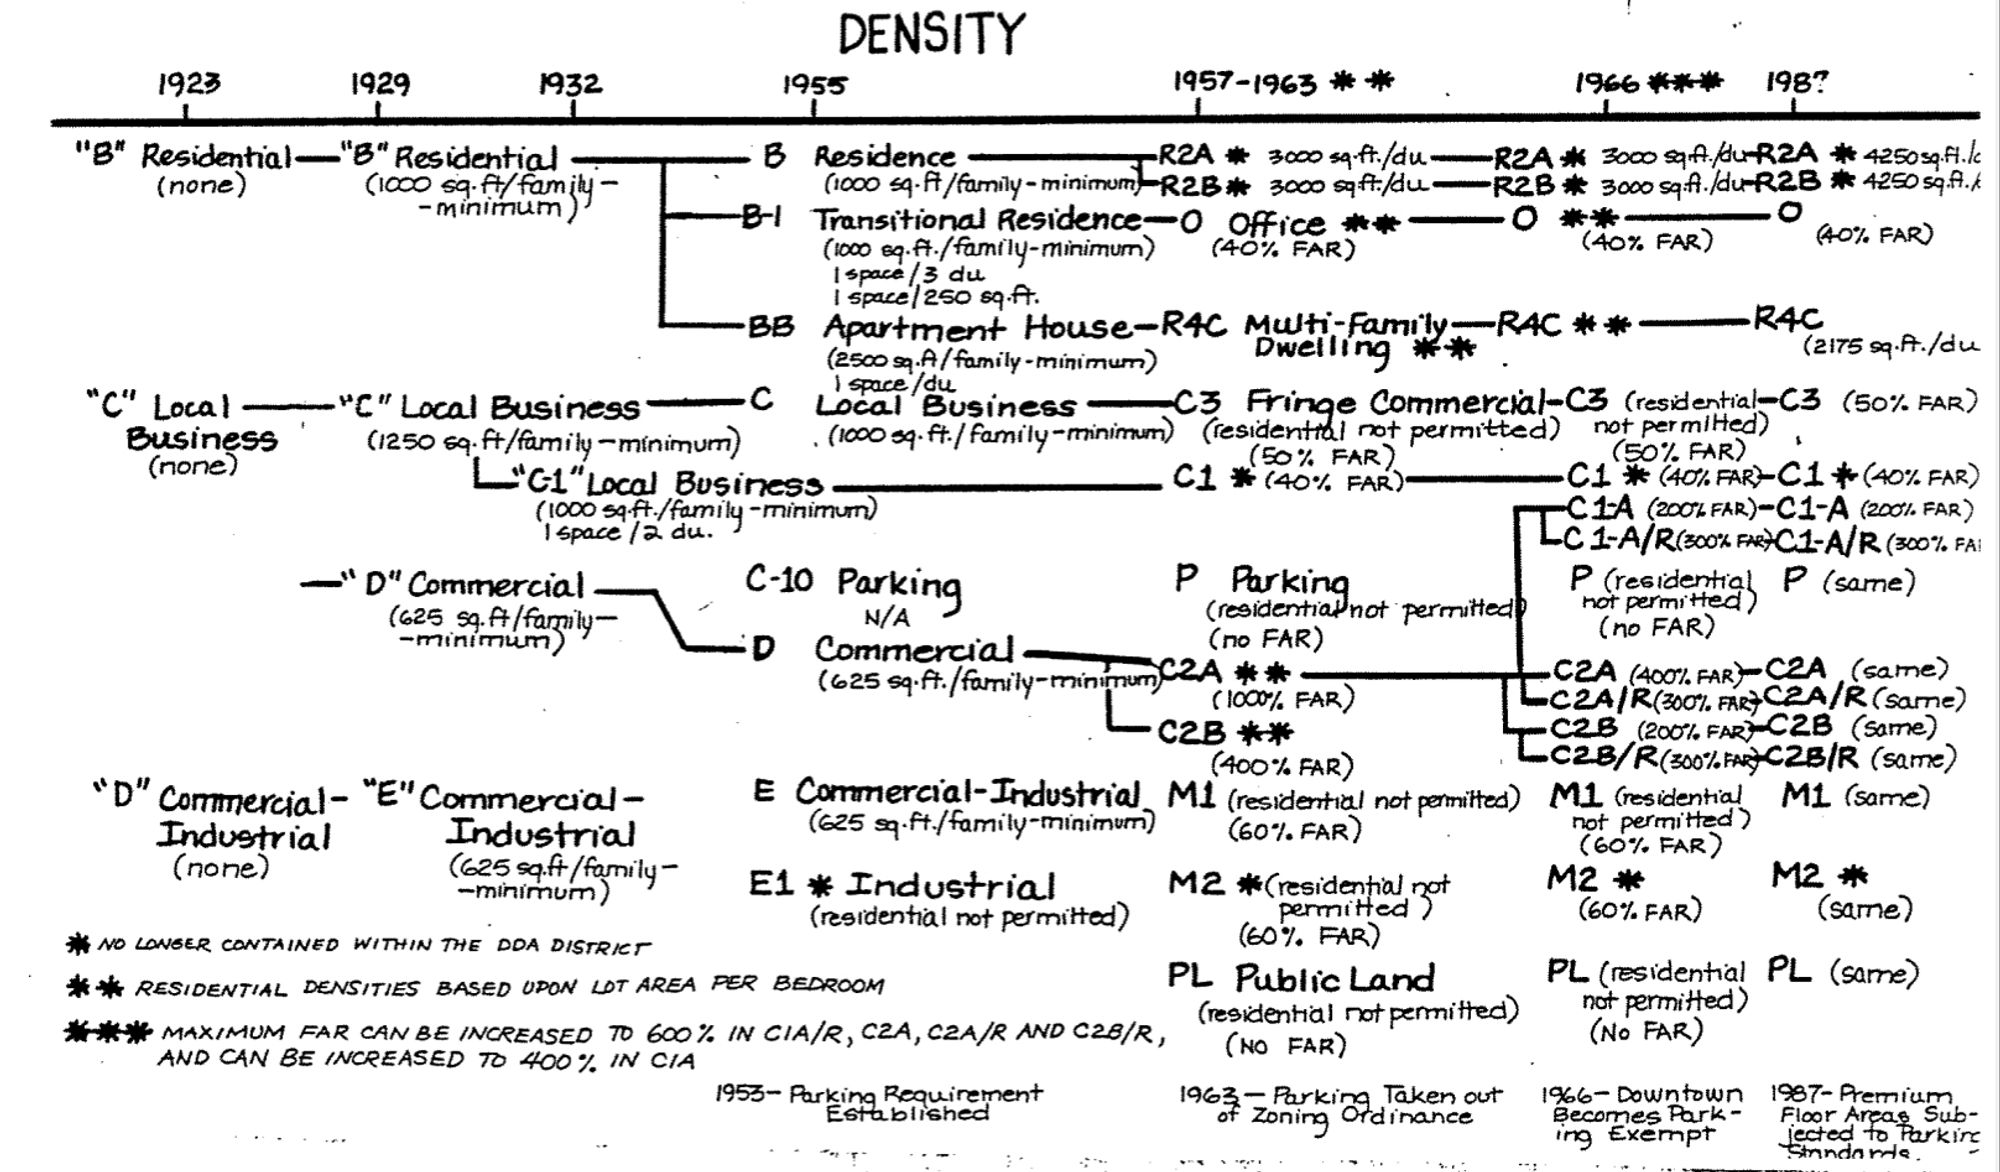
In 1923, lot sizes, height, & density weren't specified. From 1924 to 1980s minimum lot sizes increases from 1,000 sqft to 4,250 sqft. This limited housing options. Additionally, during that period, a whopping 26K housing units were constructed.
It was so boring. The jokes didn't land. I must not be the target audience. I wanted to laugh.