I discovered oceanography was a science but making Taylor columns on the ENSTA rotating tank with Gurvan Madec and Herve Le Treut as our lab instructors
I'm now able to ncview my first test sample! My initial plan was to have 3 different resolutions: spectra computed over square boxes of size 40 km, 20 km and 10 km ... this is taking forever to generate... so ... we'll see if we also include 10 km.

Do not worry, they are shipping more than the other 50% of that coal to other countries : it does not matter how much they use. What matters is how much is mined there.
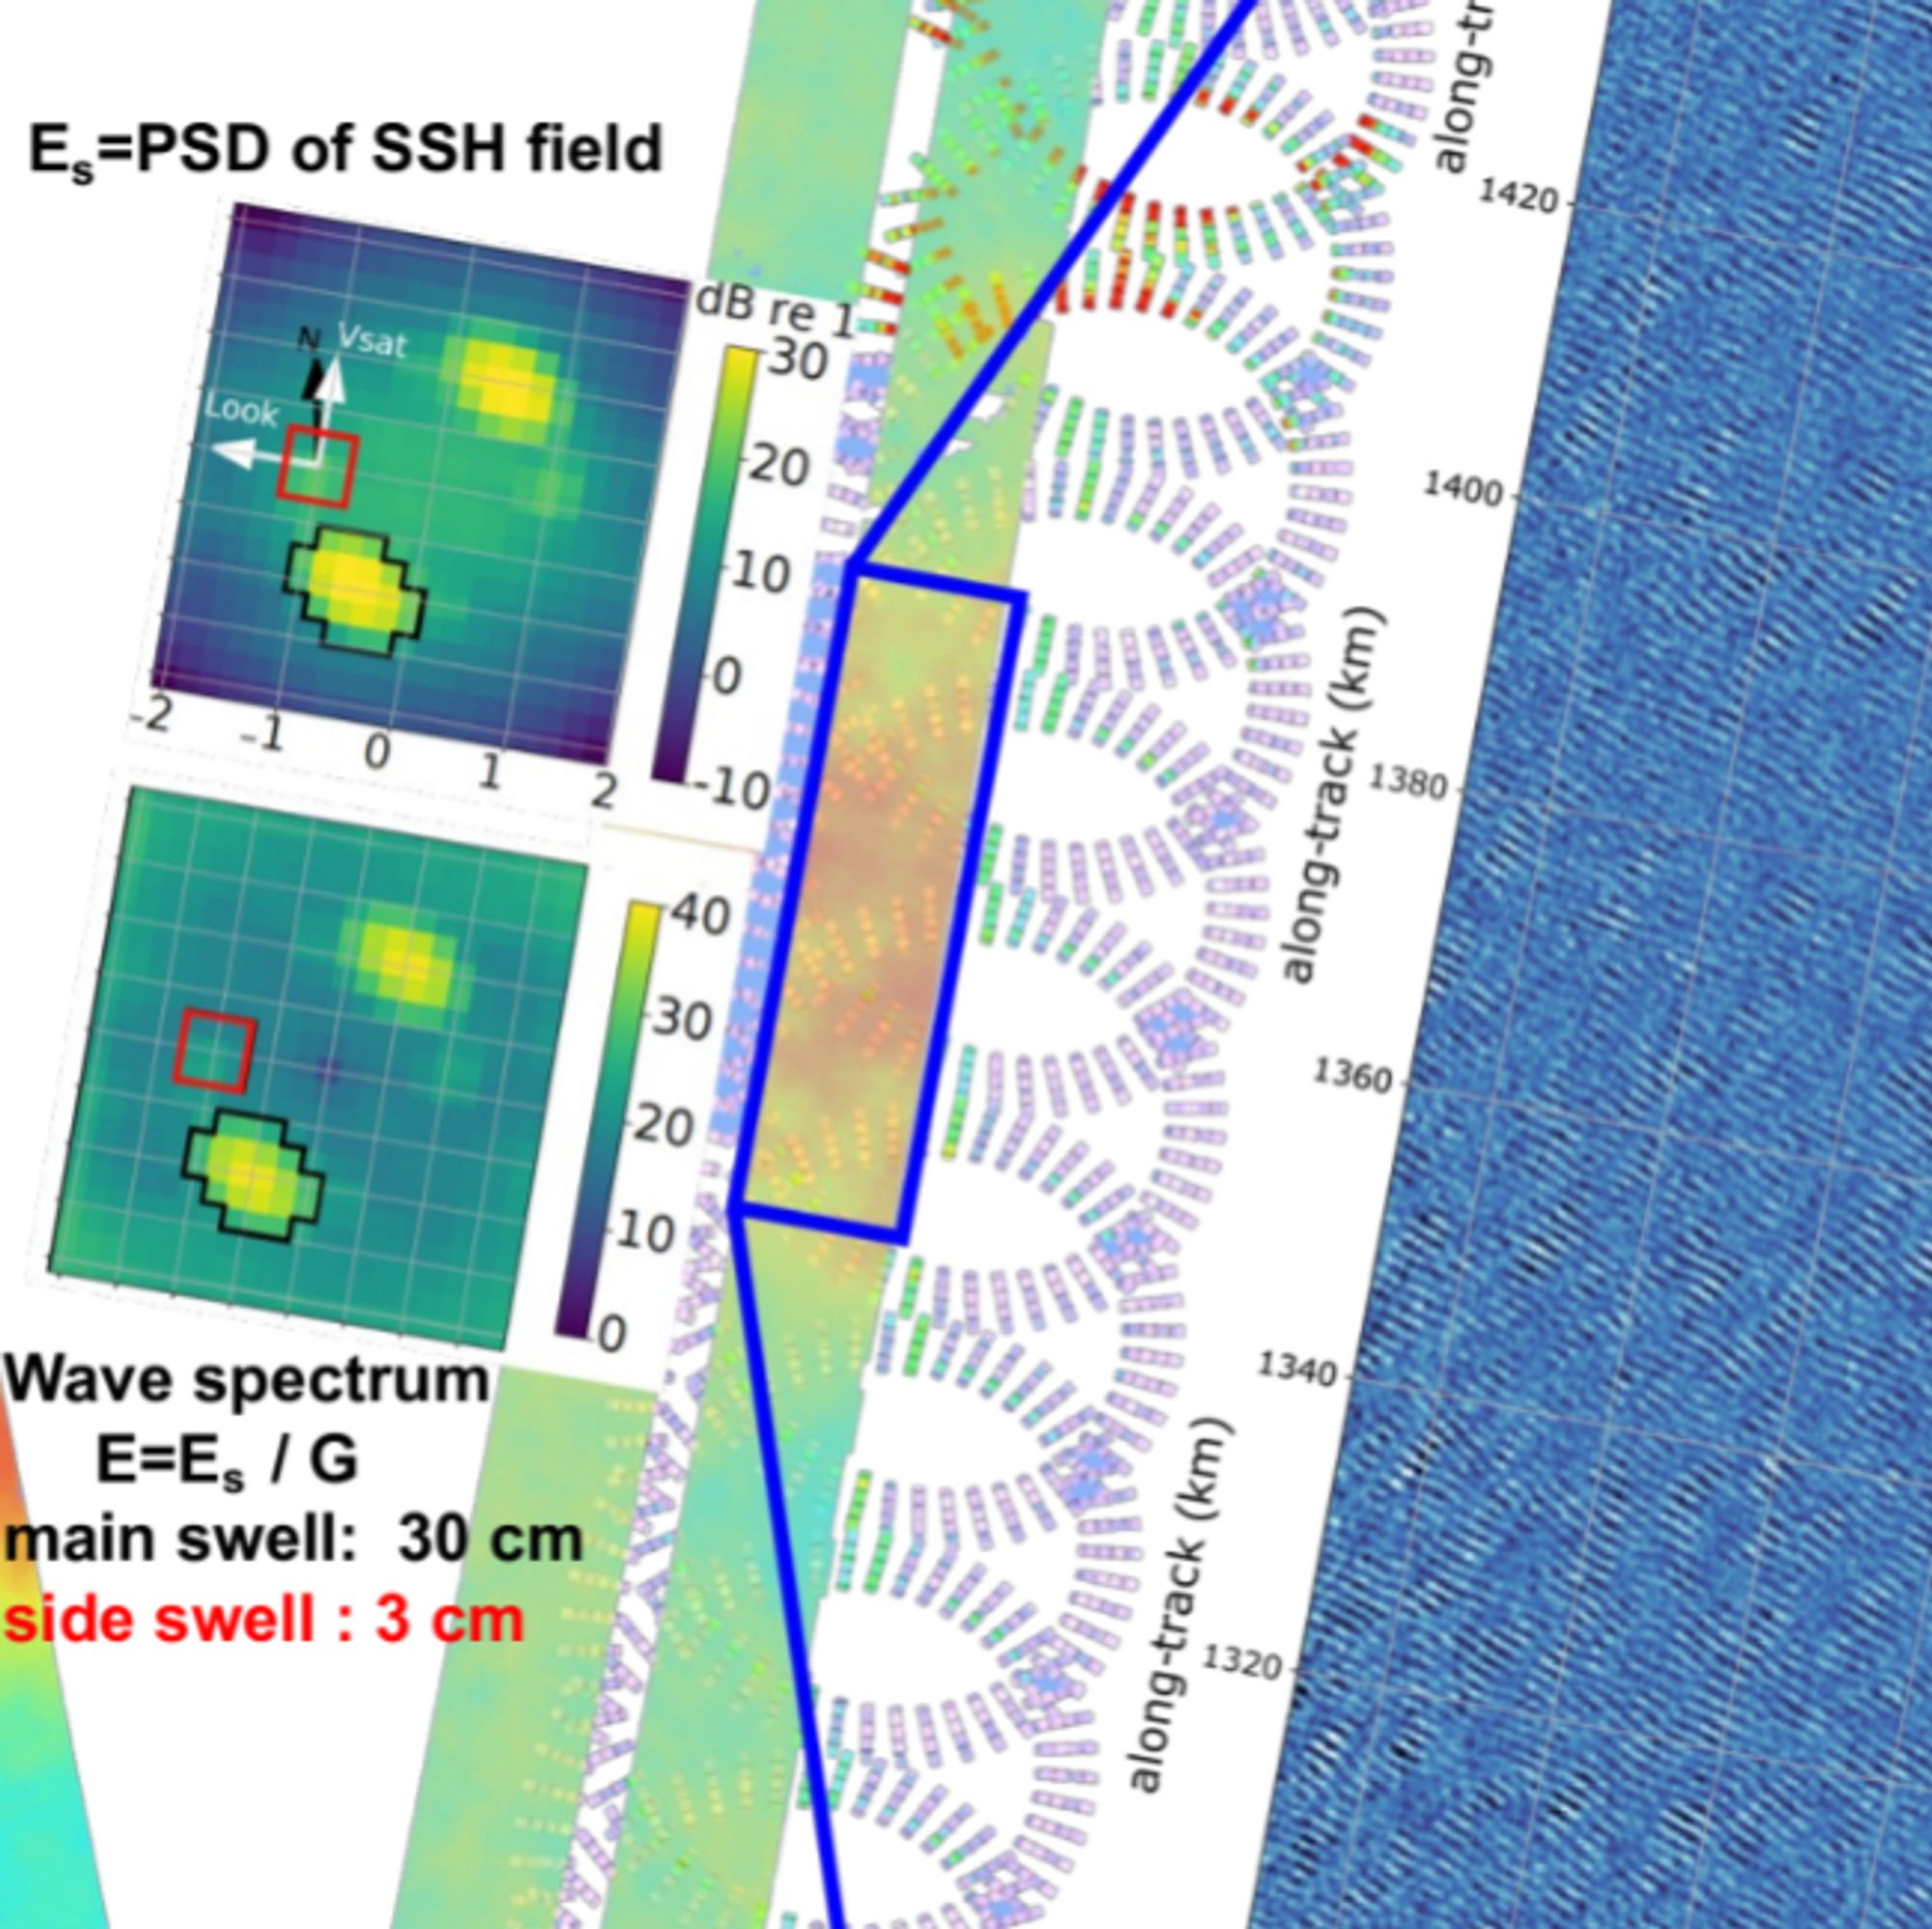
In this example of swells mapped by SWOT, we measure 3 cm high waves coming from islands 300 km away and scattered off at 70° from their incoming direction, superimposed on the 30 cm swells coming straight from the storm. These tiny waves tell something about the bathymetry around these islands.
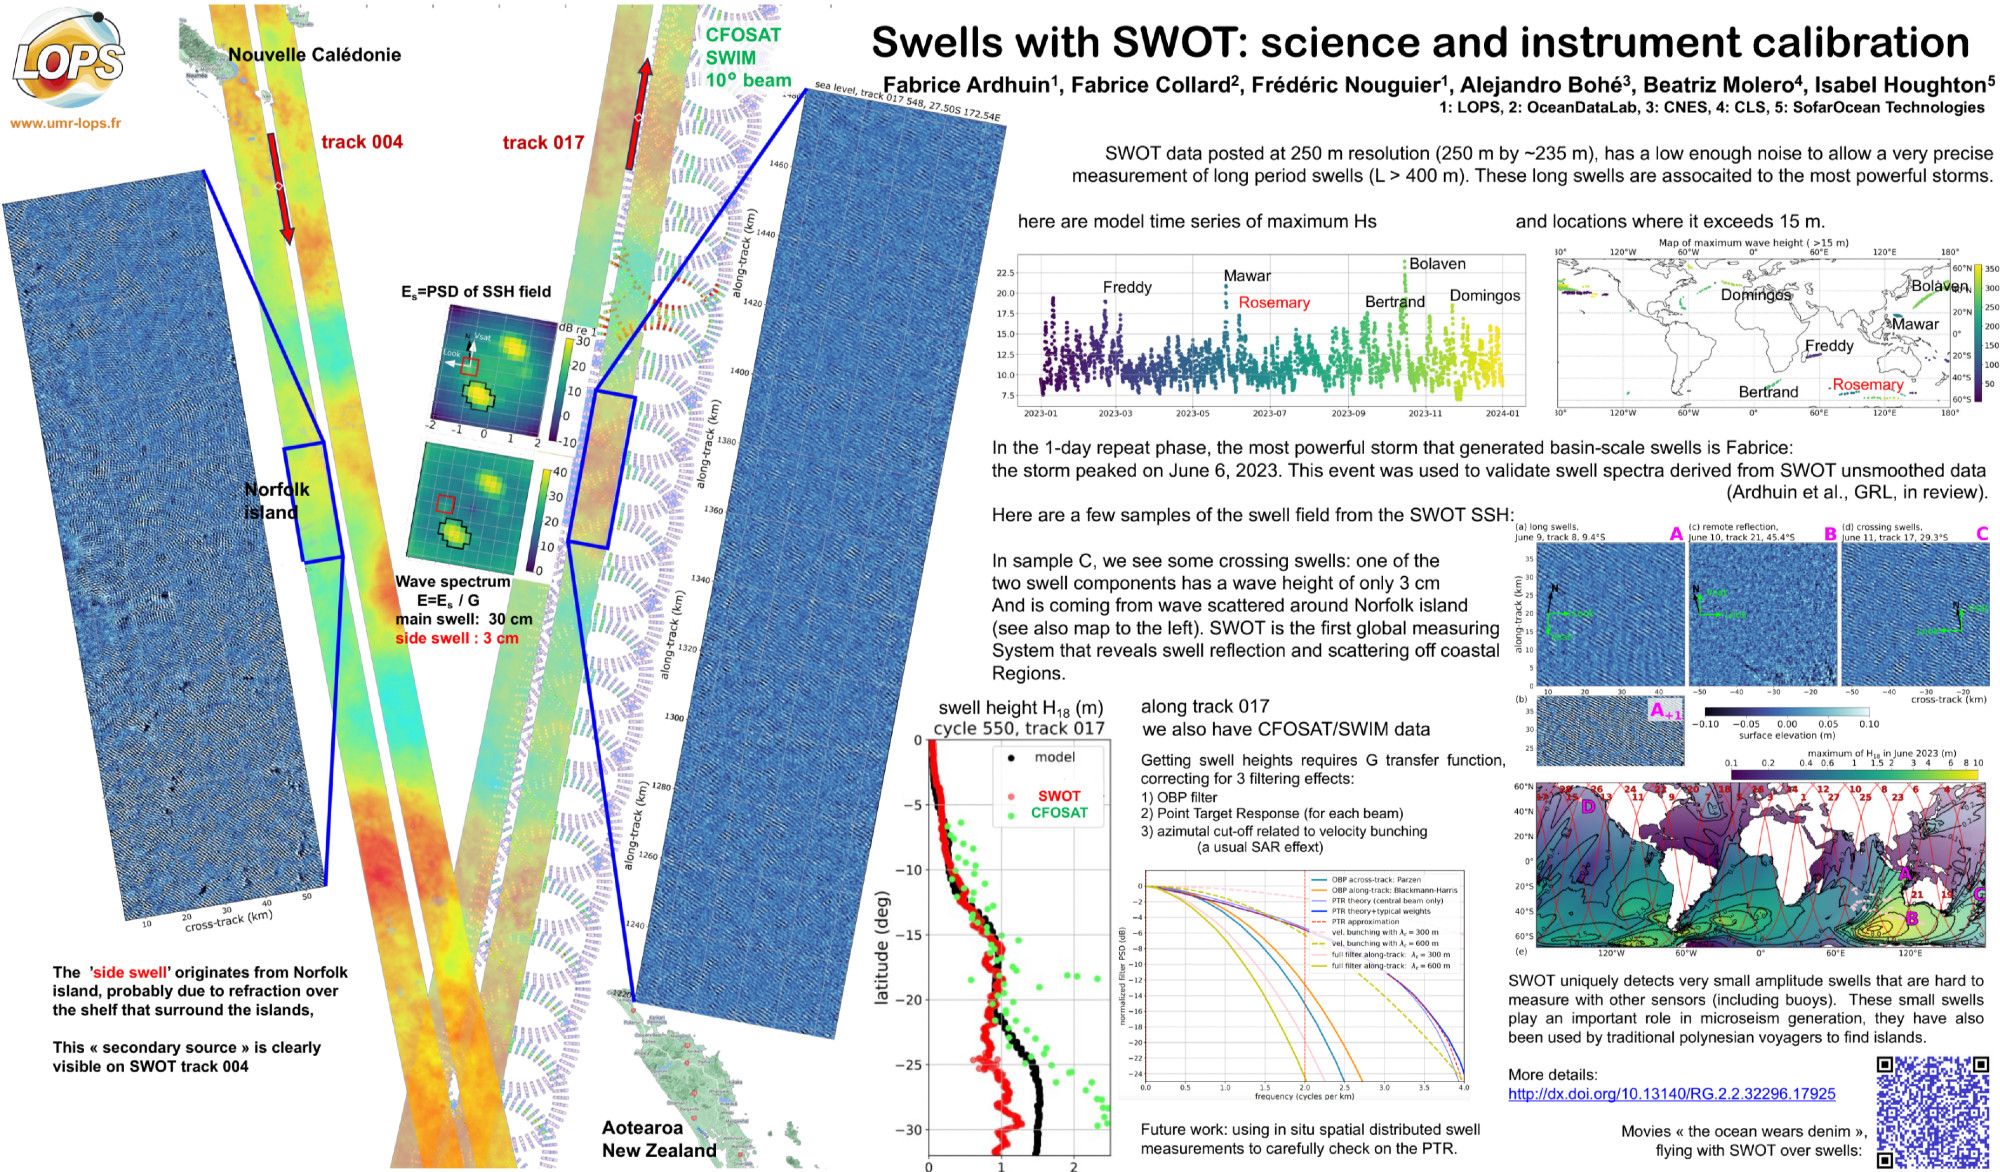
Being able to measure these signals, much weaker than what other sensors can pick out, opens many possibilities in the study of extreme storms, surface currents and coastal geomorphology !
C'est un peu court. Si on veut vraiment convaincre, on peut expliquer que le poids de l'atmosphère c'est 100 tonnes par m2, et que 0.04 % ça fait déjà 40 kg. Dit autrement une épaisseur de 1 m qui est très efficace pour absorber le rayonnement infrarouge . www.youtube.com/watch?v=kGaV...
YouTube video by m1der1
Who wrote that? Well, Walter of course ... www.annualreviews.org/content/jour...
That is for temperature. For other things like sea level, the lag is centuries. Sorry to water down the enthusiasm.
Et surtout le crédit impôt recherche !