You can also read Abrams et al.’s response here: https://doi.org/10.1073/pnas.2320028121 Let's keep the conversation going! 🗨️ #mortality #demography #lifeexpectancy
Different counterfactuals provide different perspectives, neither is ‘right’ or ‘wrong’. What do you think is the best way to analyze US life expectancy stagnation? Read our letter: https://doi.org/10.1073/pnas.2318276121@leverhulme.bsky.social@popassocamerica.bsky.social@eapsphd.bsky.social (6)
BOTTOM LINE: Working-age mortality is still an important driver of US life expectancy stagnation globally, but as Abrams et al. rightfully point out, we need to explore older-age slowdowns too. 📉 (5)BOTTOM LINE: Working-age mortality is still an important driver of US life expectancy stagnation globally, but as Abrams et al. rightfully point out, we need to explore older-age slowdowns too. 📉 (5)
We calculate an alternative counterfactual: What would US life expectancy be if 2010-19 age-specific mortality improved like in other high-income countries? 🌍 We find the opposite pattern: 25-64 mortality is more important than 65+ for explaining counterfactual differences. (4) We calculate an alternative counterfactual: What would US life expectancy be if 2010-19 age-specific mortality improved like in other high-income countries? 🌍 We find the opposite pattern: 25-64 mortality is more important than 65+ for explaining counterfactual differences. (4)
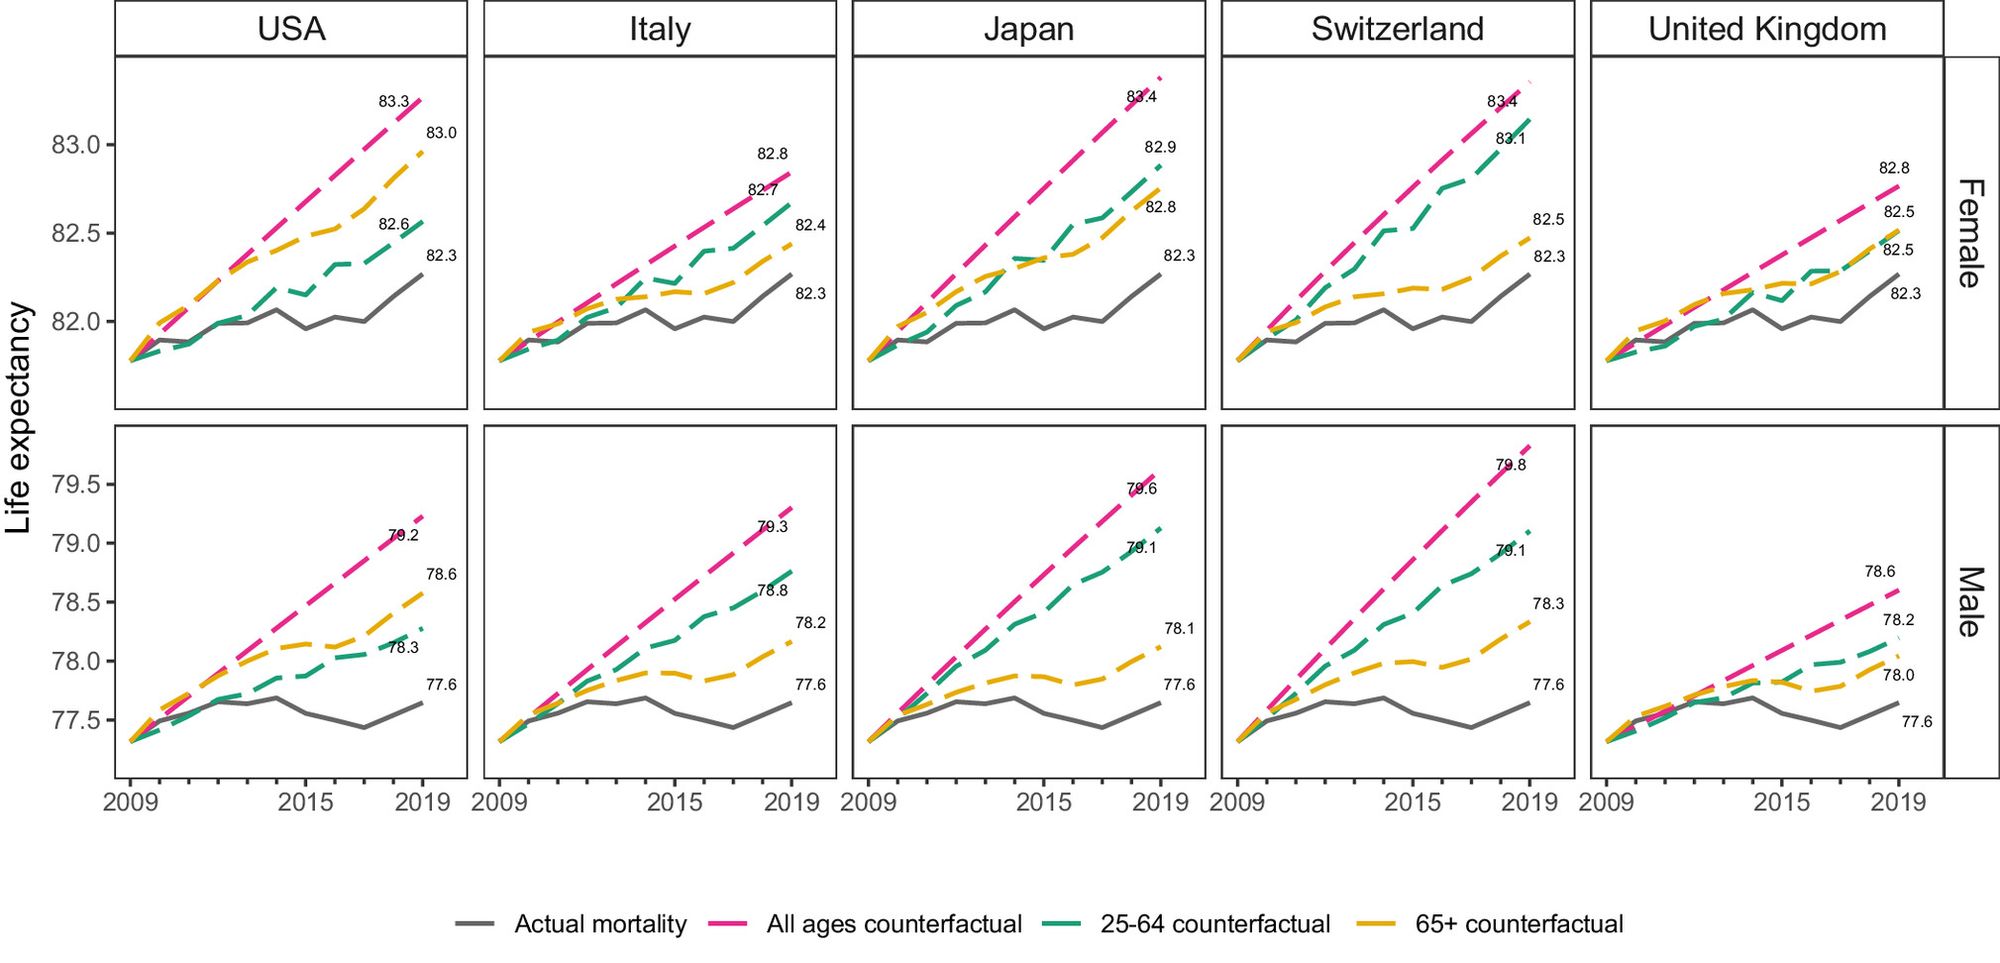
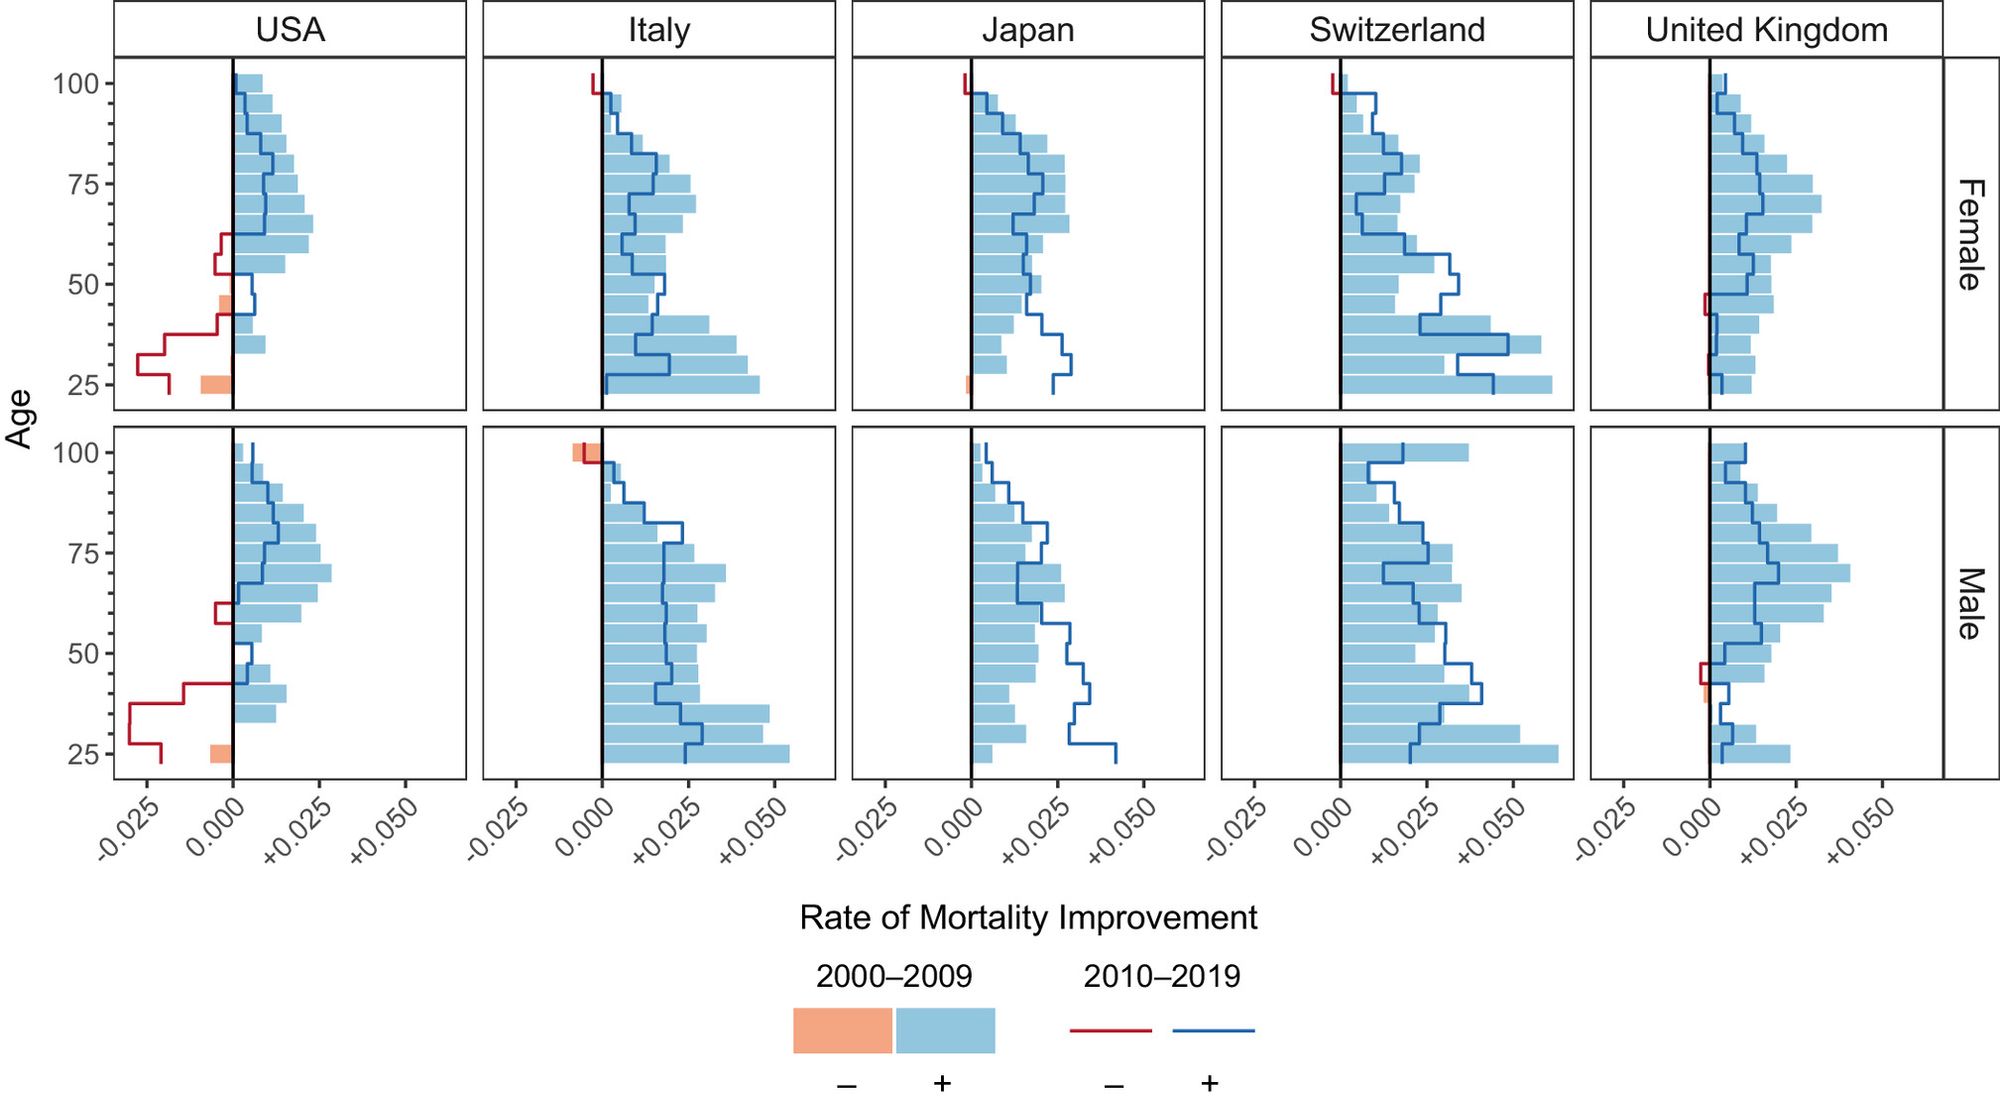
We question whether this within-US counterfactual tells the whole story for 2 reasons: - 25-64 US mortality was already stagnating in 2000-09, so less room to get worse. - 2010-19 slowdowns in 65+ mortality improvements were common globally, but rising 25-64 mortality wasn’t. (3)We question whether this within-US counterfactual tells the whole story for 2 reasons: - 25-64 US mortality was already stagnating in 2000-09, so less room to get worse. - 2010-19 slowdowns in 65+ mortality improvements were common globally, but rising 25-64 mortality wasn’t. (3)
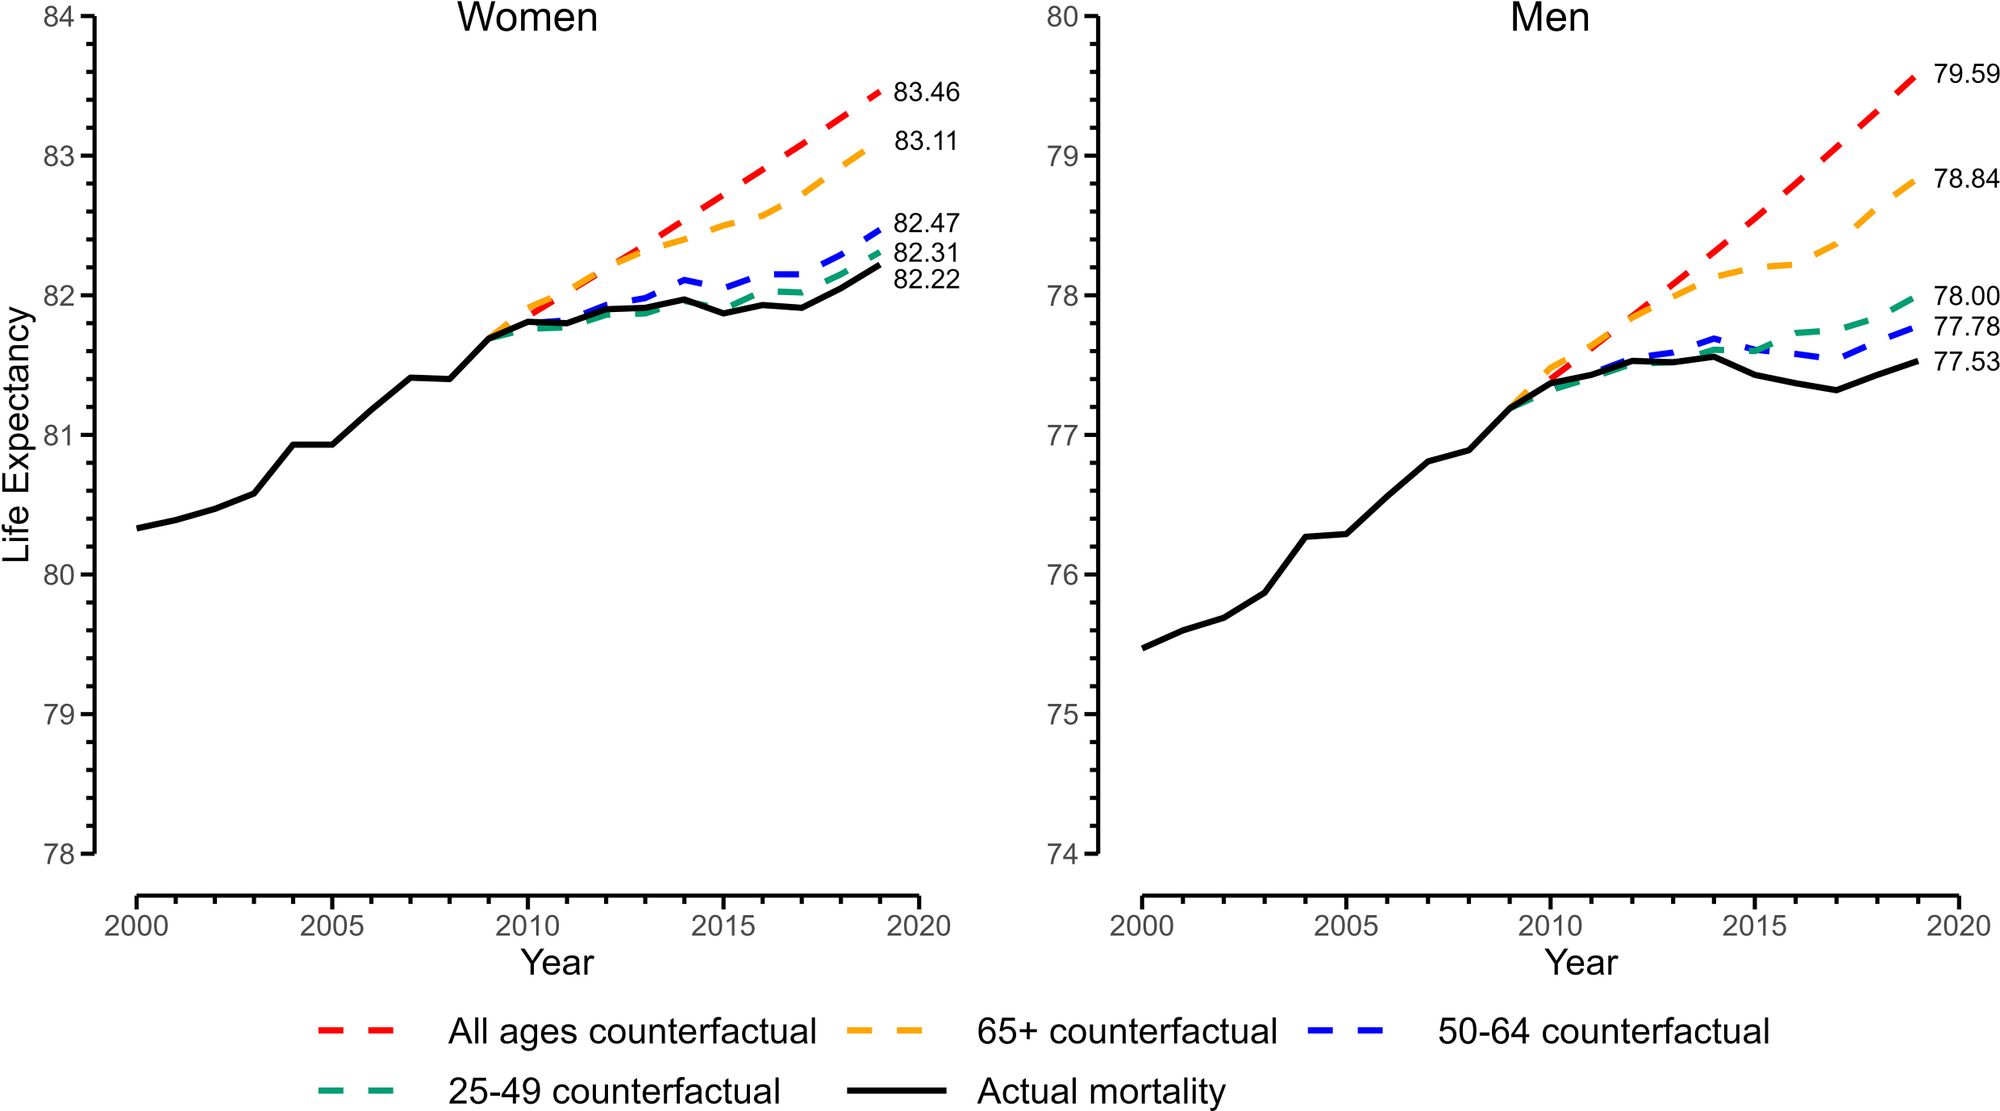
Abrams et al. calculated counterfactual US life expectancy in 2010-19 if annual age-specific mortality changes followed 2000-09 trends. Surprise finding: Slowdowns in 65+ mortality improvements explain more post-2010 stagnation than 25-64 mortality. https://doi.org/10.1073/pnas.2308360120 (2)
What’s the best way to analyze #lifeexpectancy stagnation in the US? 🤔 In PNAS, @drjenndowd.bsky.socialhttps://doi.org/10.1073/pnas.2318276121@oxforddemsci.bsky.social@nuffieldlibrary.bsky.social@mpidr.bsky.social (1)