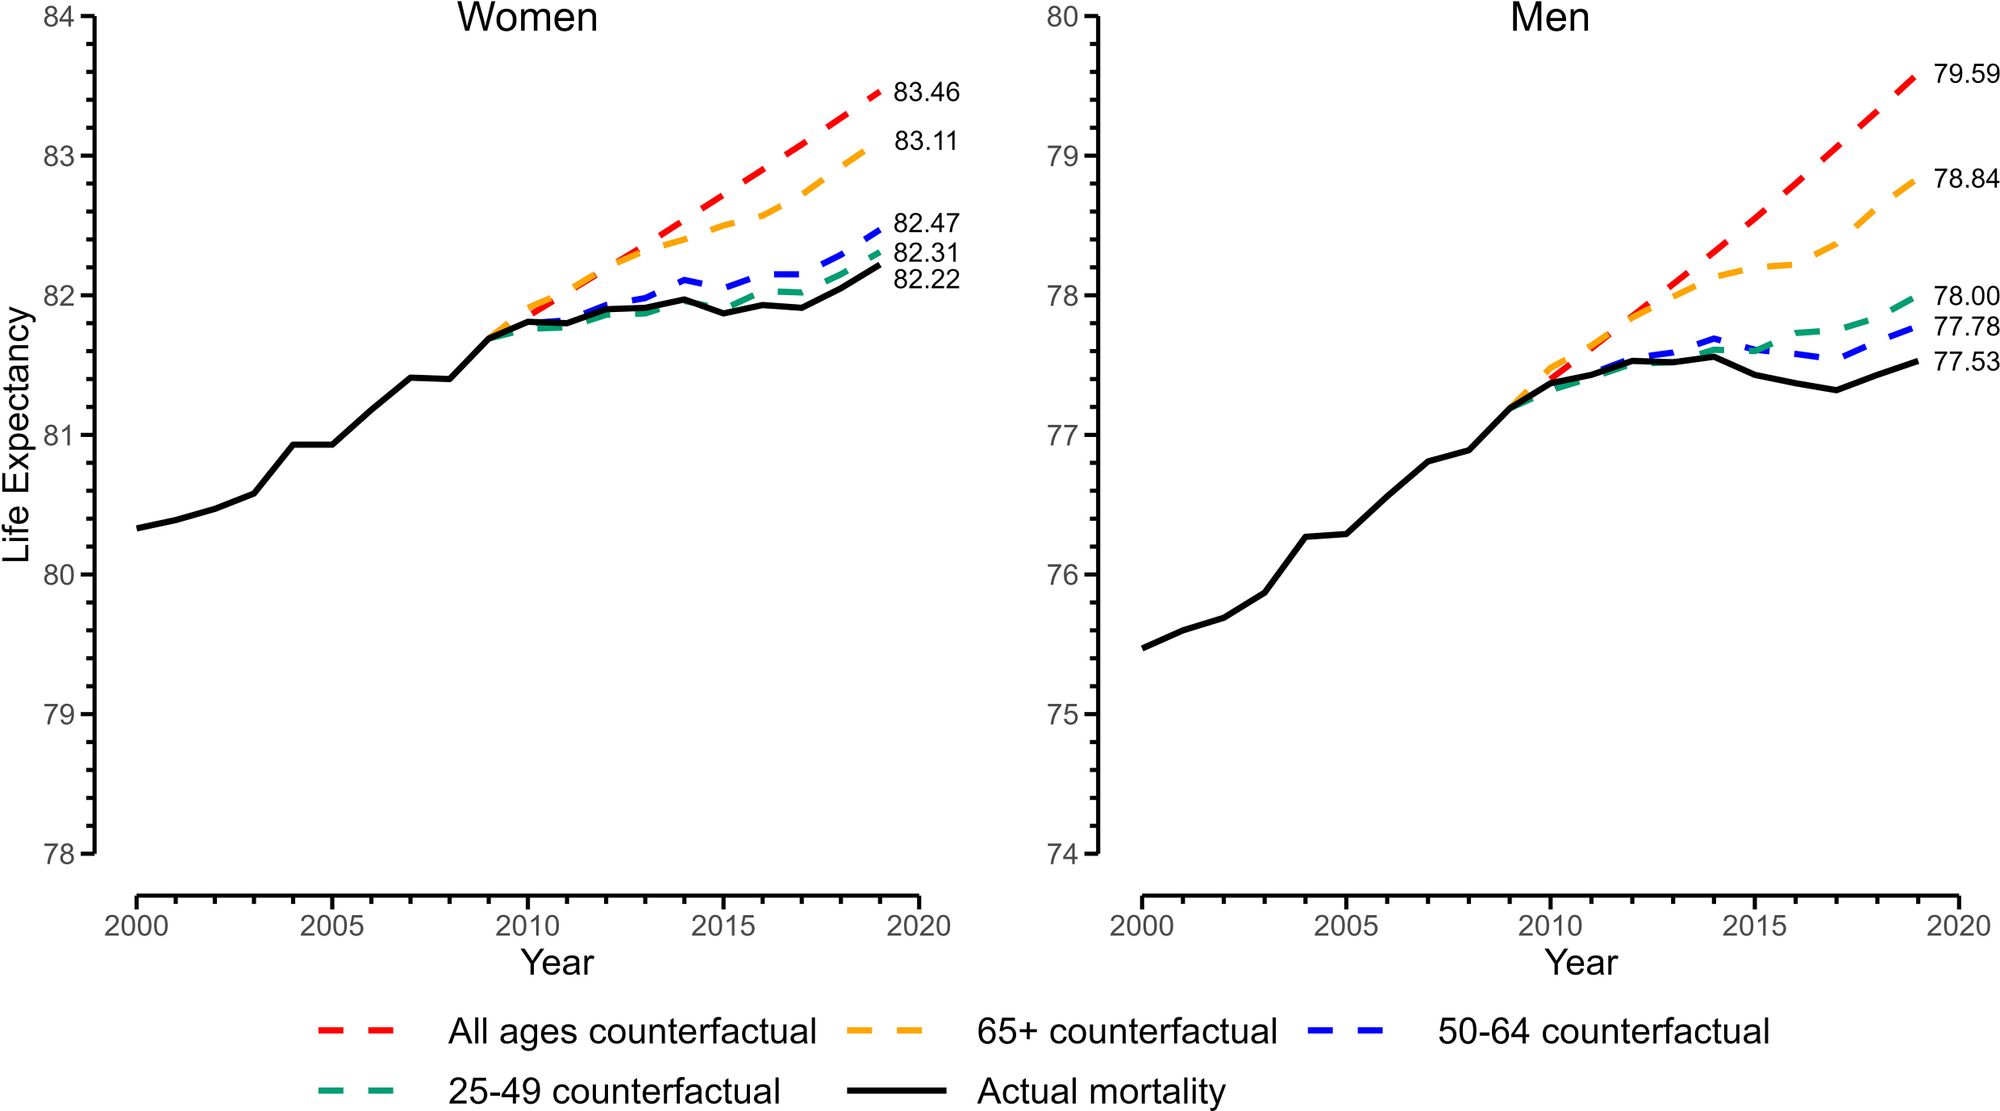
Abrams et al. calculated counterfactual US life expectancy in 2010-19 if annual age-specific mortality changes followed 2000-09 trends. Surprise finding: Slowdowns in 65+ mortality improvements explain more post-2010 stagnation than 25-64 mortality. https://doi.org/10.1073/pnas.2308360120 (2)
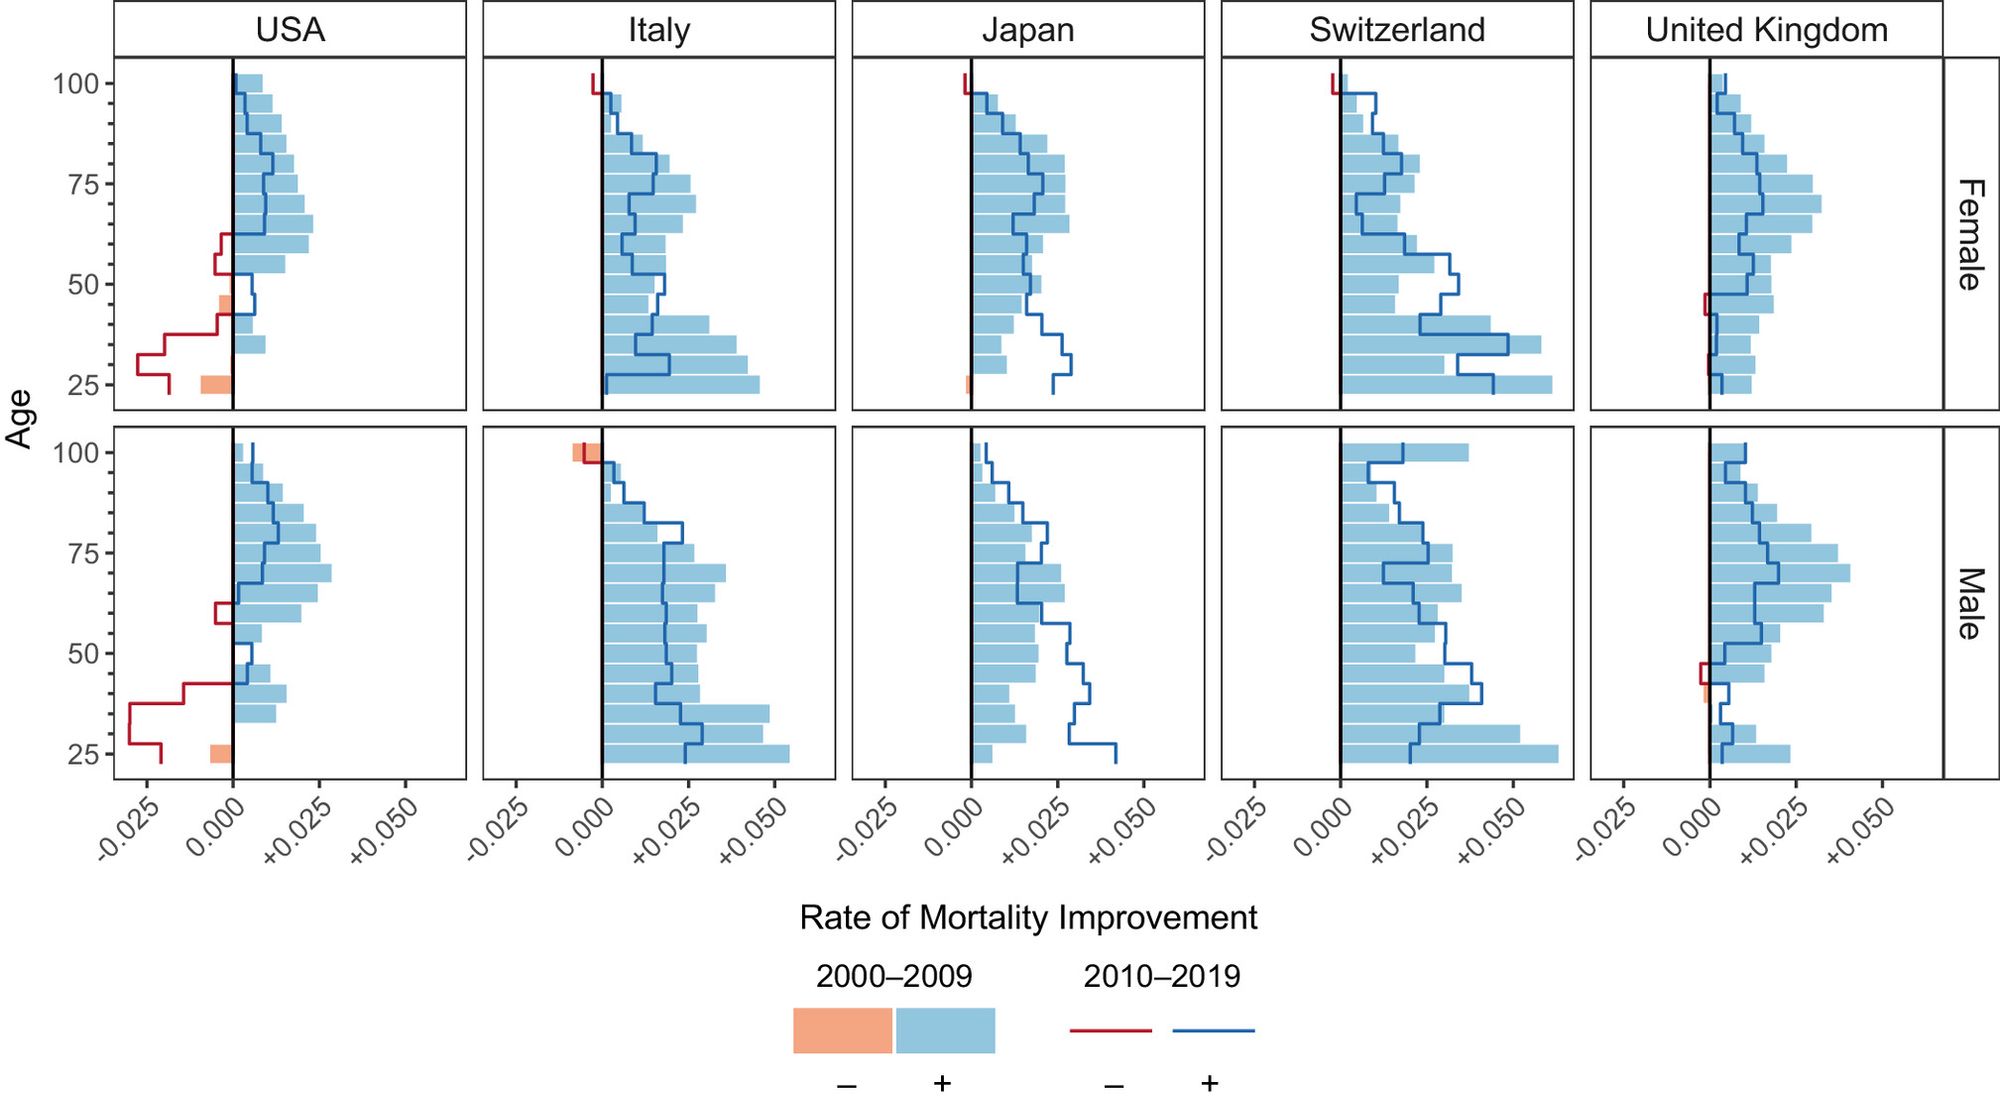
We question whether this within-US counterfactual tells the whole story for 2 reasons: - 25-64 US mortality was already stagnating in 2000-09, so less room to get worse. - 2010-19 slowdowns in 65+ mortality improvements were common globally, but rising 25-64 mortality wasn’t. (3)We question whether this within-US counterfactual tells the whole story for 2 reasons: - 25-64 US mortality was already stagnating in 2000-09, so less room to get worse. - 2010-19 slowdowns in 65+ mortality improvements were common globally, but rising 25-64 mortality wasn’t. (3)