Academics/PIs: How do you train people to make figures? Not philosophically- like what are your actual practices? (Please and thanks - Im hoping for ideas for how to improve in this area.)
R/ggPlot to make figures. inkscape or illustrator for beautification if necessary.
In my undergrad lab courses, we have conversations about what makes a good figure, including the goals of a figure. I ask them to examine figures in papers we’re reading, & talk about what they do well & what could be better.
A combo of approaches. I show good figures, bad figures, okay figures, and we discuss what we like and don’t like about them. I encourage them to read papers, go to talks, and see what they find effective. We make figures together then figure out how to optimize figure simplicity + max messaging.
I love the horrible figures approach (I can't remember who does that with a class but they used to post that assignment on twitter). Making a really bad figure makes you think about what makes a good figure.
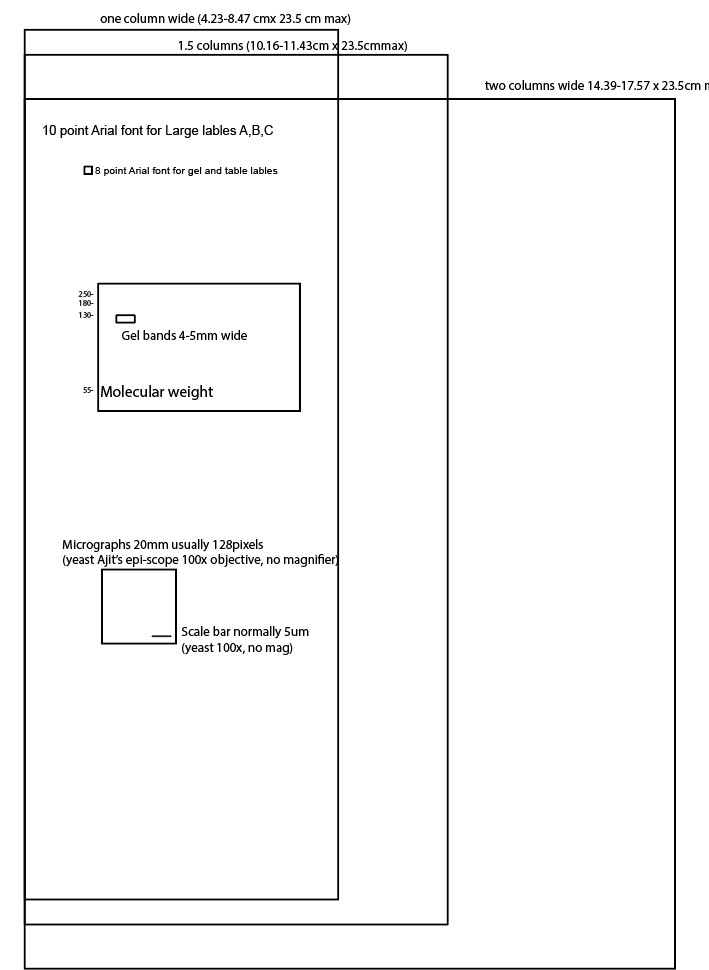
We have figure templates. One is an Illustrator file with the sizes for micrographs, gel bands, fonts, and overall figure size. Another is a GraphPad Prism file with some of the common chart types and the sizes of commonly used objects (bars, dots). 1/🧵
I try to ensure Lab meetings and journal clubs devote some of their time discussing papers to talking about the visuals- not just the scientific content but the efficacy of the visuals.
You should post a summary of the replies you get; I imagine _a lot_ of people would be interested.
Within the xenon collaboration we made some standard size, color choices mandatory which helped quite a bit with the most common issues
What kind of figure? Like, basic bar charts and scatter plots? Micrographs? Animal reconstructions? The range of what goes into figures is huge and rewrites a bunch of different approaches.
1) if it is not B&W, choose a nice color palette 2) make it clear and use large labels so that the numbers/annotations can be read from a distance 3) if there's a lot of information, try using contours, color bars or separating it into more panels 4) show it to a colleague and ask for the main point