BLUE
DS
Dr. Scott W. Fleming
@scottwfleming.bsky.social
Branch Manager at Space Telescope Science Institute working in the MAST archive. Astronomy PhD. Studies stars and exoplanets. Loves programming. Opinions are my own. He/Him/His
197 followers198 following78 posts
Reposted by Dr. Scott W. Fleming
BMbrettmorr.is

Here's how to use lcviz to load Kepler photometry of transiting hot Jupiter HAT-P-7 b to find the secondary eclipse. That's the dip in brightness as the red-hot planet moves behind the host star. You can use this eclipse depth to measure the dayside temperature on this ~2700 K planet. 🔭🪐🧪 #stars

0
DSscottwfleming.bsky.social

Oops my bad! Go with the ad information not my post!

0
DSscottwfleming.bsky.social

There is not guaranteed research time but we support buyback. Knowing the branch manager in this case, up to 20% buyback can be supported without much difficulty, more than that would be up to discussion with the manager.

1
DSscottwfleming.bsky.social

My Division is hiring a Level II Astronimical Data Scientist! Do you have a PhD in astronomy, are skilled working in Python, experienced working with catalogs and databases, and have some familiarity with working in the cloud? Apply here by November 30th! 🔭 recruiting2.ultipro.com/SPA1004AURA/...

4
DSscottwfleming.bsky.social

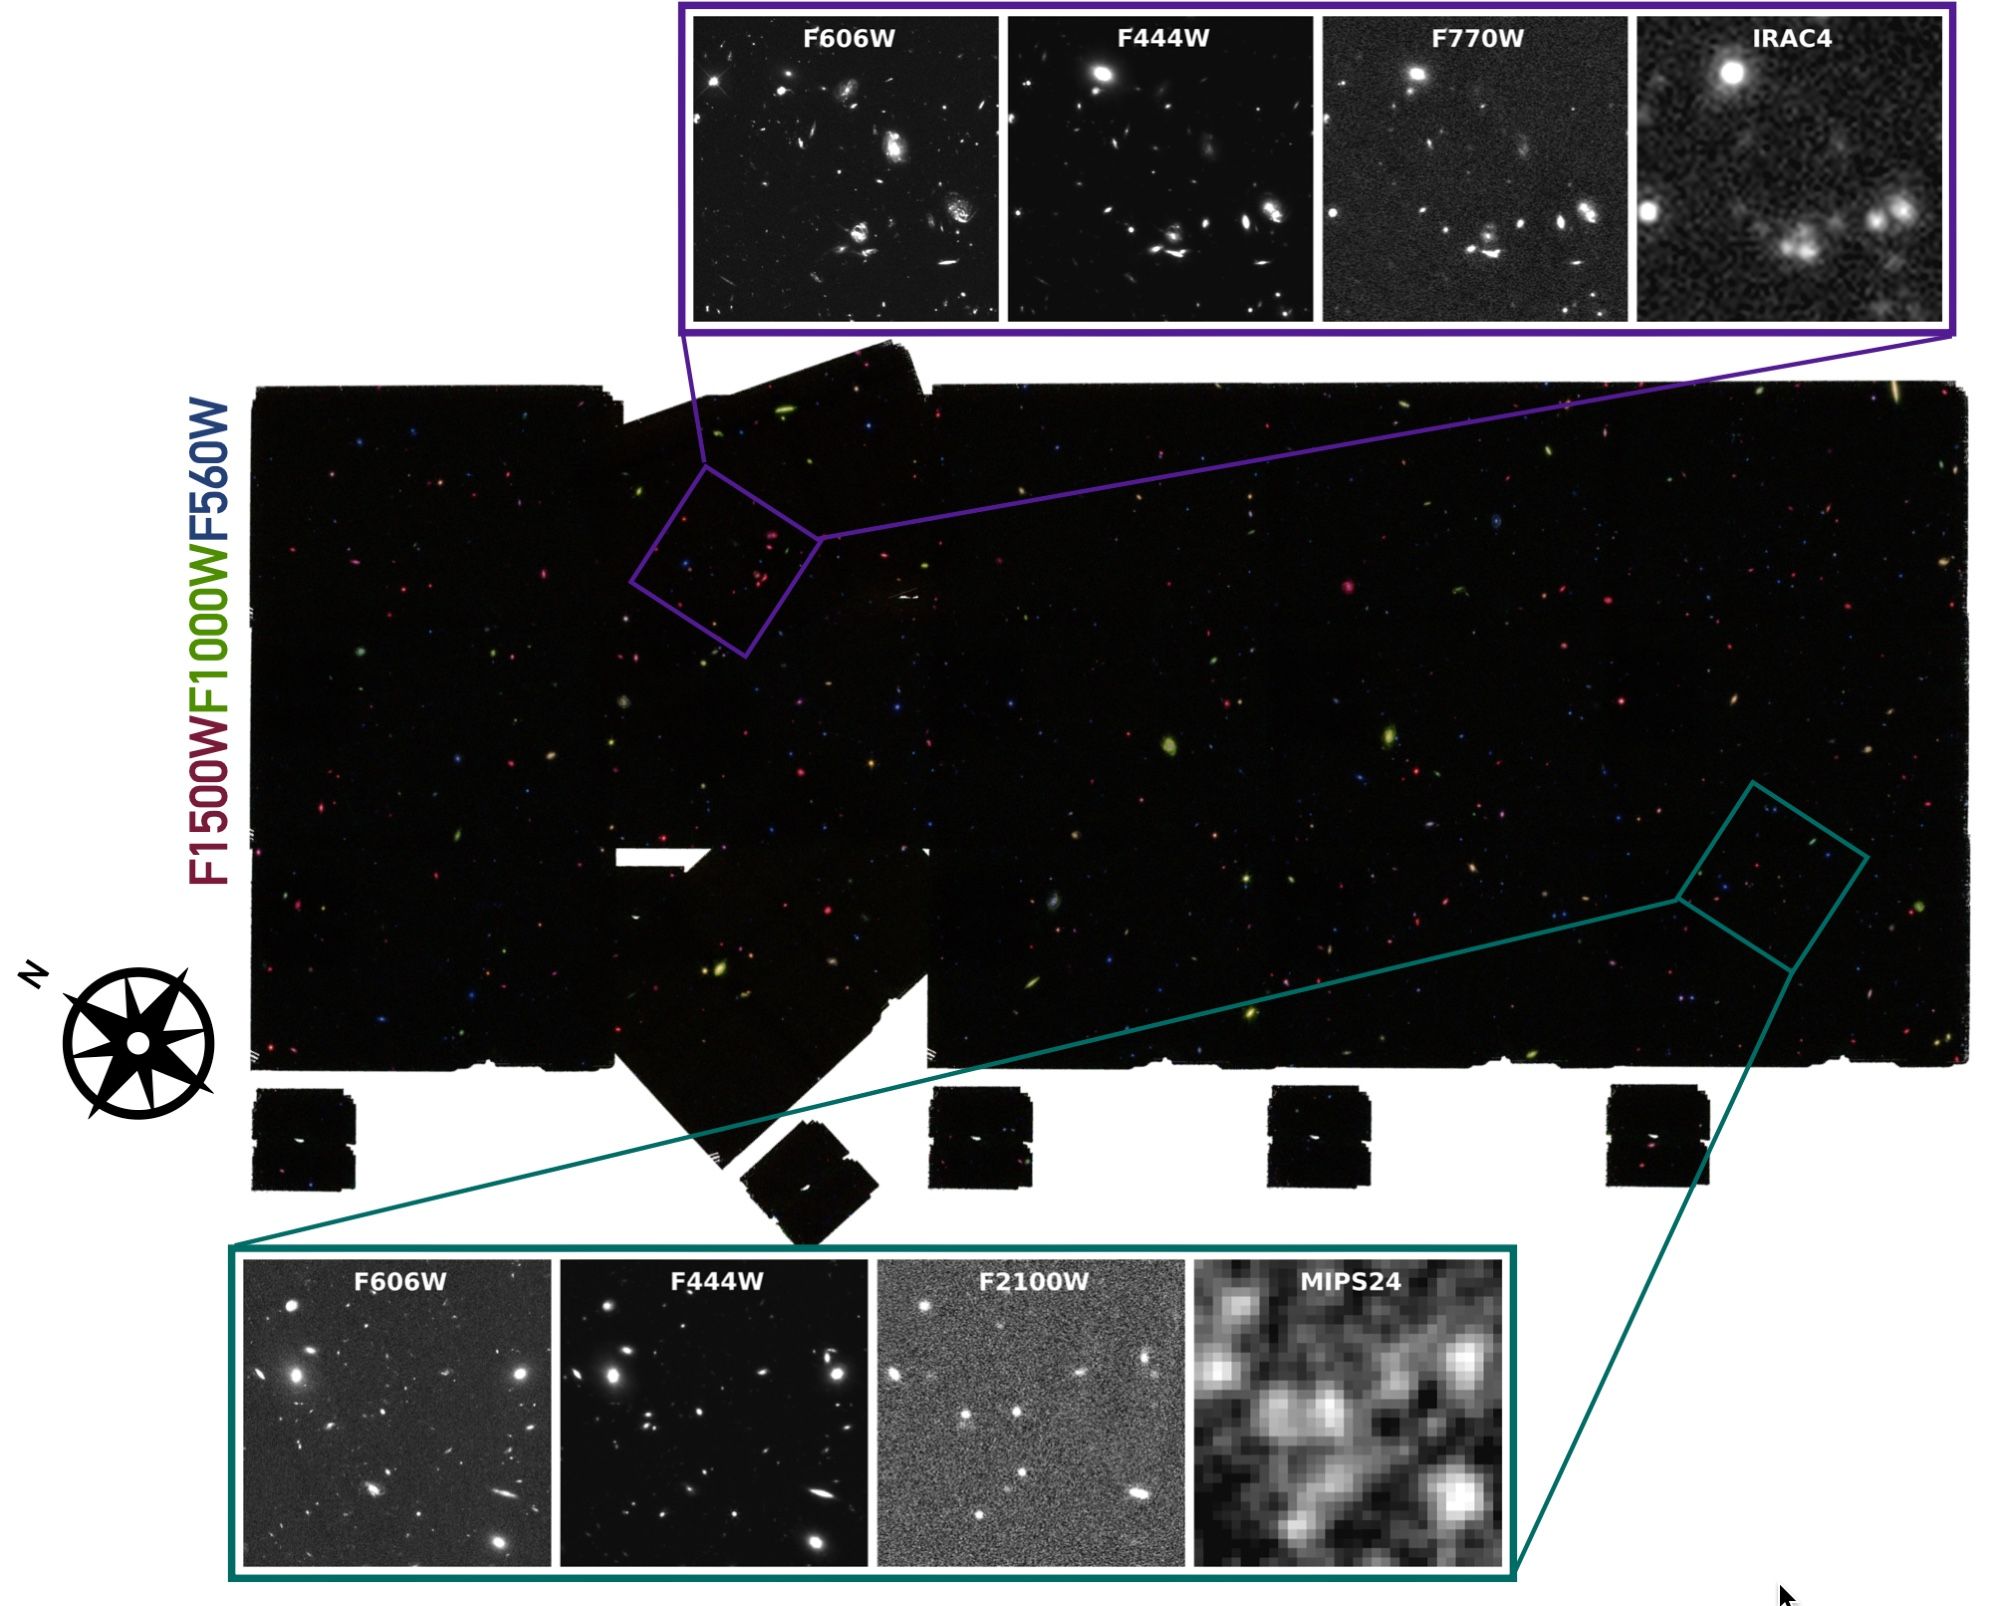
New HLSP: SMILES is a 34 sq arcmin multi-band JWST/MIRI imaging survey of the GOODS-S/HUDF region with NIRSpec follow-up, aimed at "cosmic noon" science 🕛. Its first data release presents custom-reduced mosaics in 8 MIRI bands & a photometric catalog: archive.stsci.edu/hlsp/smiles 🔭

Red, green, and blue galaxies speckle a black rectangle representing representing the survey footprint. Above and below the footprint are smaller squares showing two zoomed-in regions in different filters. The views range from sharply resolved galaxies with spiral arms and dust lanes visible against the dark background, to barely resolved blobs of light amidst a speckled, gray background.
0
DSscottwfleming.bsky.social

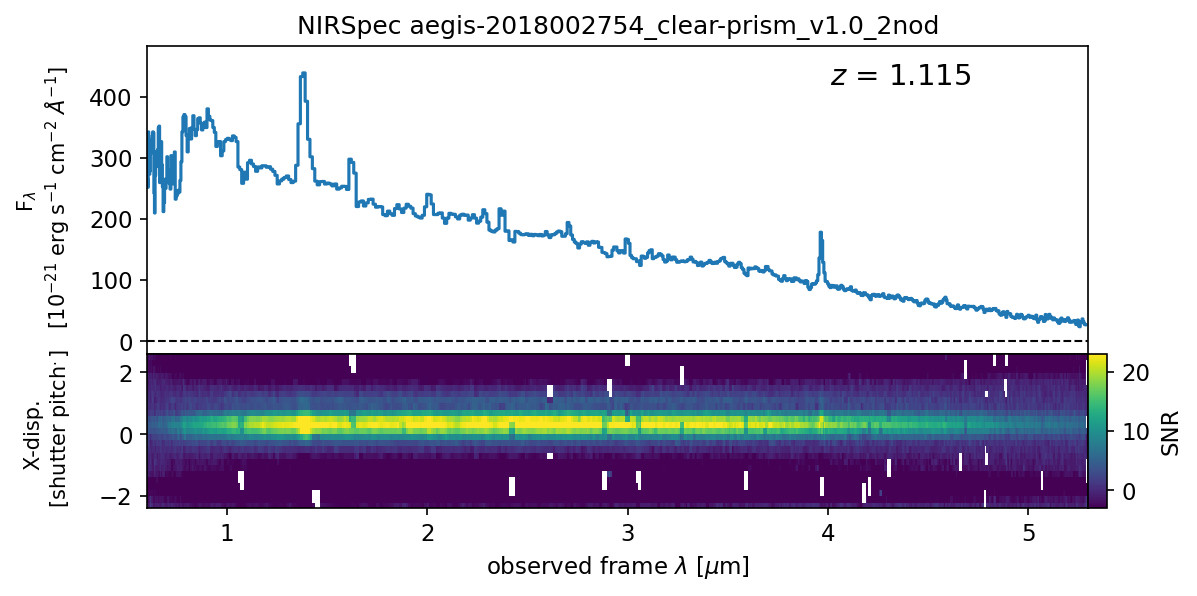
New HLSP: The WIDE Survey releases reduced JWST/NIRSpec spectra from the first 5 (of 31) pointings from the CANDELS/AEGIS fields, each with an average of 135 galaxies. 2D and 1D extracted spectra from low-resolution PRISM and high-resolution gratings! archive.stsci.edu/hlsp/wide 🔭

This image has two panels showing a 1D and 2D spectrum of the same galaxy. The top panel shows the 1D spectrum as a blue line with peaks and dips at various emission and absorption features. The bottom panel shows the 2D spectrum as a blue-to-yellow heatmap. The spectrum peaks are now represented by bright yellow features, while the dips are represented by bluish lines crossing the yellow-colored spectrum.
0
DSscottwfleming.bsky.social

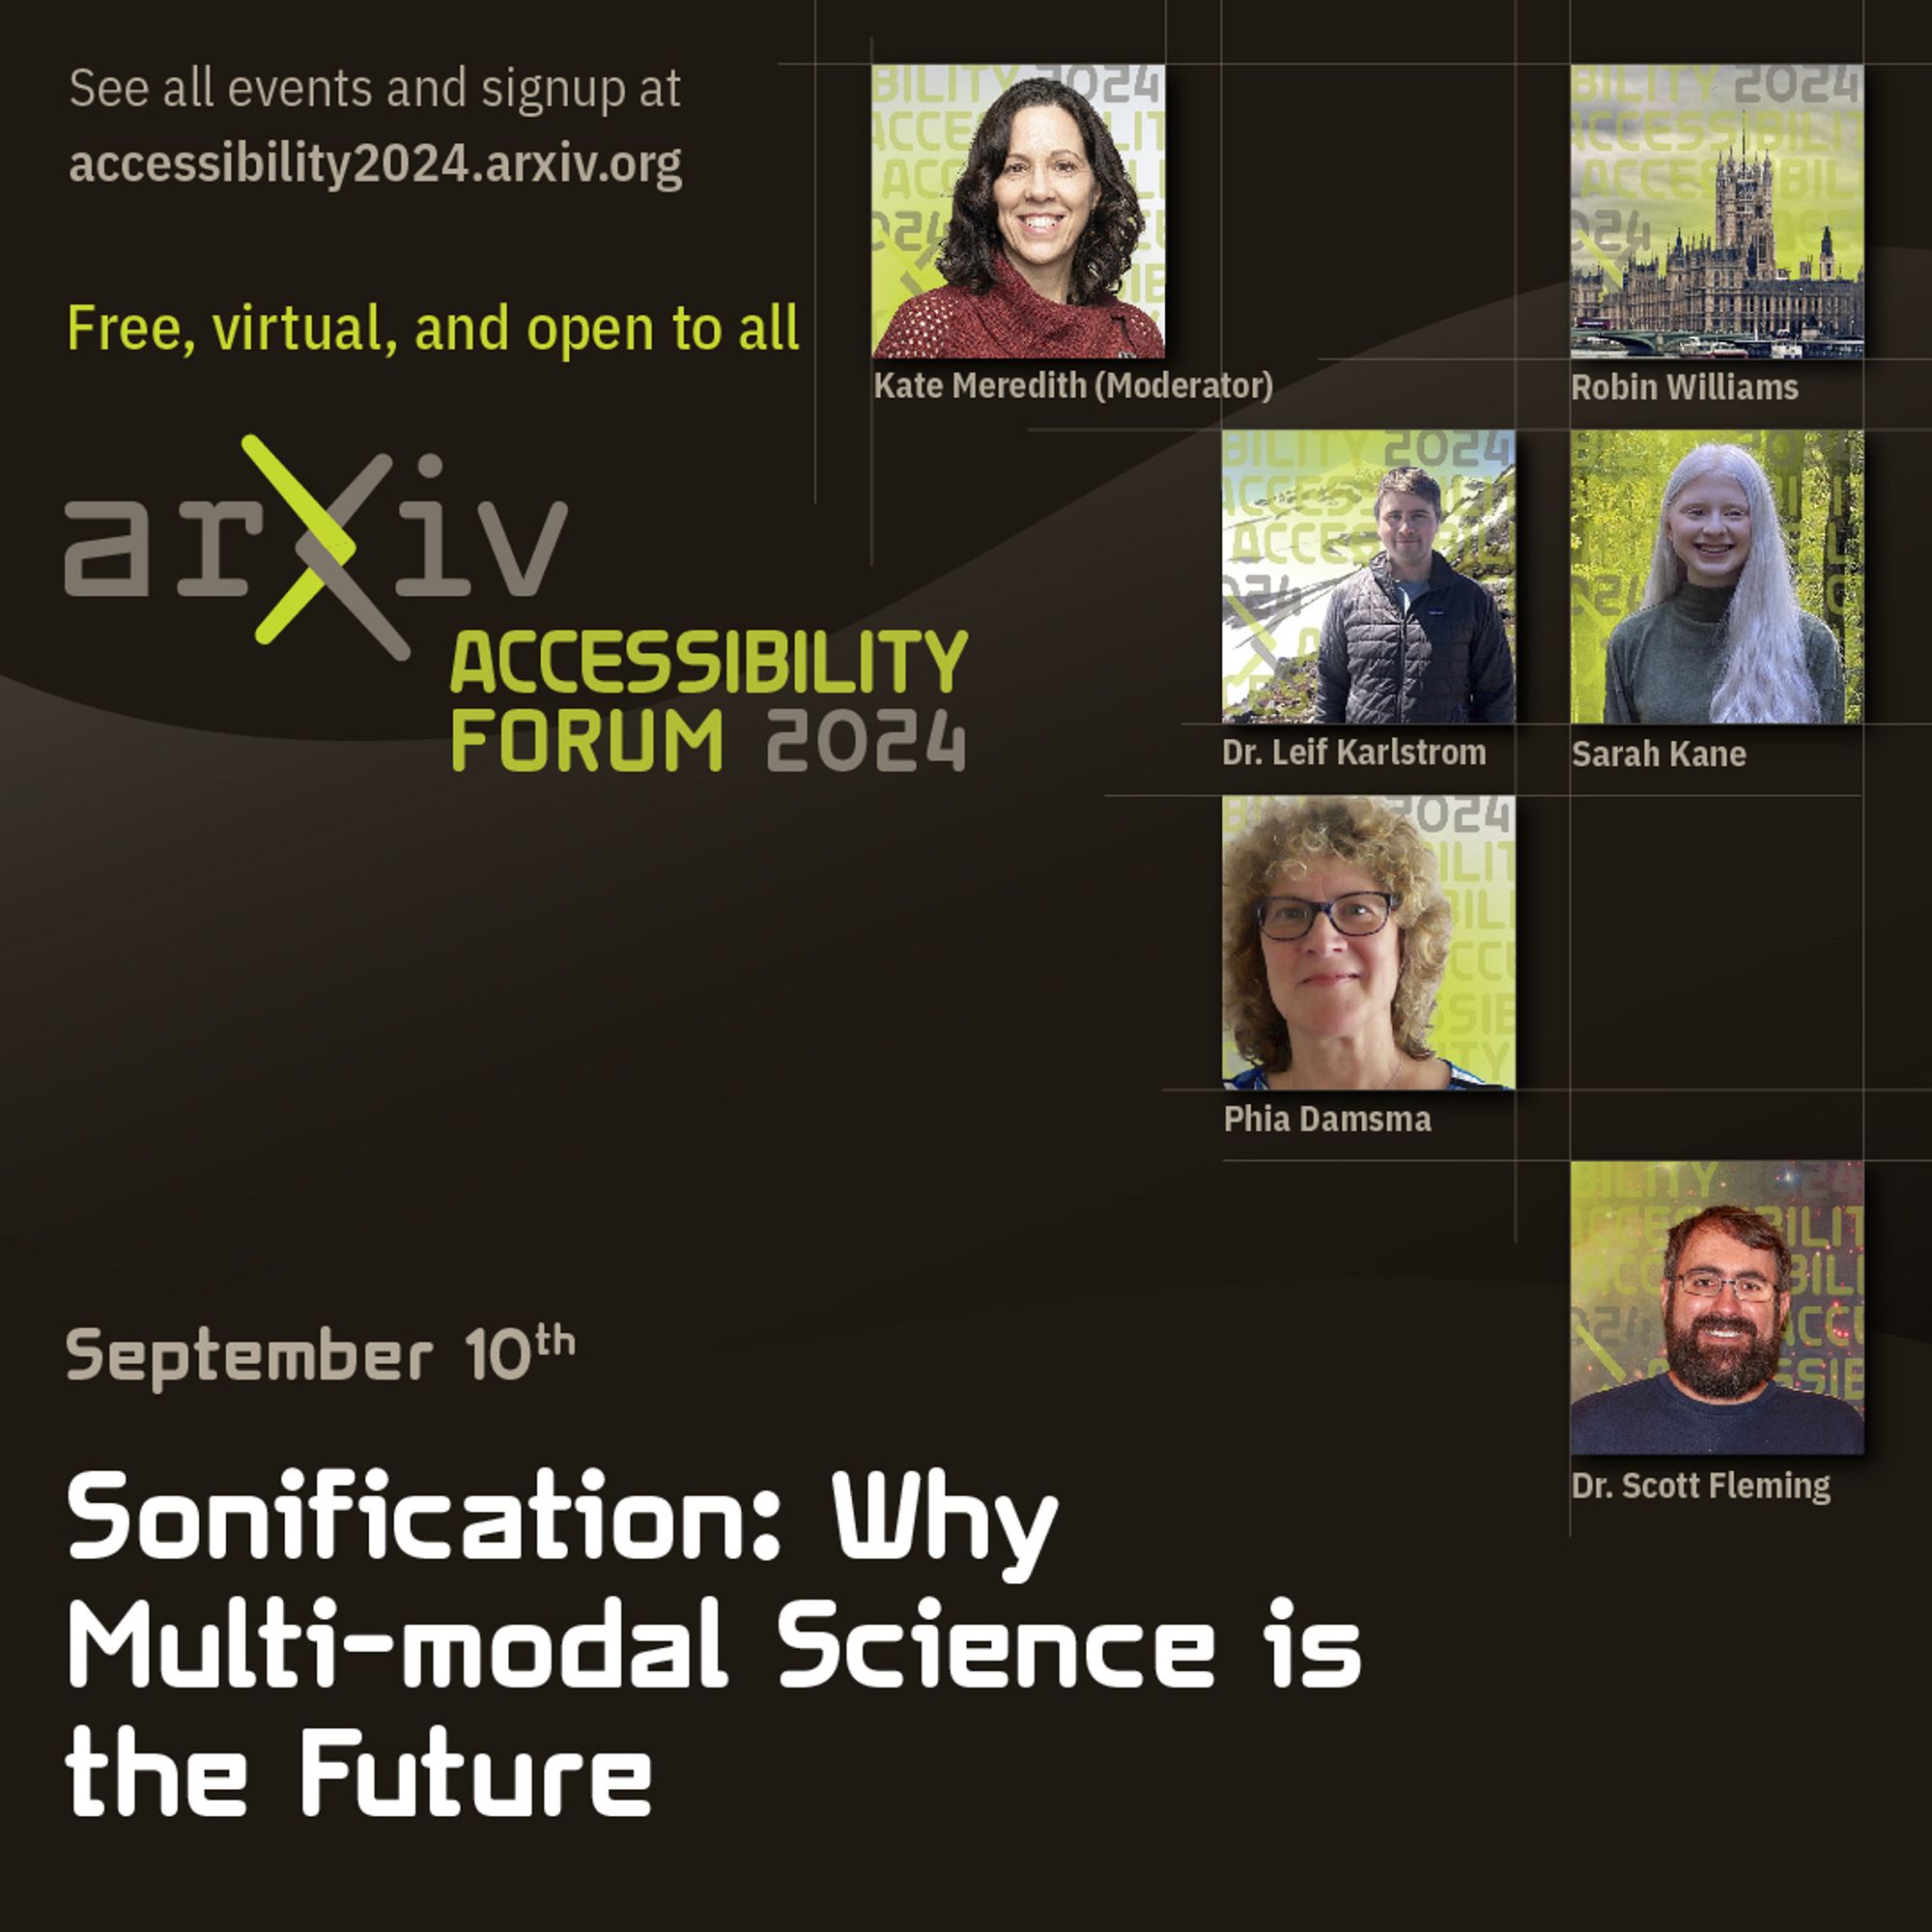
Very grateful and excited to be participating in the arXiv Accessibility Forum on Sonification event tomorrow! It's completely free so check out the forum accessibility2024.arxiv.orgcornell.zoom.us/j/9530370483...#AccessCantWait#arXivAccessibility2024

Poster advertising the signup URL, with headshots of the participants: Kate Meredith, Sarah Kane, Dr. Leif Karlstrom, Phia Damsma, and Scott Fleming. The date is September 10th and the title is "Sonification: Why Multi-Modal Science is the Future"
0
DSscottwfleming.bsky.social

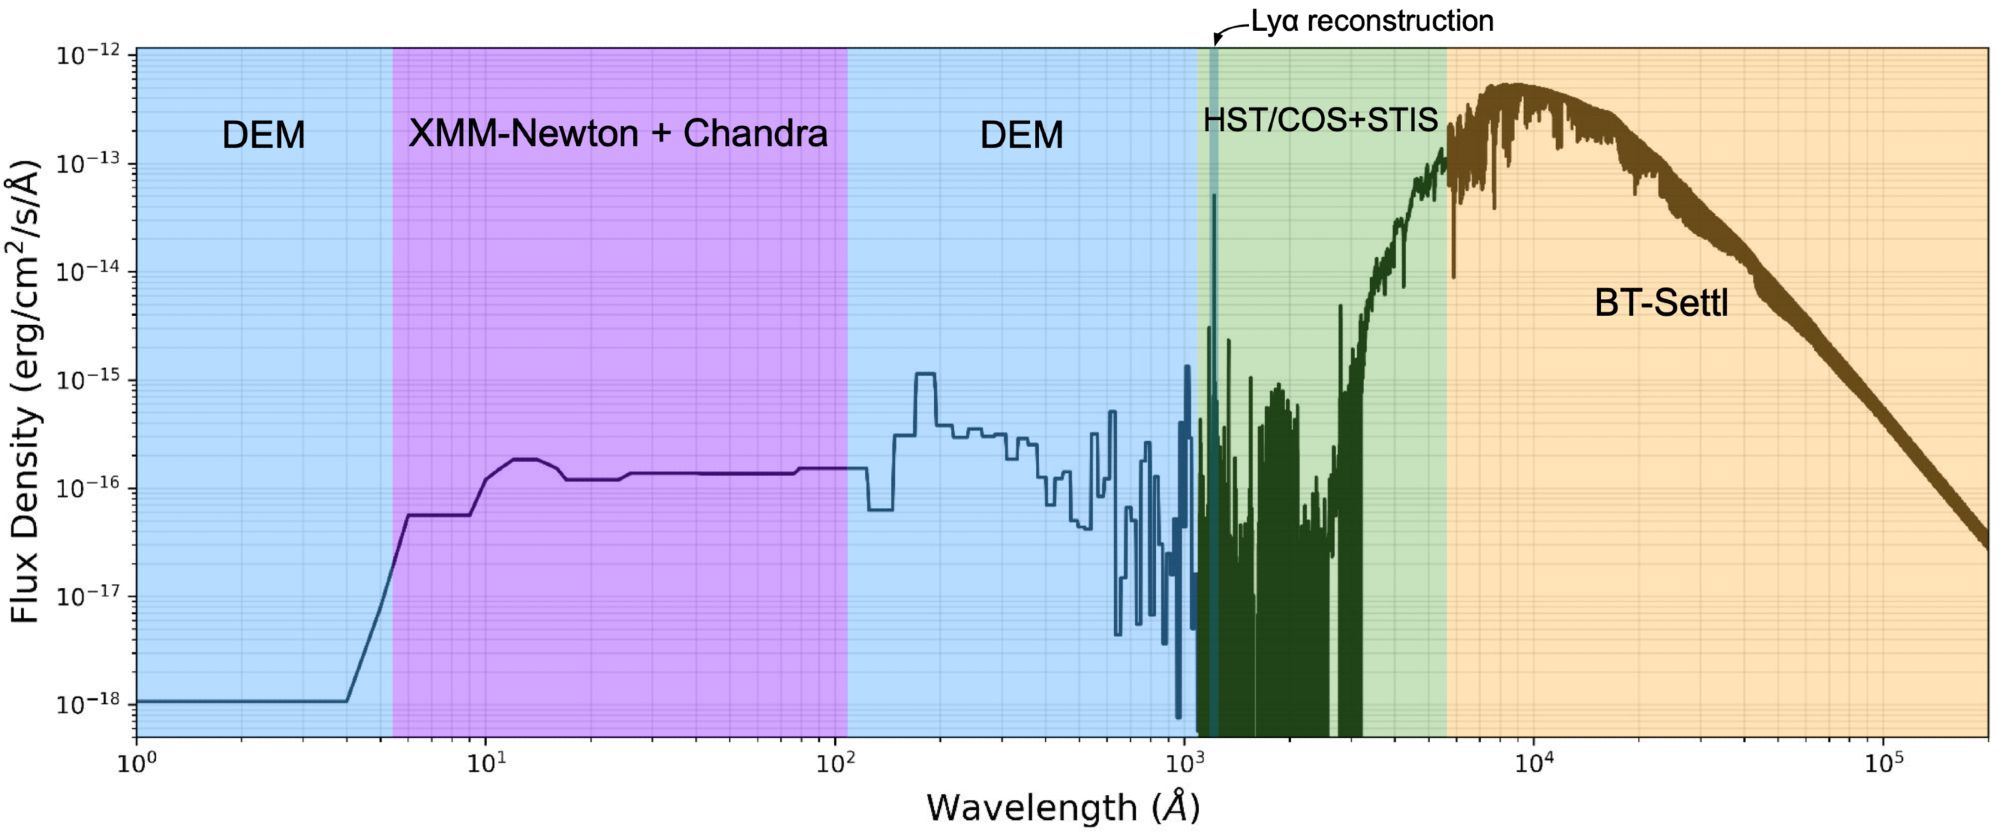
MSTARPANSPEC adds data for LTT 1445A and GJ 486, the two closest M-dwarfs with transiting exoplanets. Panchromatic spectra are constructed from UV and X-ray observations, Ly-a reconstructions, DEM estimates, and BT-settl models. archive.stsci.edu/hlsp/mstarpa... 🔭

This figure shows the panchromatic spectrum of GJ 486, with wavelength on the x-axis and flux density on the y-axis. Different wavelength regions are shaded in color, from the X-ray observations from XMM-Newton (shaded in purple),  the DEM estimate in the EUV (shaded in blue), the optical spectrum including a Ly-a reconstruction from HST observations (shaded in green), and a BT-settl model of the IR (shaded in yellow).
0
DSscottwfleming.bsky.social

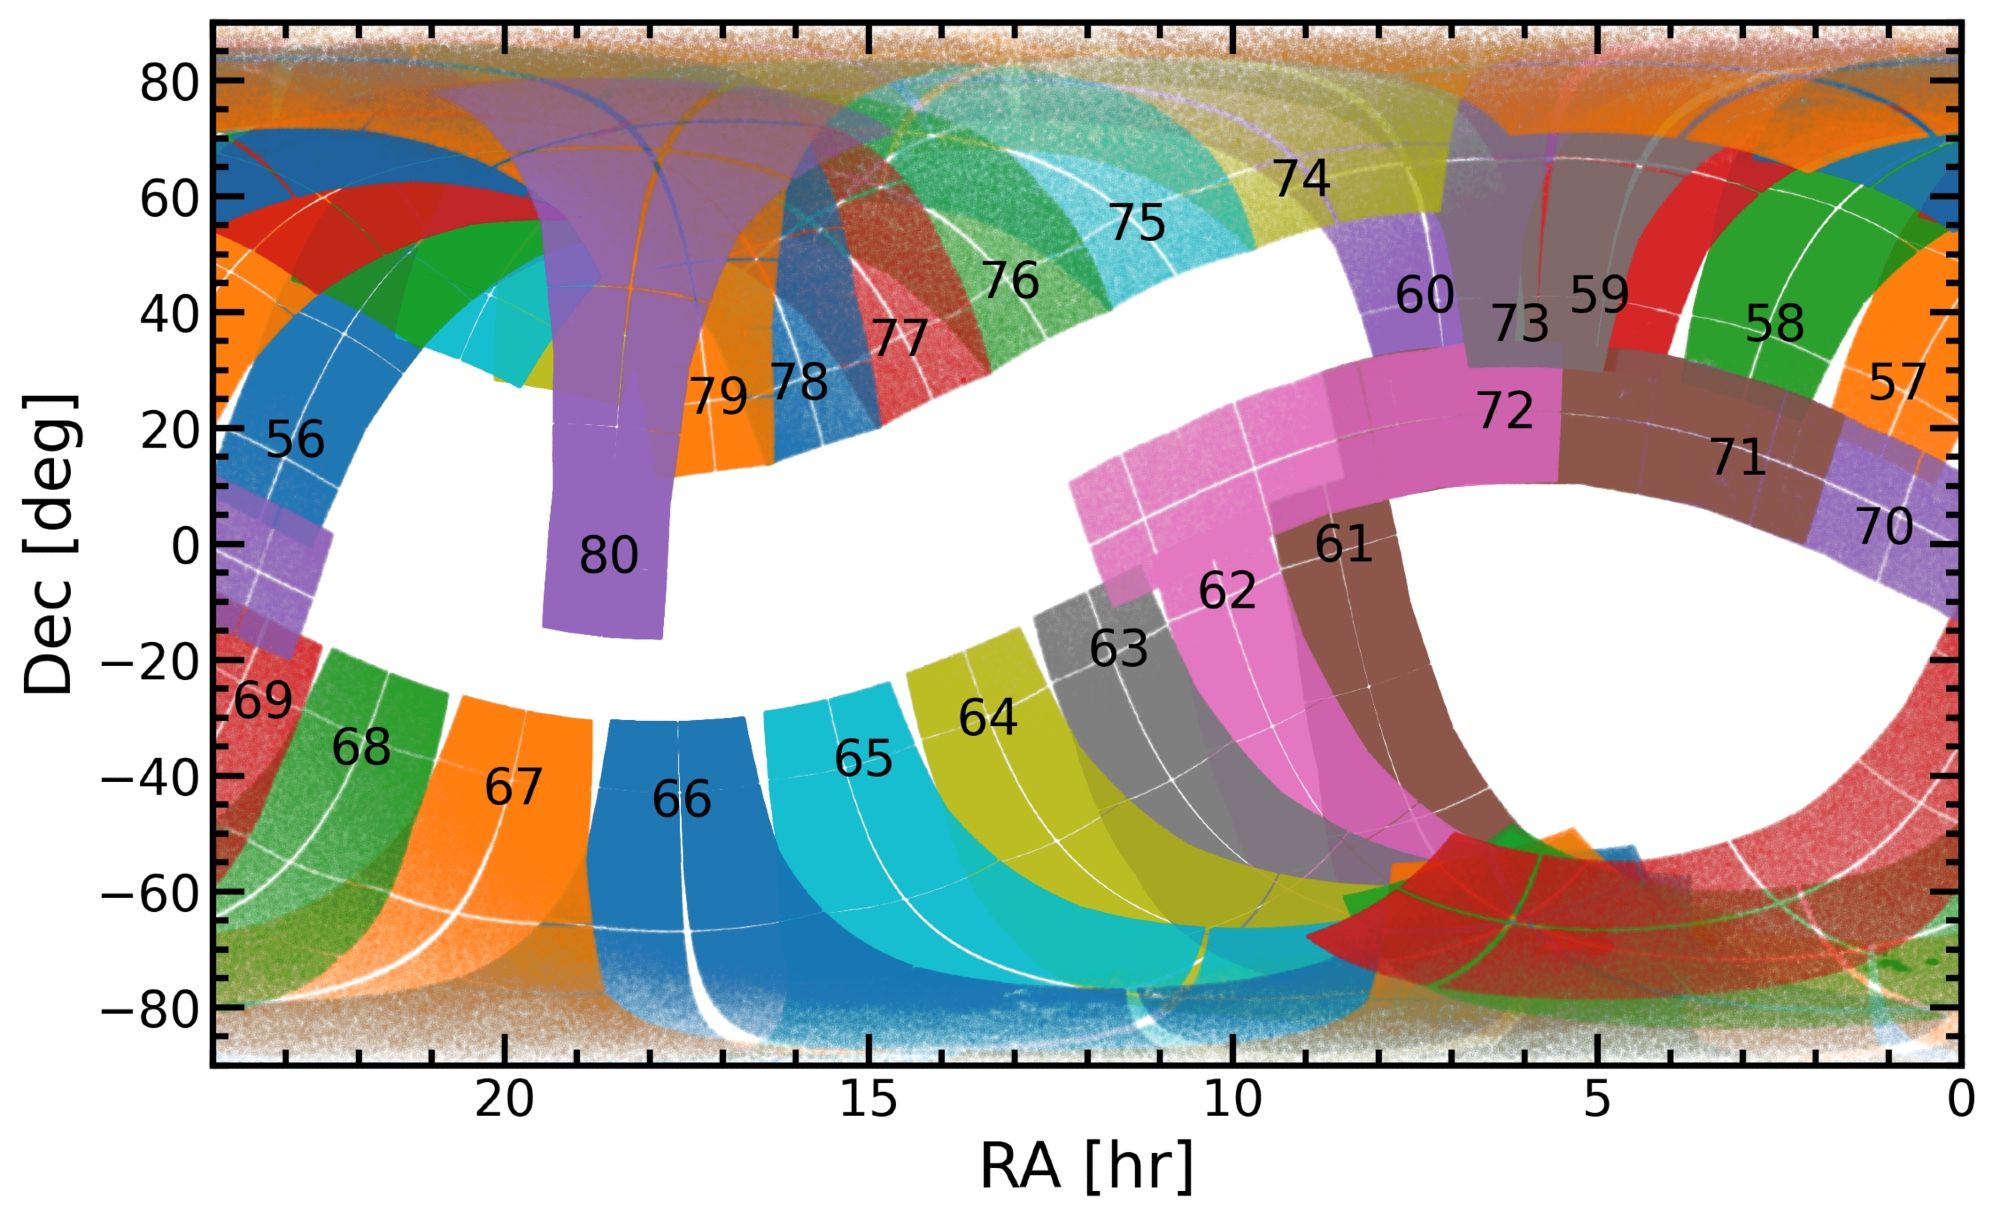
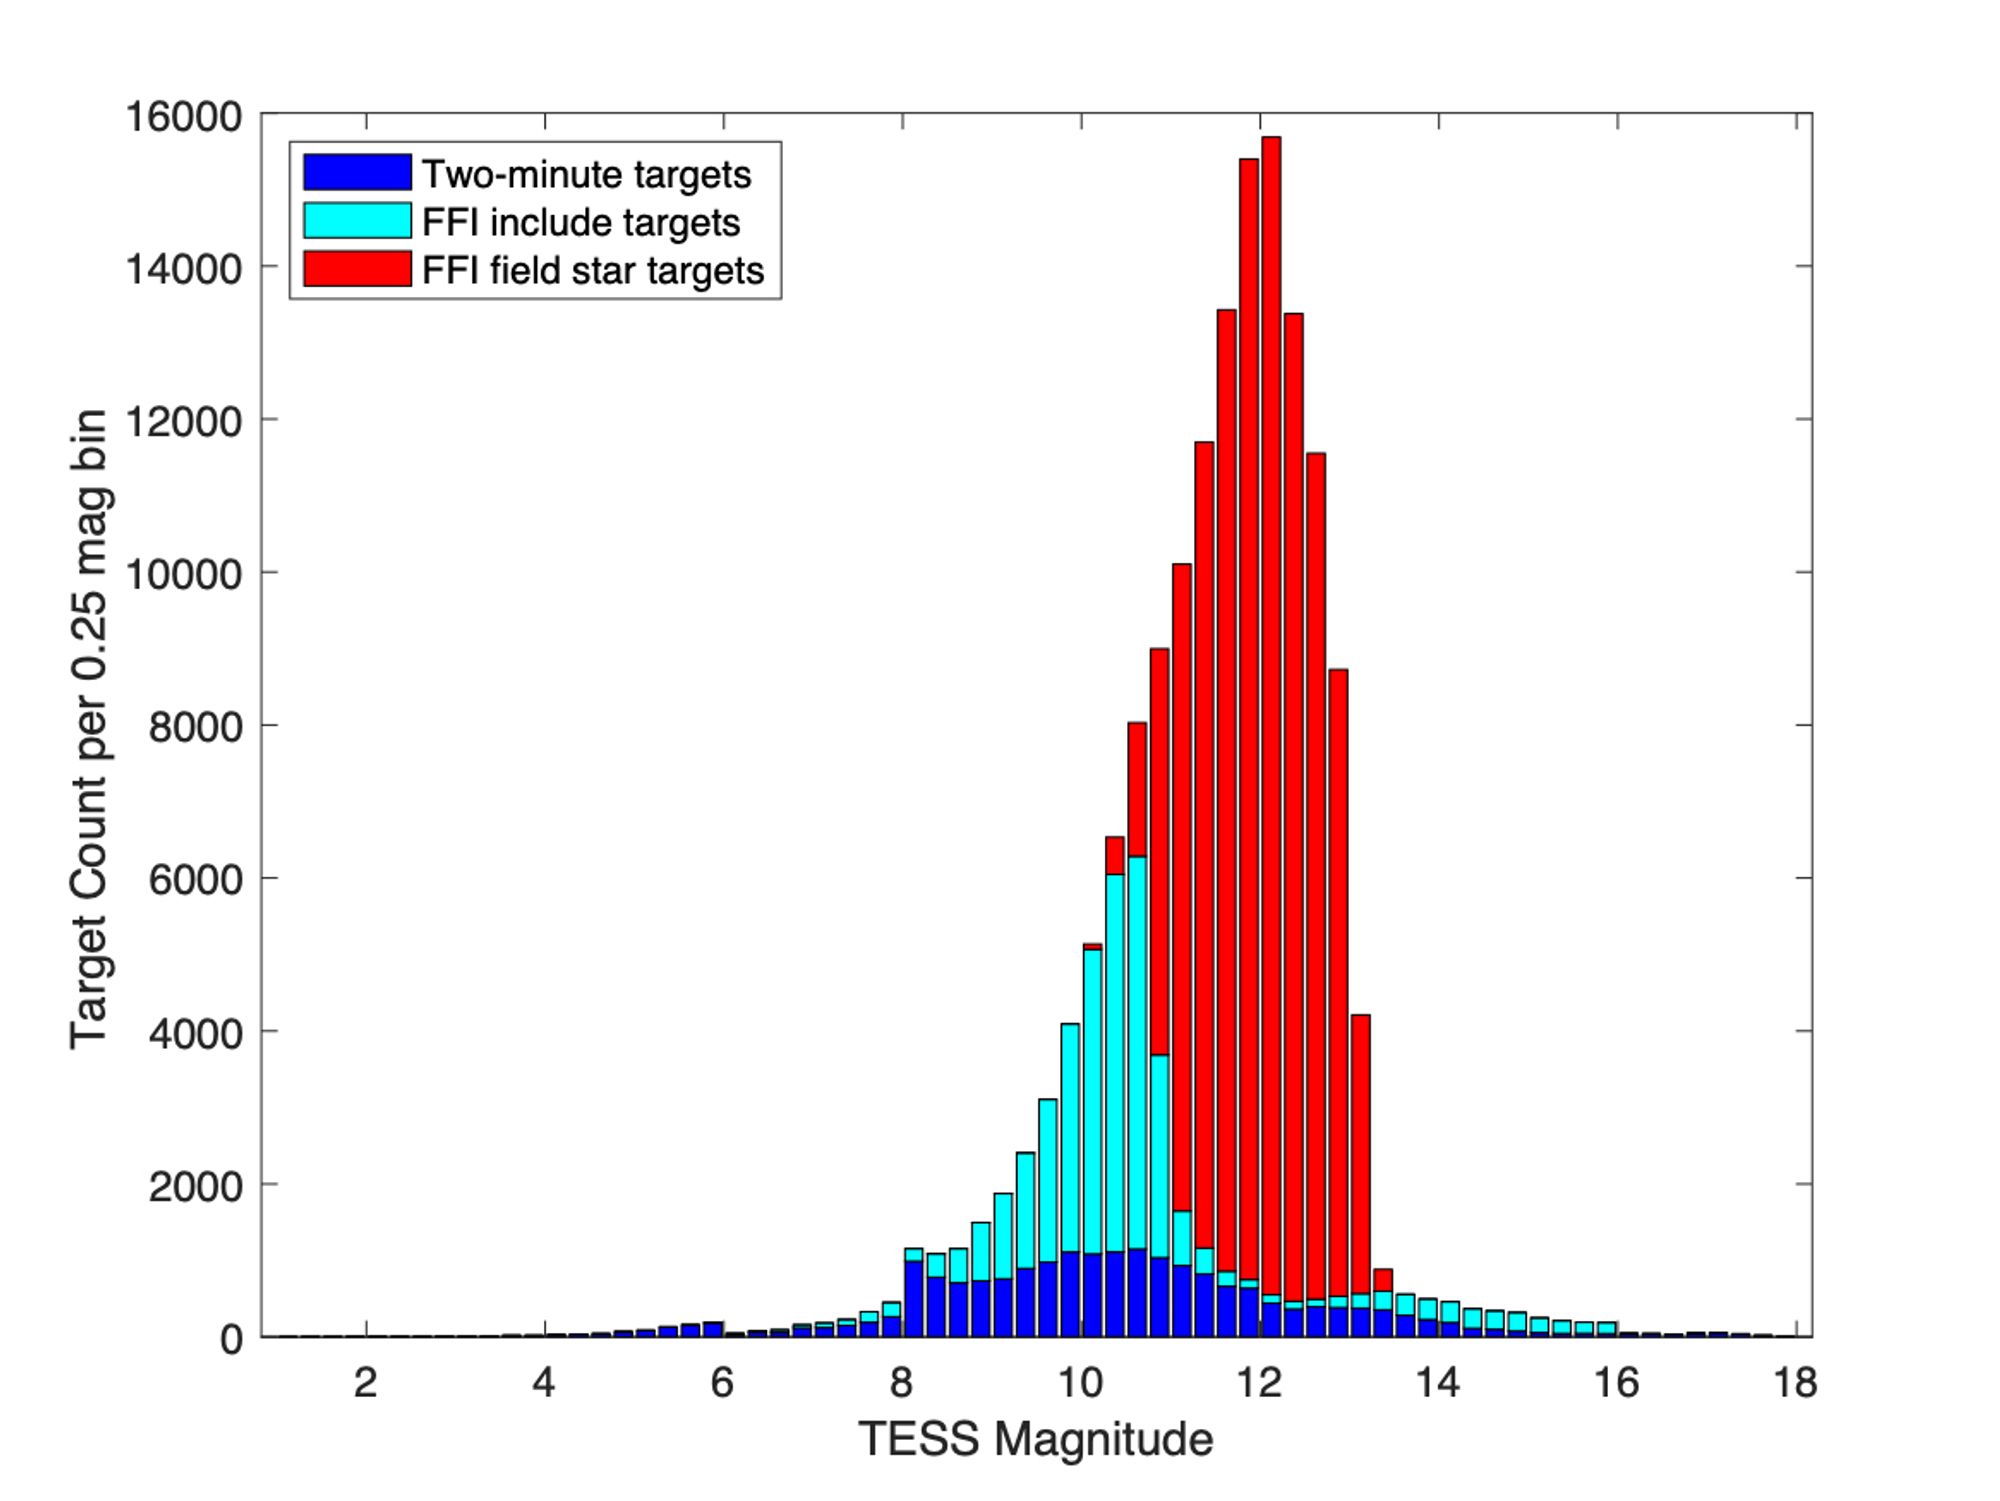
TESS-SPOC calibrated light curves and target pixel files from TESS full frame images for Sector 70 are now available at MAST. This Sector adds 159994 targets derived from 200 second cadence FFIs. 🔭 archive.stsci.edu/hlsp/tess-spoc

A histogram showing the number of targets per 0.25 magnitude bin from three different categories: two-minute targets (in dark blue), FFI-included targets (in light blue) and FFI field star targets (in red). The two-minute targets are primarily between TESS magnitude 8-12 and the maximum bin count is approximately 1000.  The FFI-include targets have a more strongly peaked distribution centered on TESS magnitude 11 and at the maximum bin count is approximately 6500.  The FFI field star targets also follow a strongly-peaked distribution centered at TESS magnitude 12.5 and have a maximum bin count size of almost 16000.
0
DSscottwfleming.bsky.social

HLSP Update: QLP calibrated light curves from TESS full frame images for Sector 79 are now available at MAST. This Sector adds 668387 targets derived from 200 second cadence FFIs. archive.stsci.edu/hlsp/qlp 🔭

Sky projected plot of the Sectors 56-80 footprints on the sky. Each footprint is shaded a different color to stand out compared to others. Right ascension is along the x-axis and declination is along the y-axis. The biggest gaps in coverage occur approximately between -20 degrees and +50 degrees declination along right ascension 10 to 20 hours, and from -60 to +20 degrees declination along right ascension 0 to 7 hours.
0
DS
Dr. Scott W. Fleming
@scottwfleming.bsky.social
Branch Manager at Space Telescope Science Institute working in the MAST archive. Astronomy PhD. Studies stars and exoplanets. Loves programming. Opinions are my own. He/Him/His
197 followers198 following78 posts