JI
J. I. Swiderski, MURP
@swiderski.bsky.social
// active+public transport planner and advocate
// candidate, DC ANC 1B03 (@GGWash + @DCYIMBYs endorsee)
// fan of maps, libraries, & oxford commas
// MSU-born, UMich-raised @PittTweet & @VTMURP alum in DC
/ Opinions mine, but you can have them.
/ 🟪⬜🟩
225 followers118 following241 posts
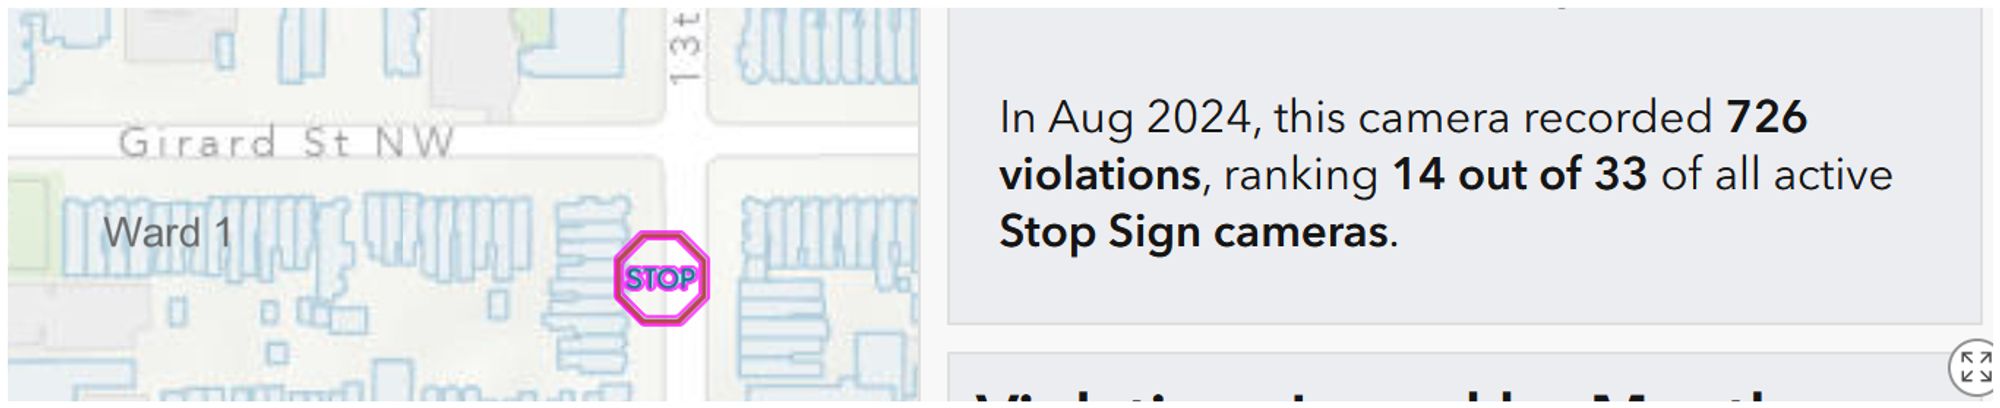
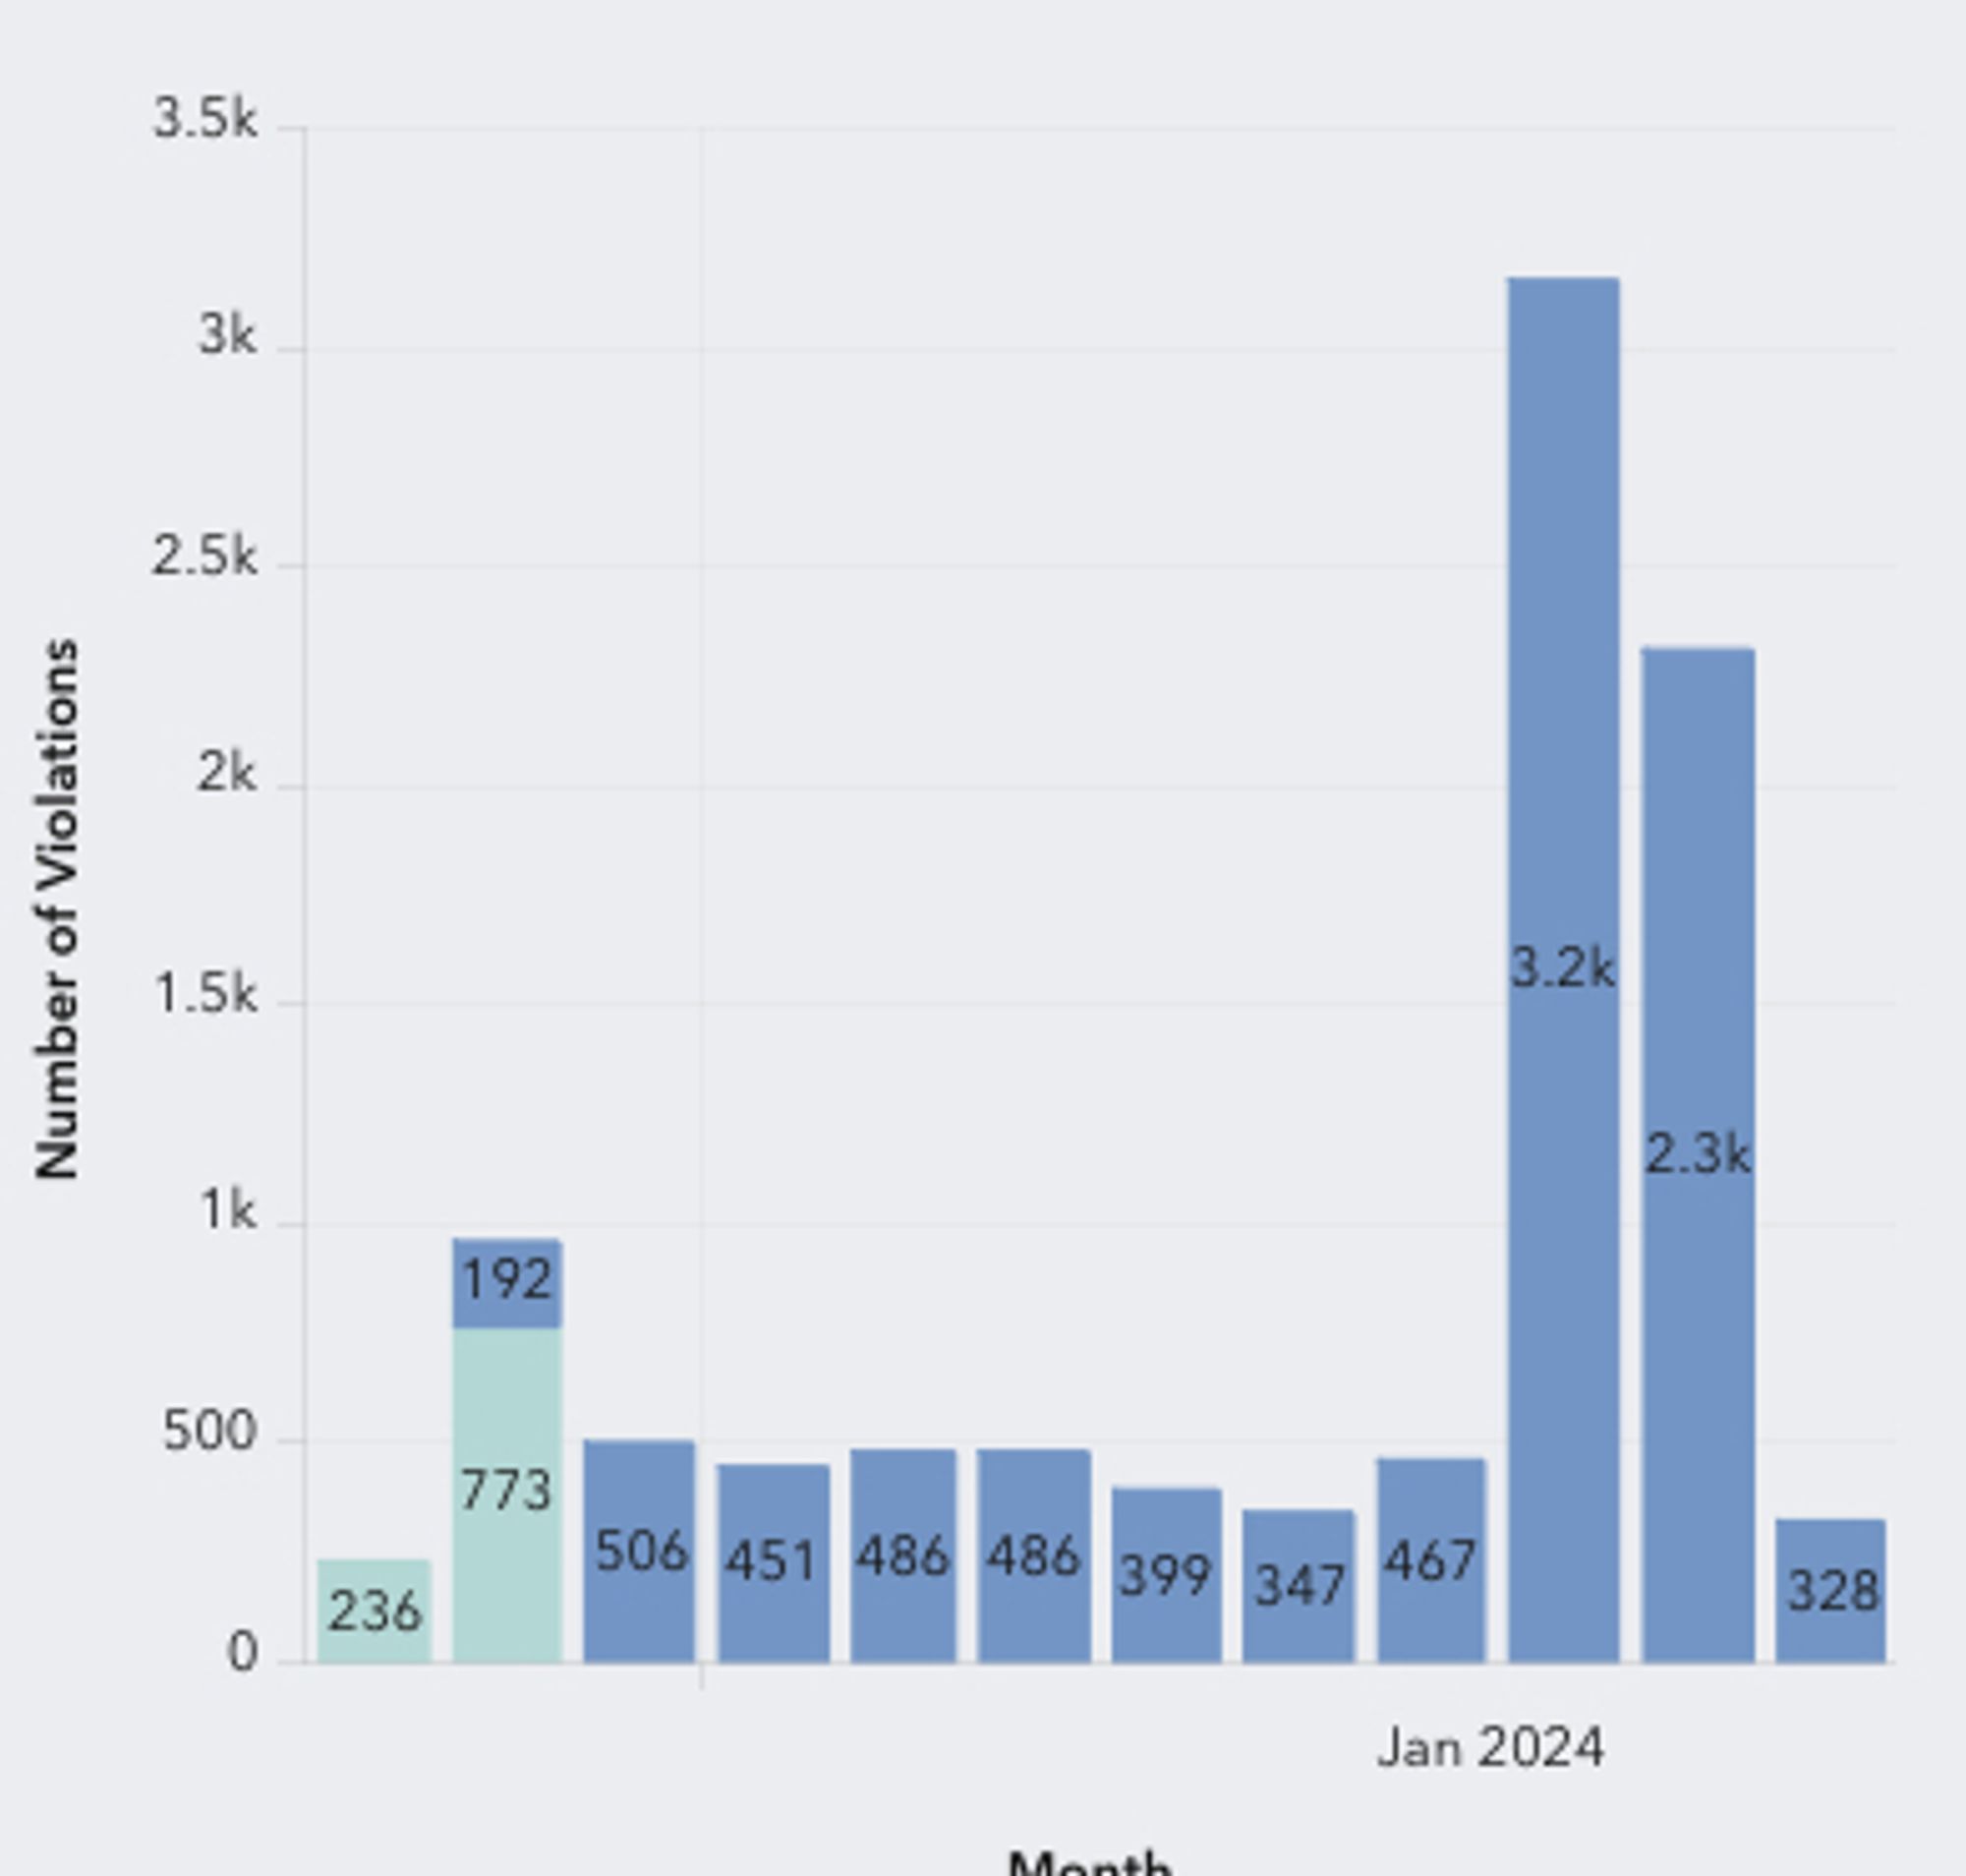
TIL : DDOT's ATE dashboard shows how many tickets were recorded by a given camera, and how they rank in the city. This camera near me "recorded 726 violations" in the month of August—an _average_ of more than 23 per day, nearly one per hour all day all month—and still only ranked 14/33 in DC.
this is good to know! I'd been looking for something like this for a while. Any idea what could cause data like this? All I can think of is recalibrating the camera
JI
J. I. Swiderski, MURP
@swiderski.bsky.social
// active+public transport planner and advocate
// candidate, DC ANC 1B03 (@GGWash + @DCYIMBYs endorsee)
// fan of maps, libraries, & oxford commas
// MSU-born, UMich-raised @PittTweet & @VTMURP alum in DC
/ Opinions mine, but you can have them.
/ 🟪⬜🟩
225 followers118 following241 posts