KV
Koen Van den Eeckhout
@vandeneeckhoutkoen.bsky.social
📊 Turning complex data into powerful visual stories!
Author of 'Powerful Charts'. Ex-physicist. He/him 🏳️🌈
462 followers34 following76 posts
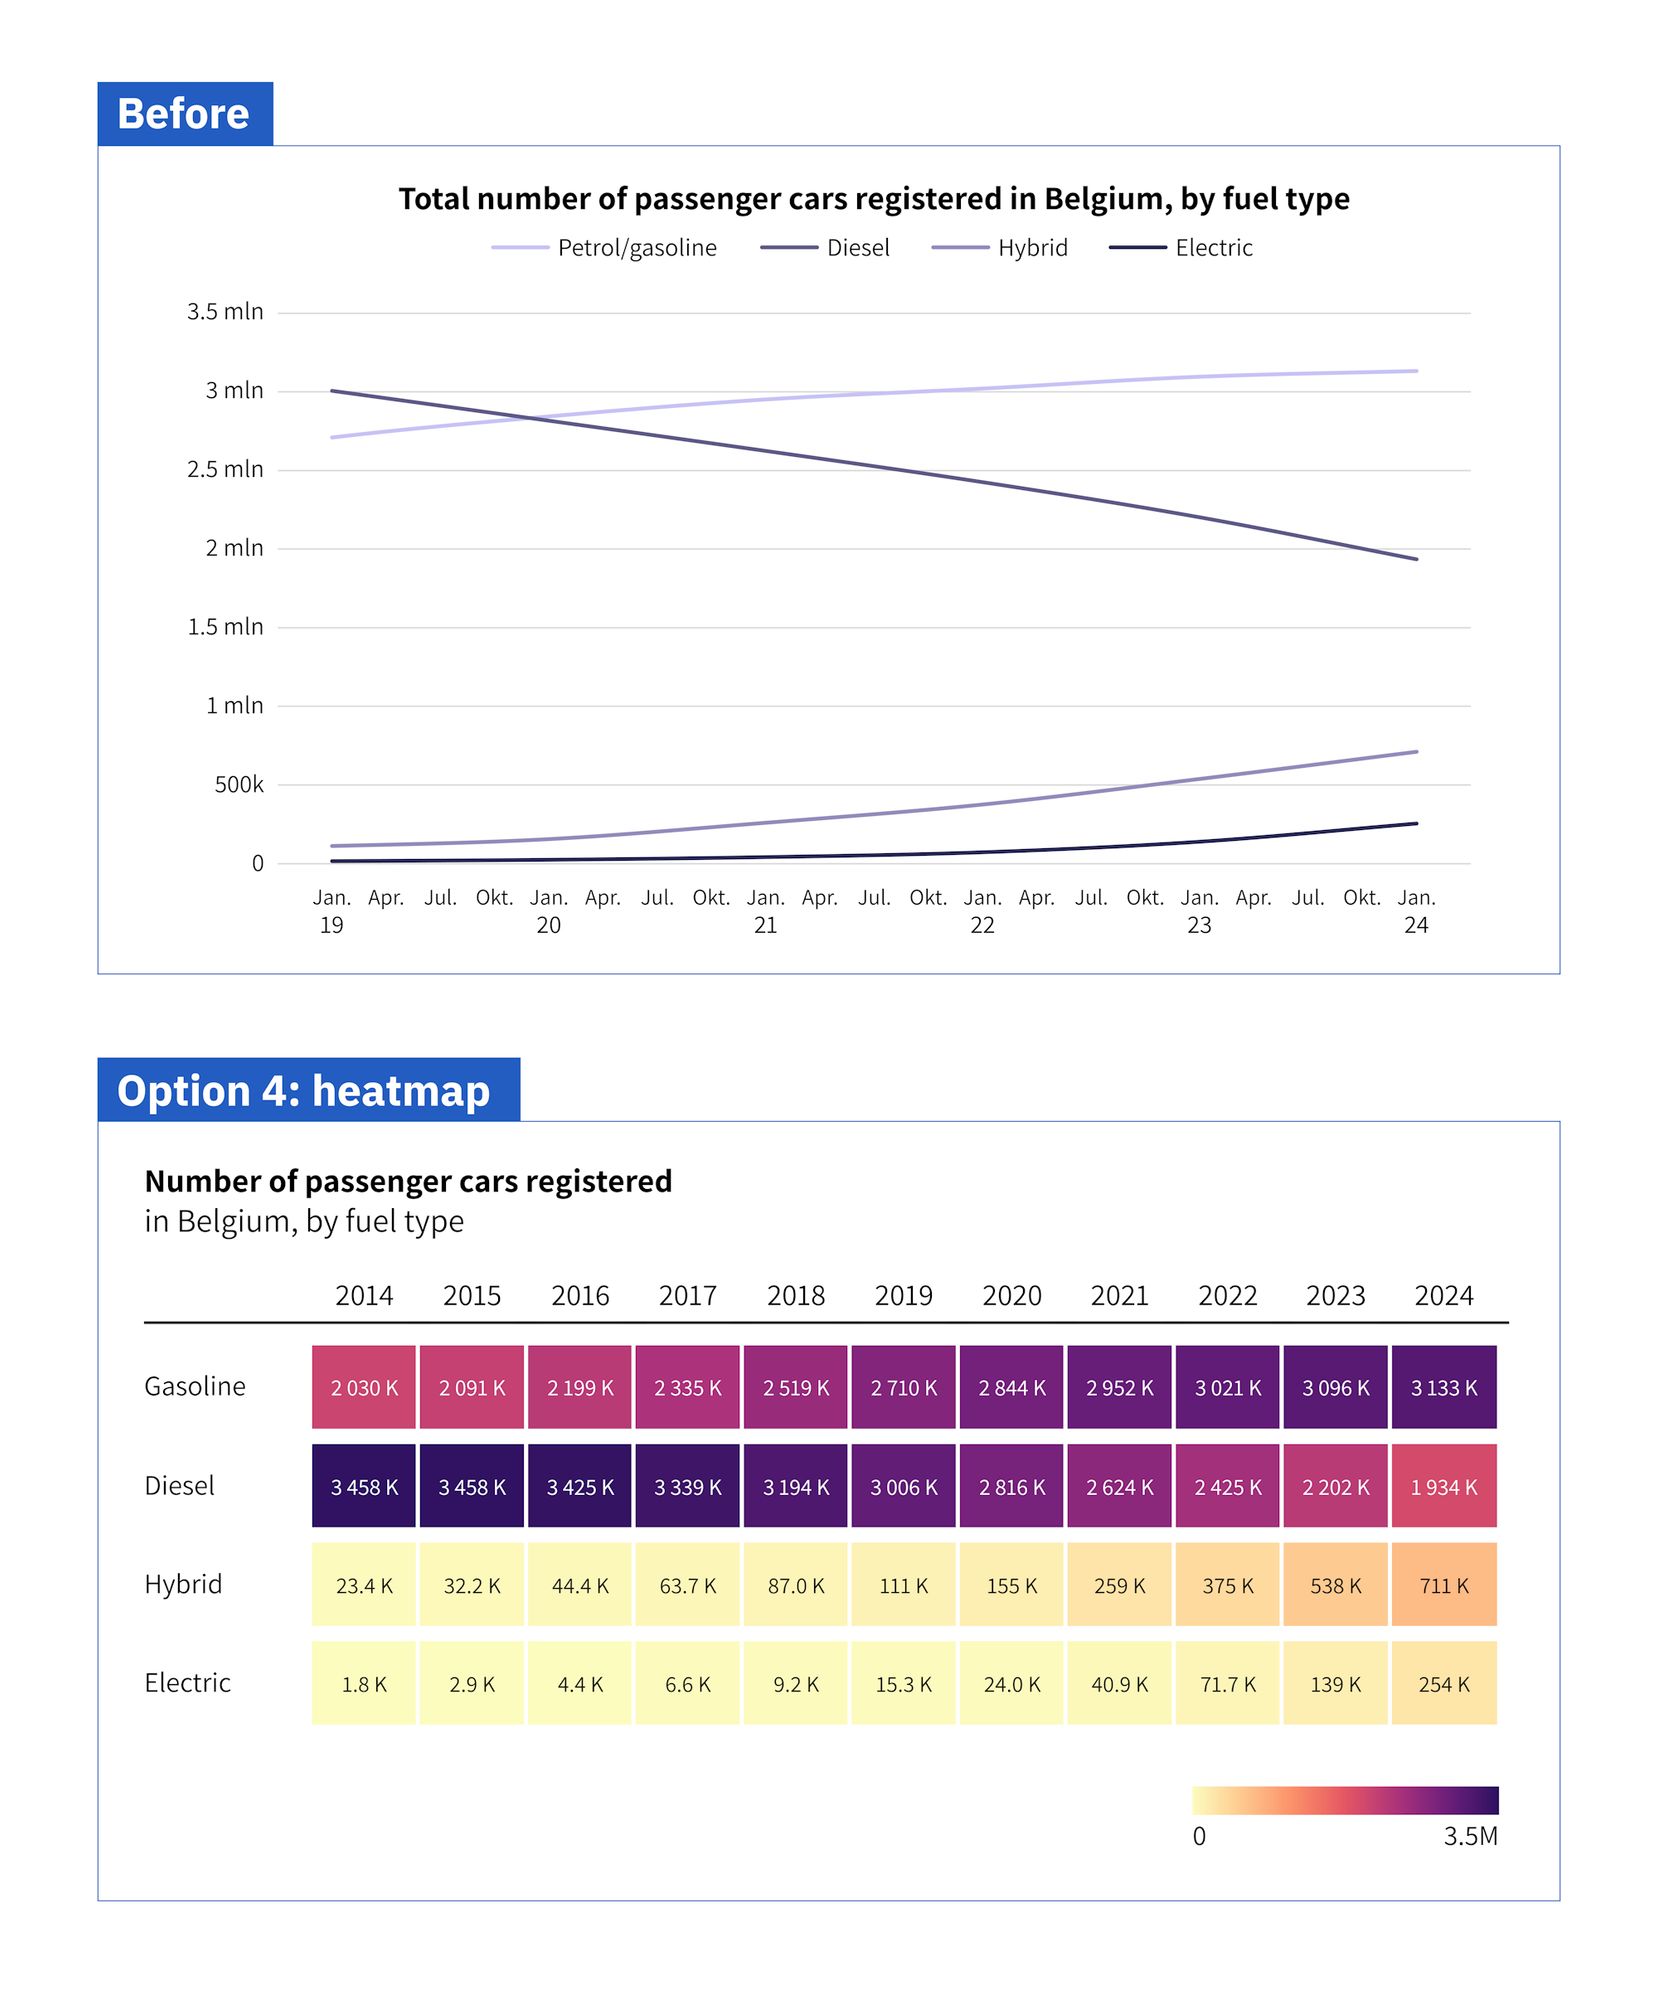
⚡ Want to be even more compact? Just leave out the data values, and rely purely on the colors! If accuracy is less important, this is the most space-efficient way to show a pattern. (2/4)

KV
Koen Van den Eeckhout
@vandeneeckhoutkoen.bsky.social
📊 Turning complex data into powerful visual stories!
Author of 'Powerful Charts'. Ex-physicist. He/him 🏳️🌈
462 followers34 following76 posts