KV
Koen Van den Eeckhout
@vandeneeckhoutkoen.bsky.social
📊 Turning complex data into powerful visual stories!
Author of 'Powerful Charts'. Ex-physicist. He/him 🏳️🌈
462 followers34 following76 posts
⚠️ Make sure to use an optimized sequential color scale - nicely going from light to dark, because the we use the color brightness as visual variable to show the data. Some rainbow scales have brightnesses that go all over the place - a nightmare for colorblind people! (3/4)
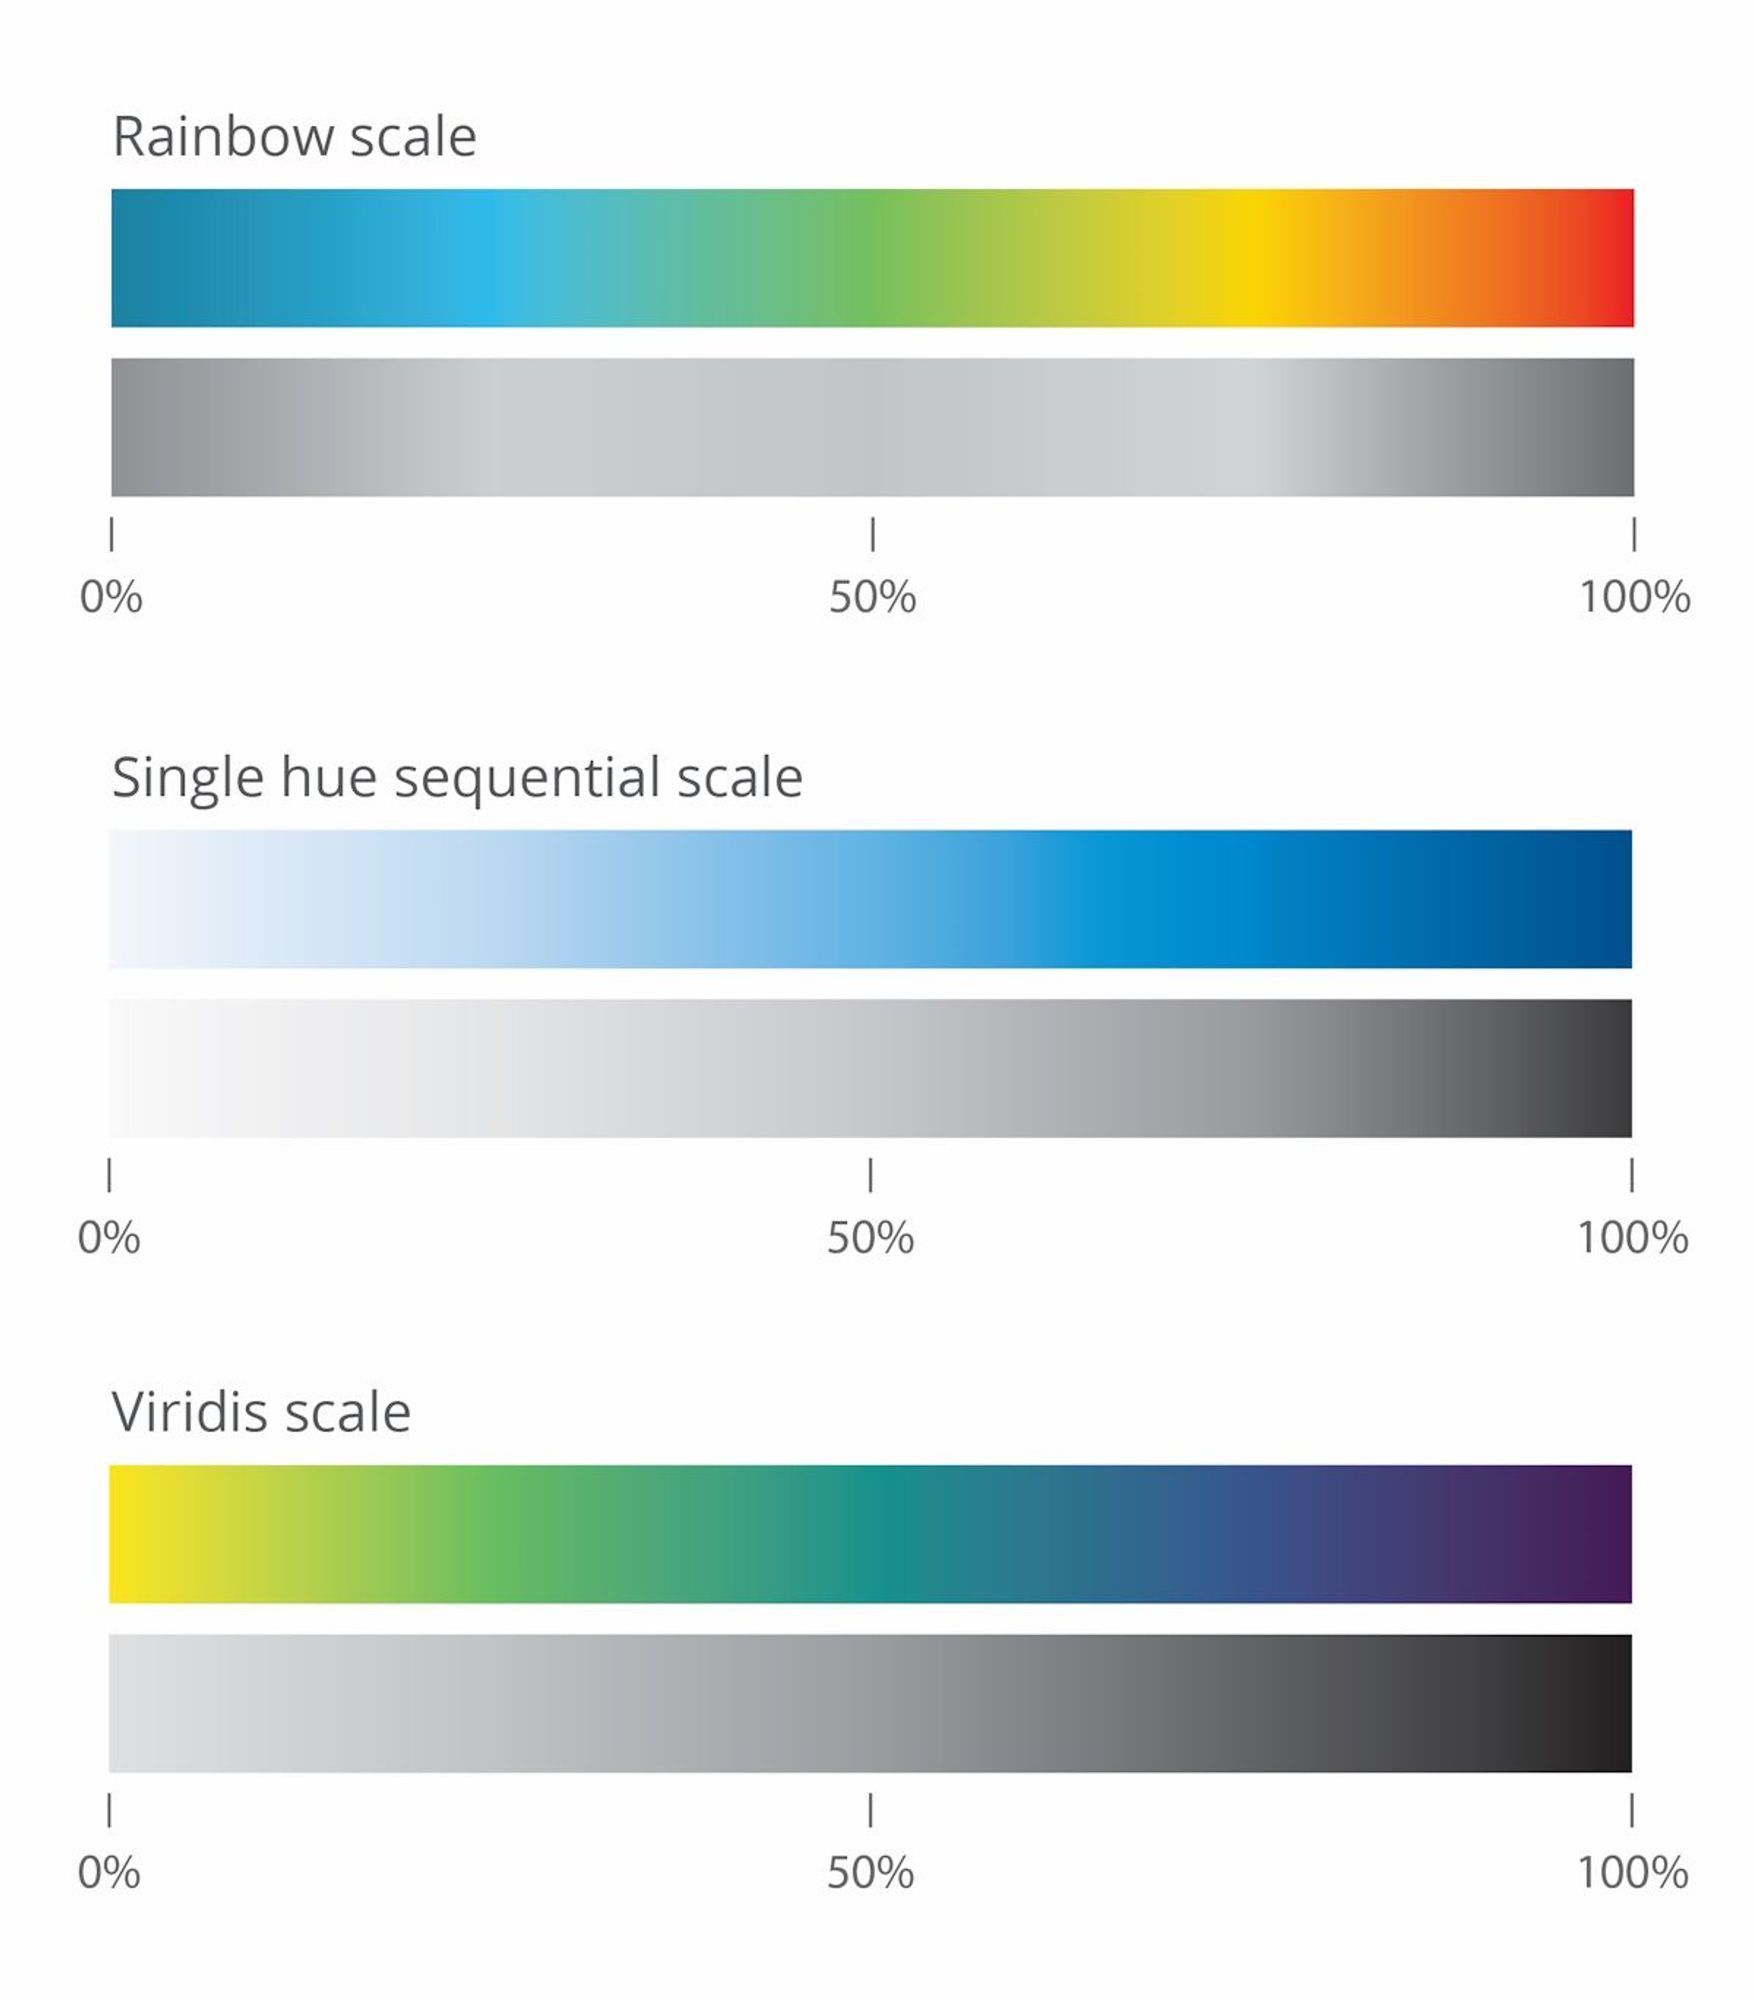
⚠️ Apply the color scale logically: light colors for low, dark colors for high values. That's because our brain is secretly comparing the cell colors with the background color. Darker colors = more contrast with background = more visually prominent = bigger numbers! (4/4)
KV
Koen Van den Eeckhout
@vandeneeckhoutkoen.bsky.social
📊 Turning complex data into powerful visual stories!
Author of 'Powerful Charts'. Ex-physicist. He/him 🏳️🌈
462 followers34 following76 posts