I wonder if anyone at JPE cares about its readers' eyesight. The text in some graphs is virtually unreadable. It's like 2pt. And yet the font size for panels is always HUGE.
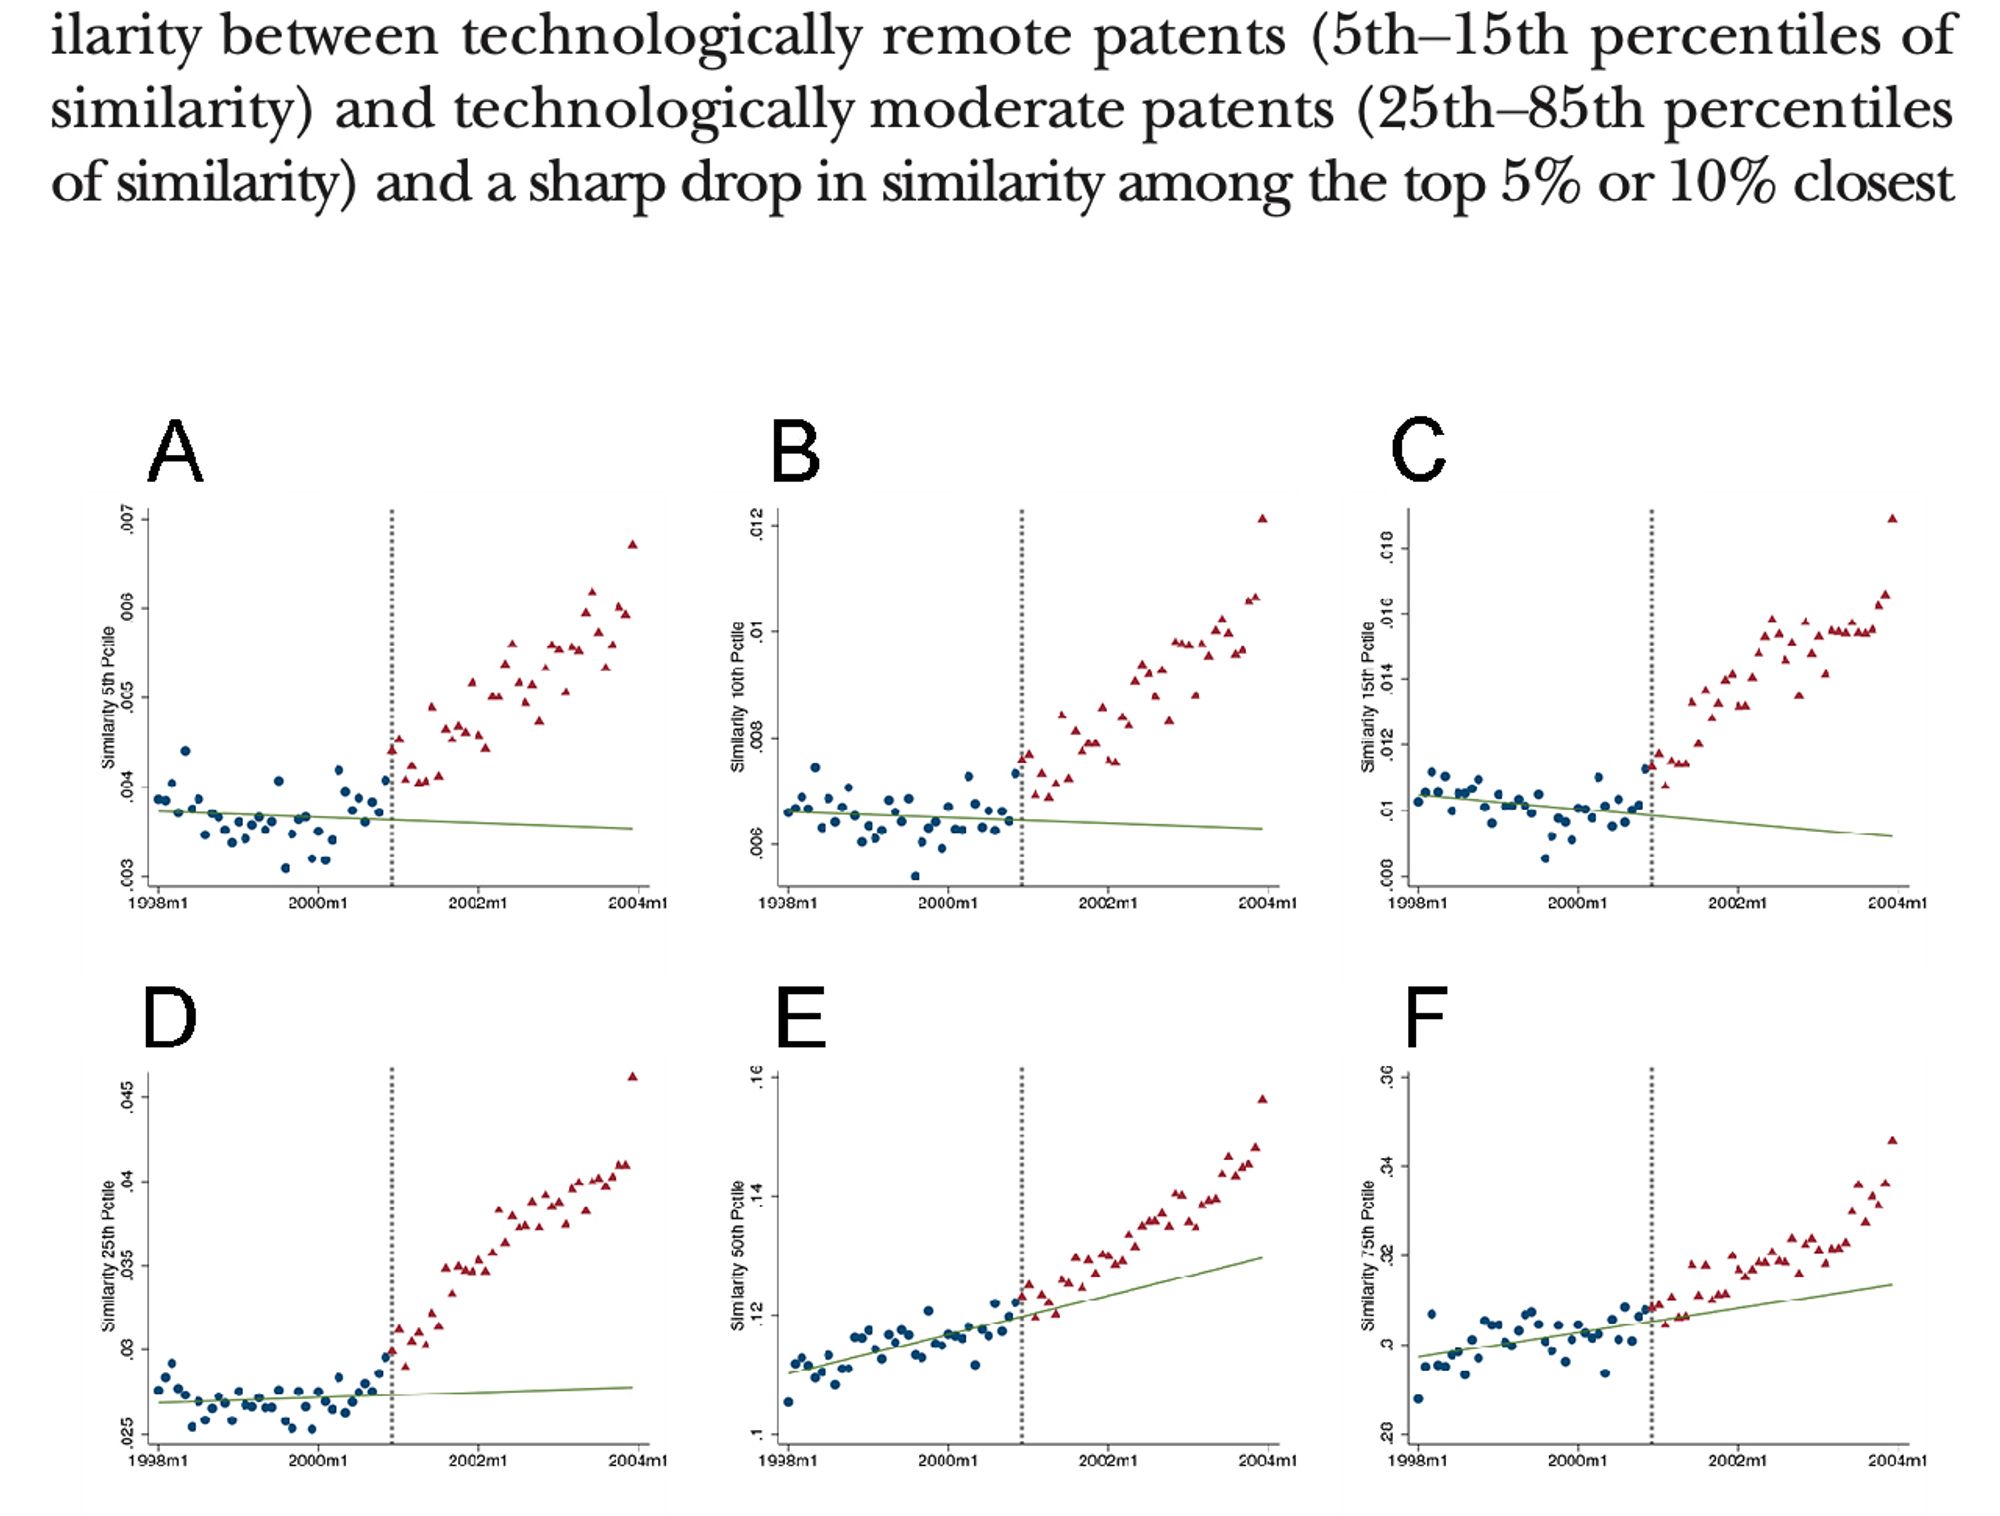
My new favorite quote: "The 95% confidence intervals of the means are omitted owing to their insignificant width, given the sample size (n = 35.2 million)" doi.org/10.1038/s415...#Econsky
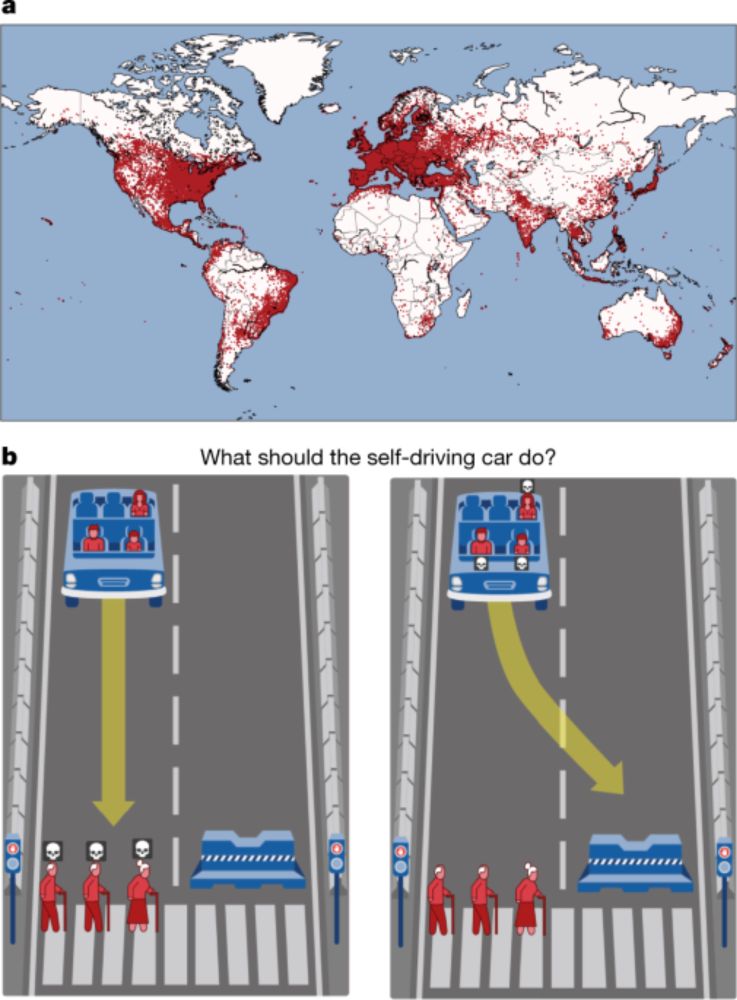
Responses from more than two million people to an internet-based survey of attitudes towards moral dilemmas that might be faced by autonomous vehicles shed light on similarities and variations in ethi...
It's pretty rare to see a paper on the history of econ thought in Top-5, but Magness, P. W., & Makovi, M. (2023) made it. A fascinating read. doi.org/10.1086/722933
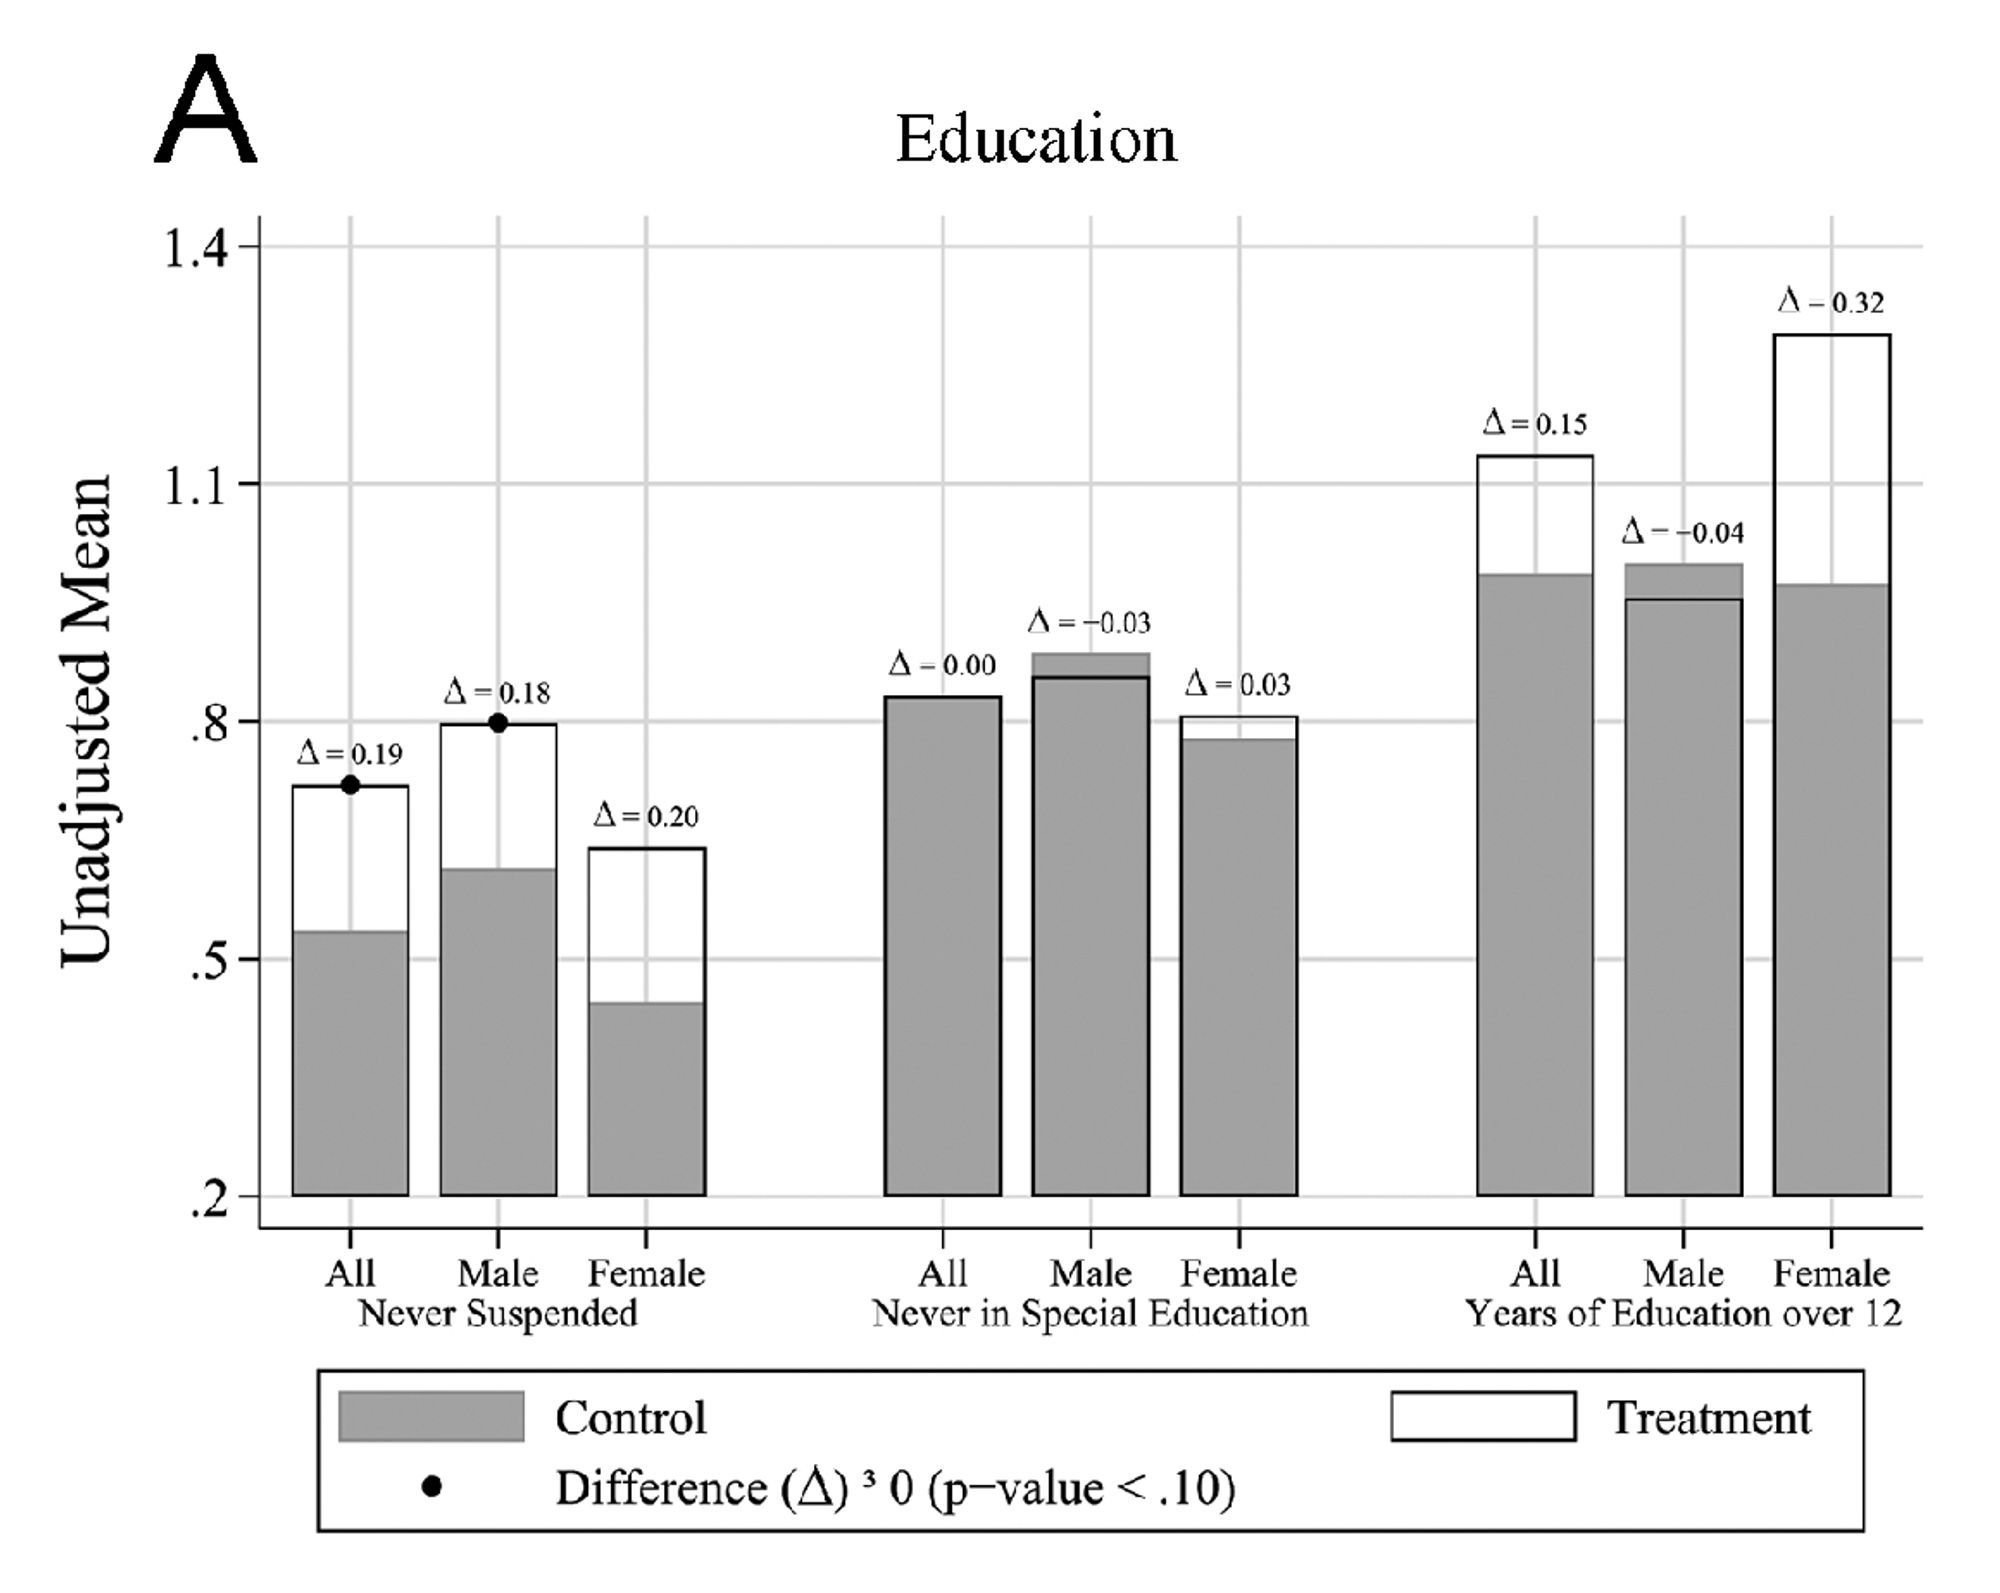
Garcı́a, J. L., Heckman, J. J., & Ronda, V. (2023) use a pretty neat way to visualize ATEs: using stacked bar graphs with the differences between the treatment and control on the top. Seems to be a good solution when you have a bunch of effects to show. doi.org/10.1086/722936
POV: You don't really know a person until you ask them to review a paper

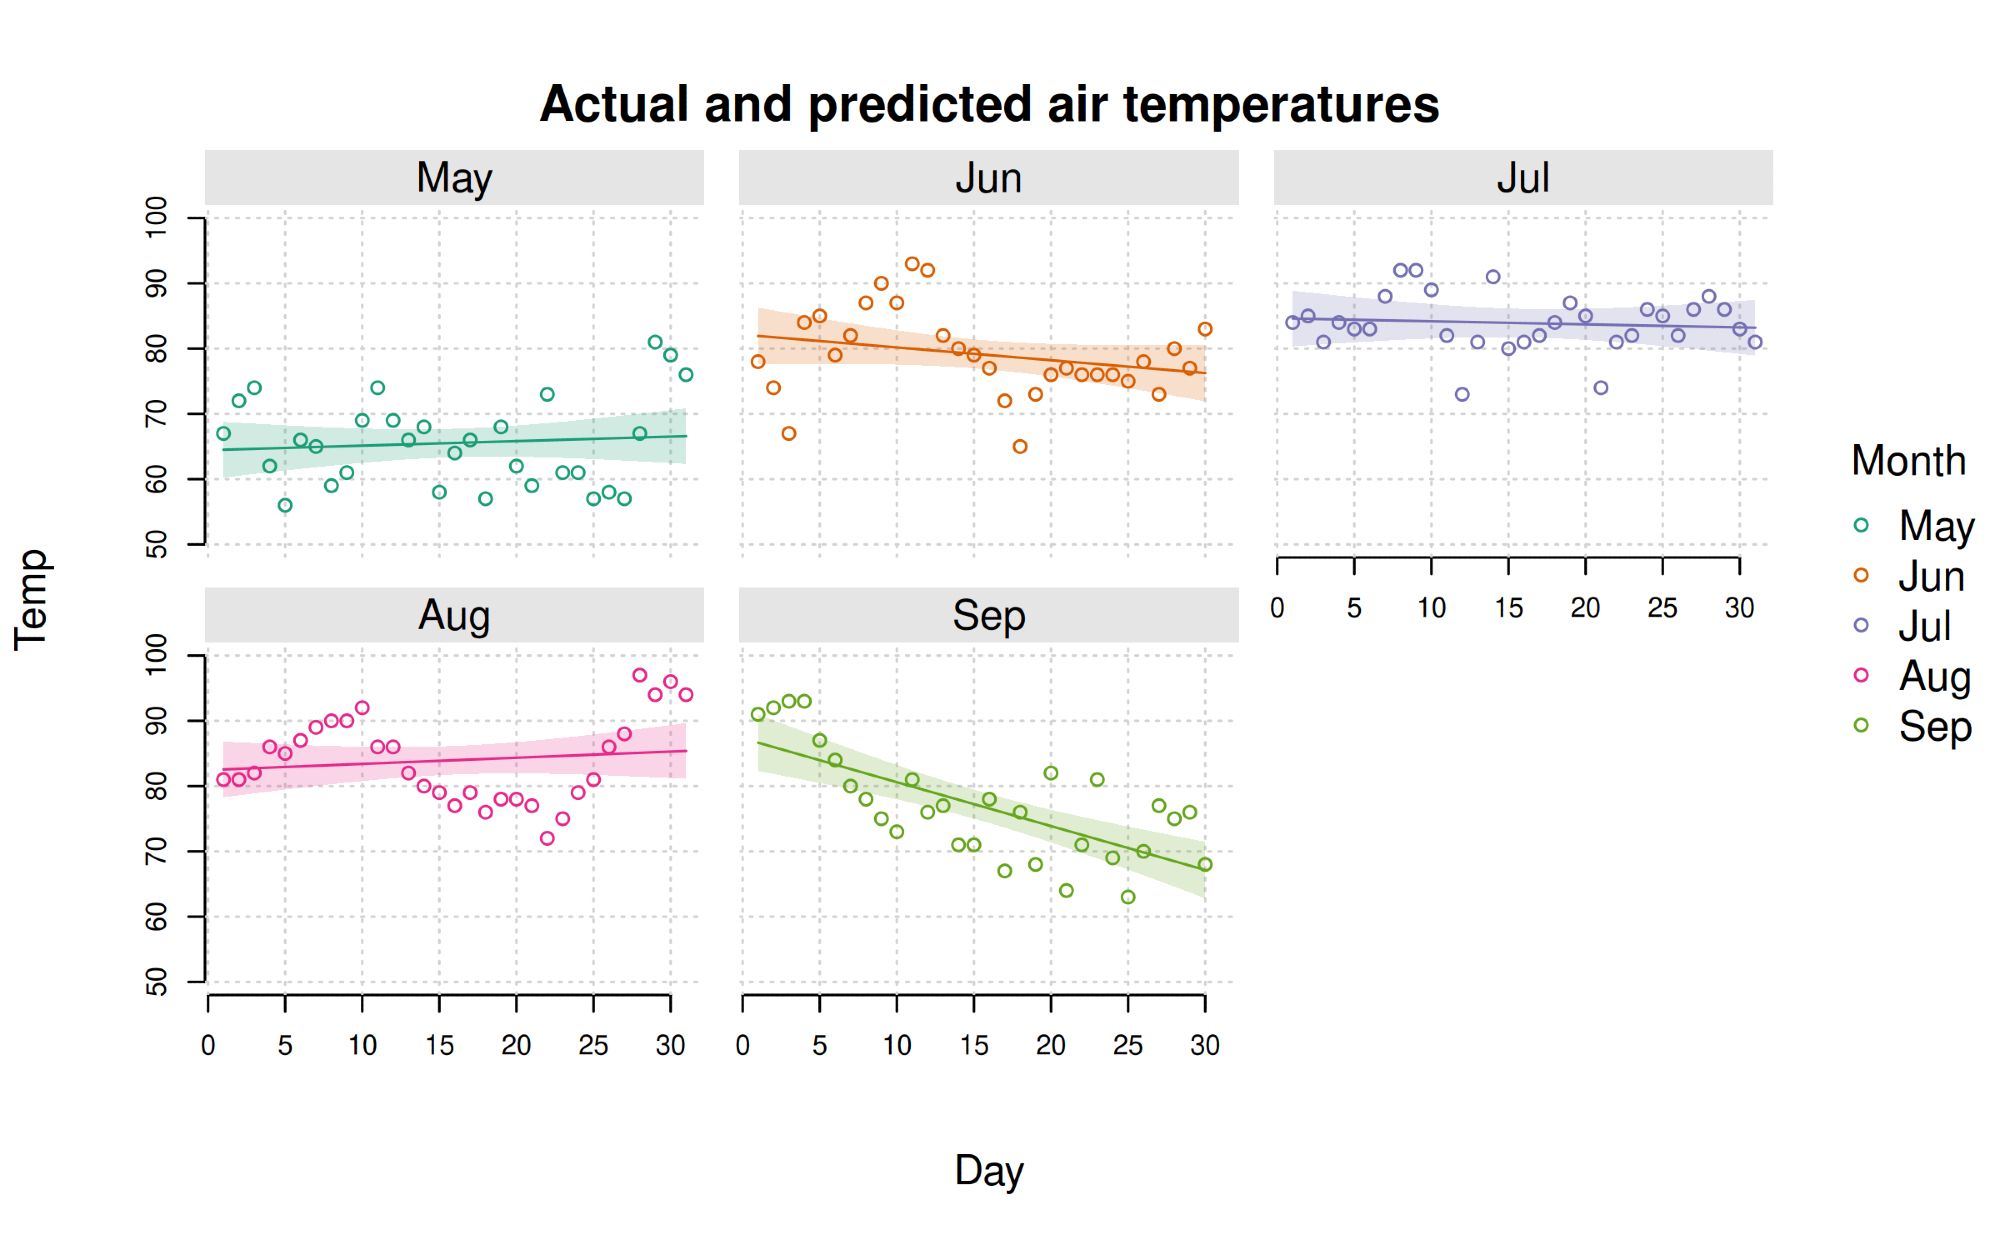
Stoked to announce a new release of `plot2`, the powerful and lightweight (0-dep) extension for #rstatsgithub.com/grantmcdermo... What's new? A bunch of things, including area plots and facets. Draw plots like the below with simple function calls.
Started reading "The Big Short" by Michael Lewis and it opens with a really cool quote from Tolstoy that I, to my shame, did not know
I've been receiving so much spam from the Journal of This or the Journal of That and the like lately that I am starting to think why don't they just combine their efforts and do the "Journal of Everything Everywhere All at Once"
My new favorite quote: "We show that, generically, a mechanism is informationally simple if and only if it satisfies a separability condition that rules out most economically meaningful mechanisms." www.journals.uchicago.edu/doi/10.1086/...