BLUE
Profile banner
AO
Annals of Botany
@annbot.bsky.social
Bluesky feed for Annals of Botany articles.
305 followers14 following694 posts
AOannbot.bsky.social

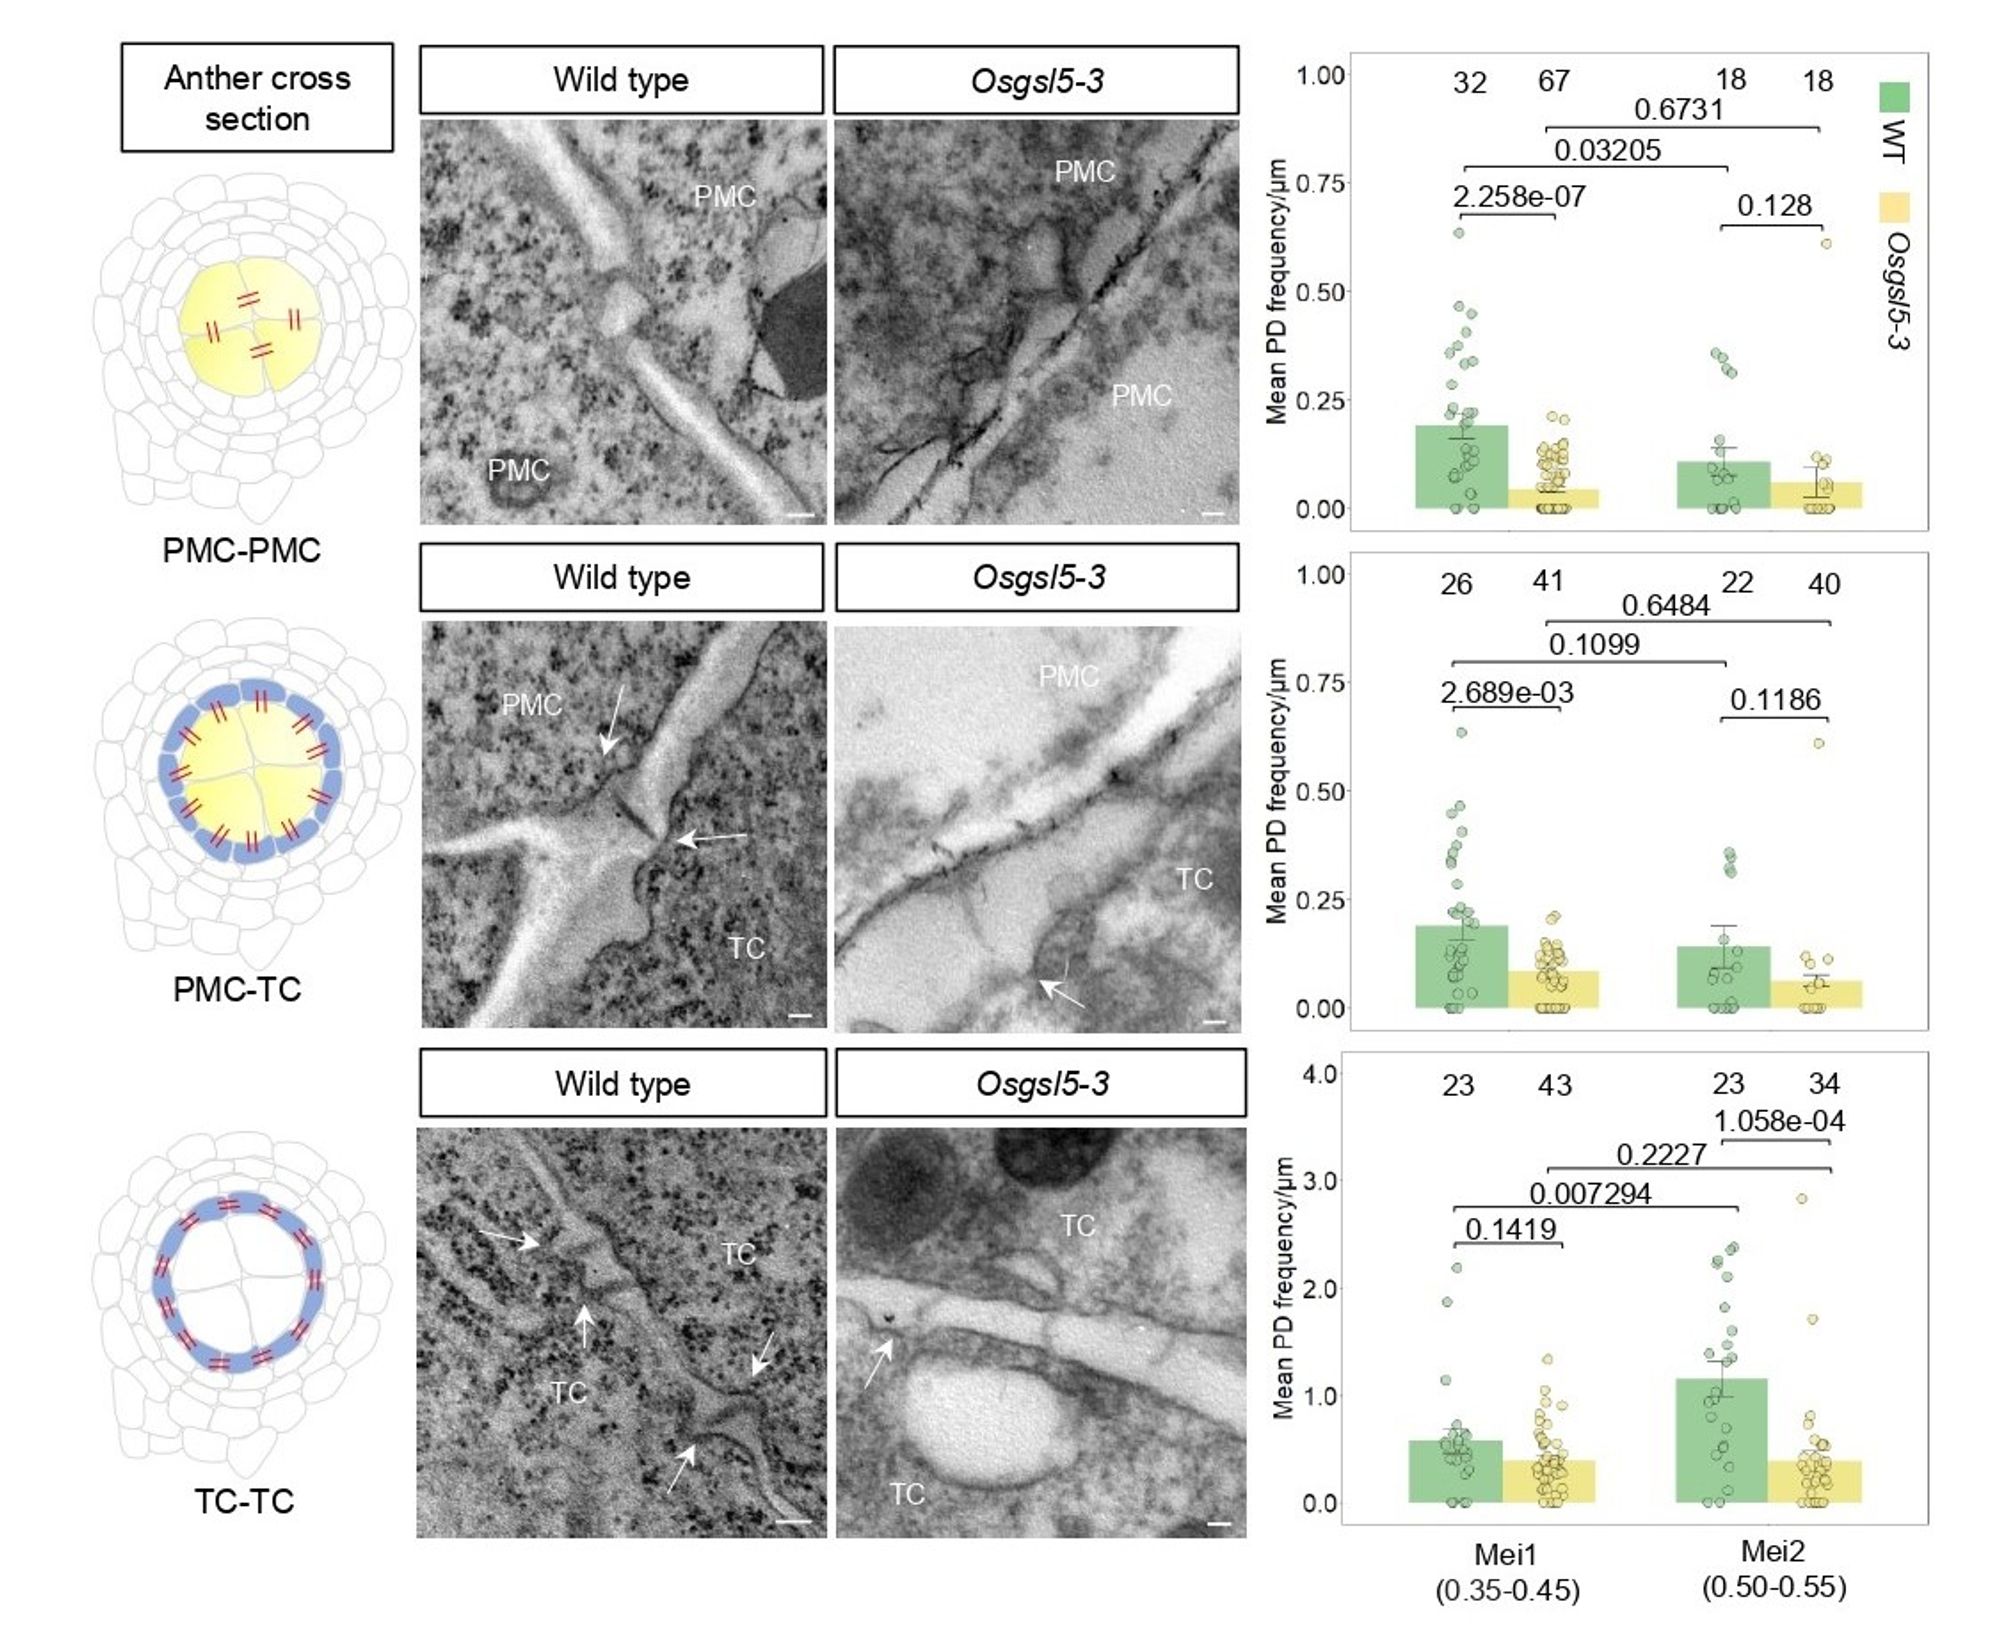
🌱Authors found that during the onset of meiosis in rice anthers, the cellulose in pollen mother cell walls decreases while a polysaccharide called callose is deposited. But why is this shift important? (4/8)

Figure with nine panels showing callose deposition in rice anthers during the transition from mitosis to meiosis. In wild-type (WT) plants and two mutant lines, Osgsl5-2 and Osgsl5-3, callose is not found in the anther chambers during the early mitotic stage (anther length ≤ 0.35 mm) (A, D, G). As the cells prepare for meiosis (anther length 0.35-0.45 mm), callose begins to form around the pollen mother cells in WT plants but is absent in the mutants (B, E, H). By early meiotic stages (anther length 0.5-0.55 mm), WT plants show callose accumulation at the center of the anther chamber, while little to no callose appears in the mutants (C, F, I). Scale bar = 20μm.
1

AOannbot.bsky.social

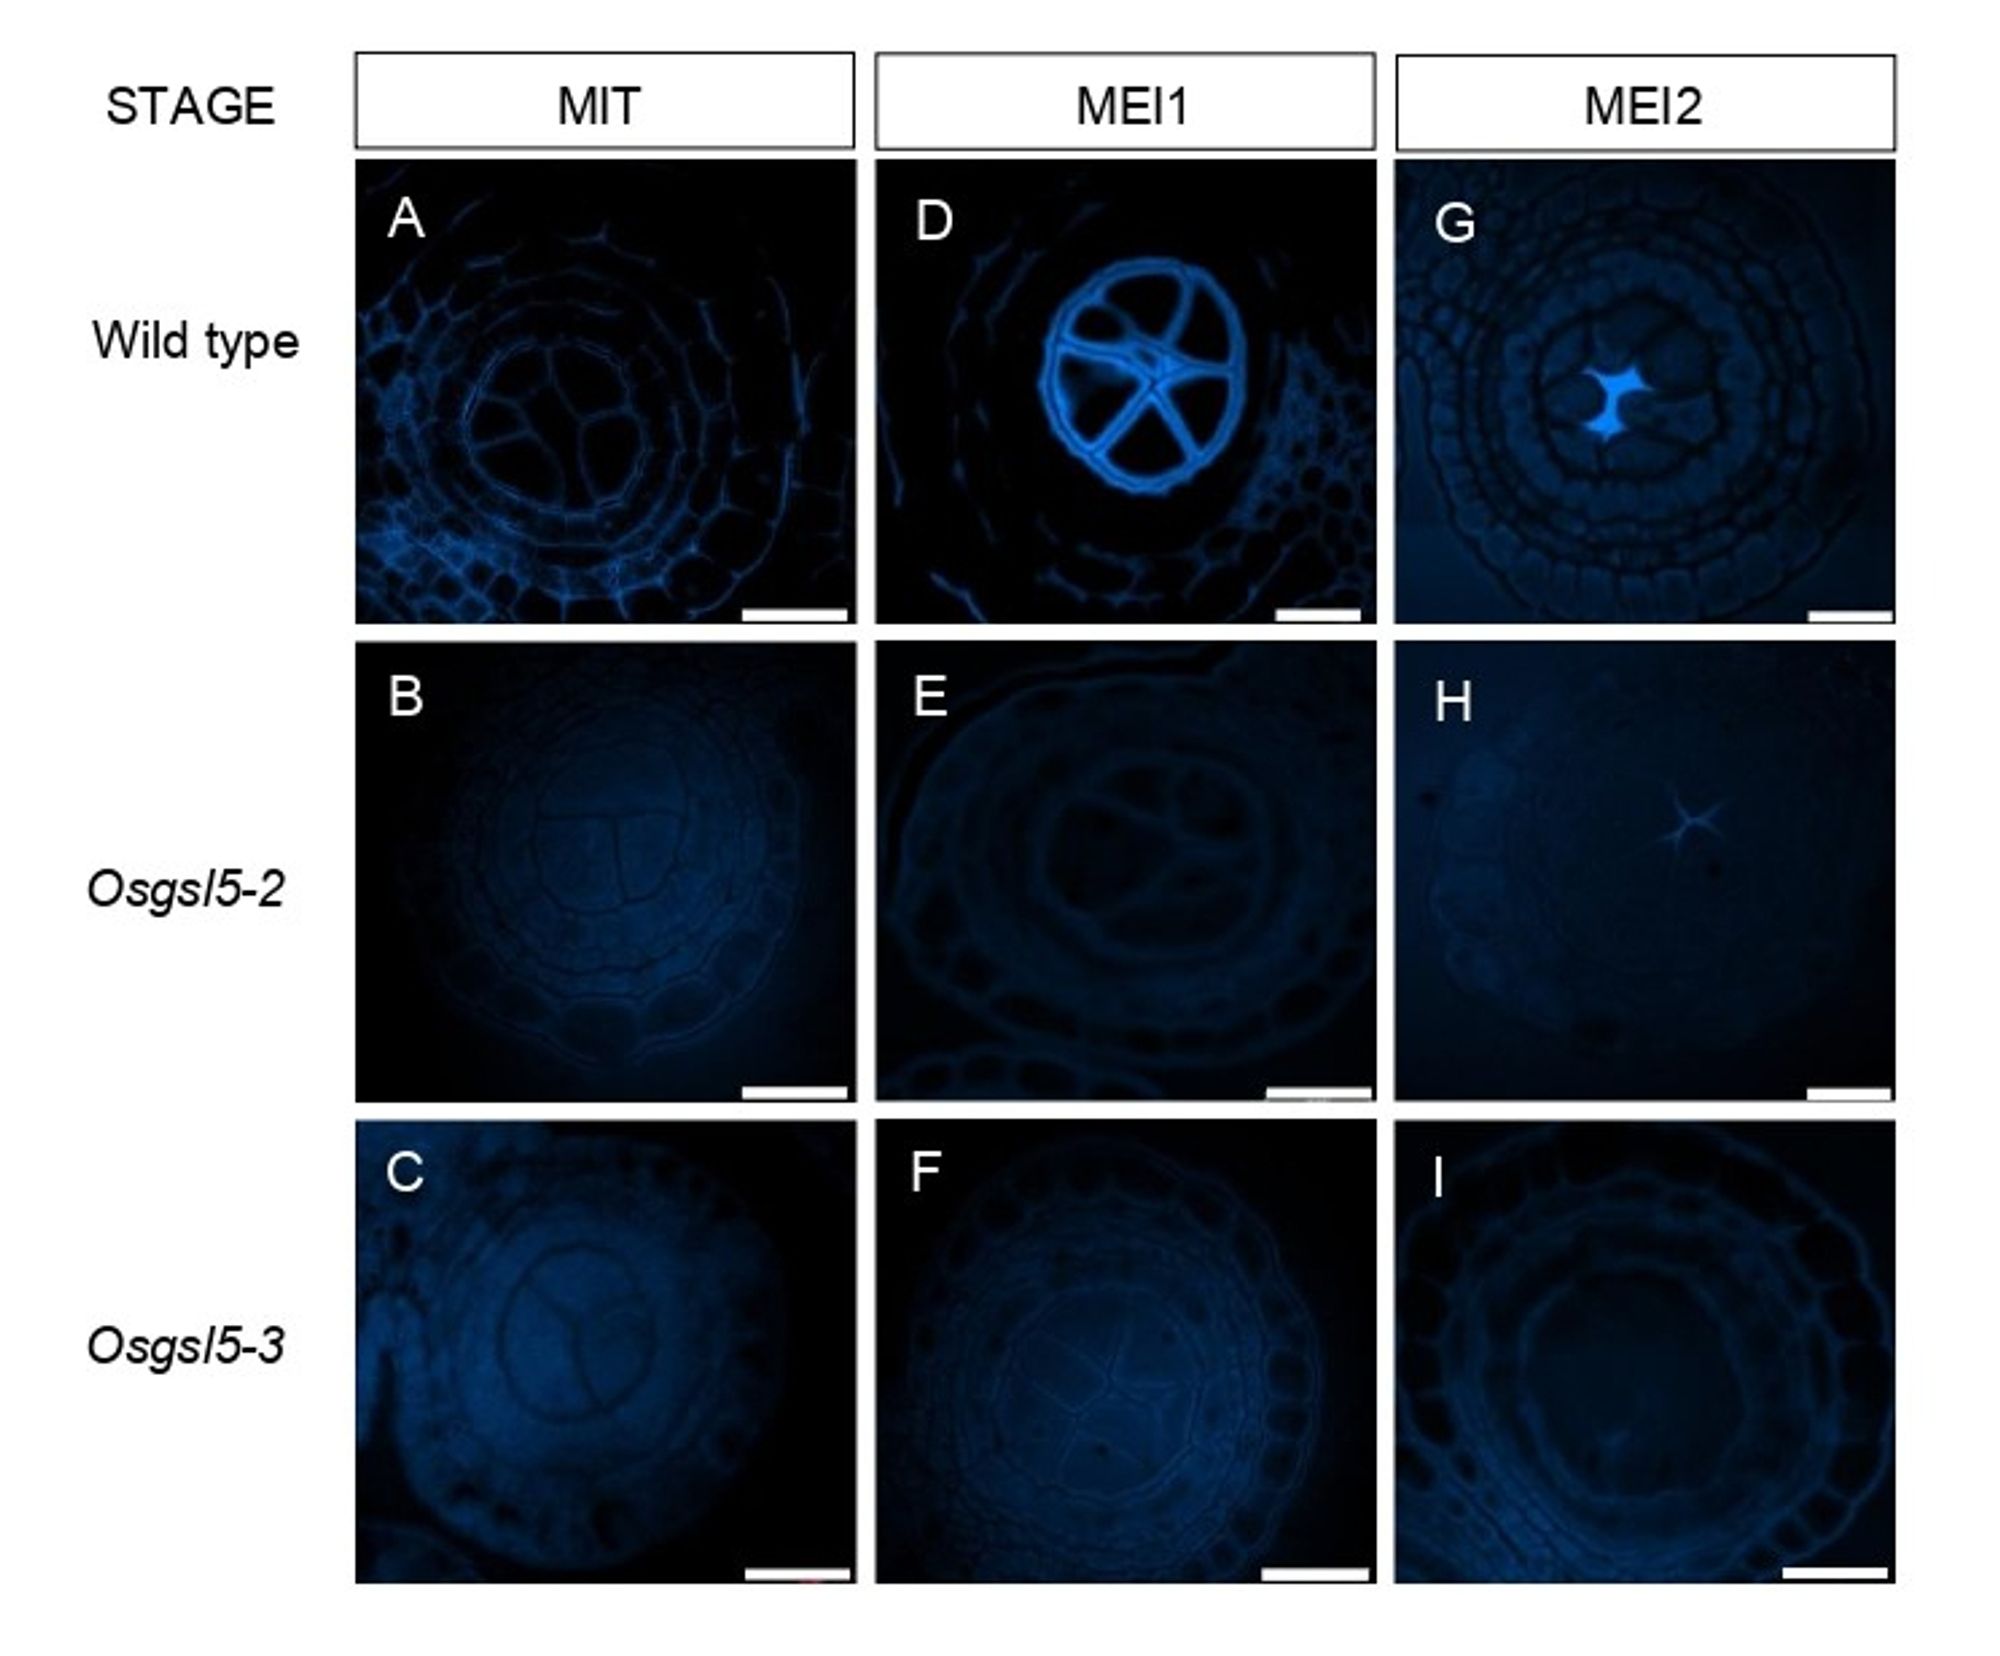
🌾 In a rice mutant lacking proper callose accumulation (Osgsl5-3), the reduction of plasmodesmata was even greater, suggesting callose is critical for maintaining cell-to-cell connectivity during this key reproductive stage. (5/8)

Figure showing plasmodesmata (PD) frequency changes during the transition to meiosis in Osgsl5-3 mutant rice anthers. The diagrams on the left show a cross-section of premeiotic anthers, highlighting the connections (PD in red) between pollen mother cells (PMC) and surrounding tapetal cells (TC). The middle images, taken using transmission electron microscopy, compare these connections in both wild-type (WT) and Osgsl5-3 mutant anthers. The right panels show how the number of PD connections per unit of cell wall changes in WT and Osgsl5-3 anthers during two stages: premeiotic interphase (Mei1) and early meiosis (Mei2). The graph bars include p-values (significance of the difference) and error bars representing the variation observed. Each dot represents the average PD frequency in an individual rice floret, and the numbers above indicate the sample sizes. Arrows point to membrane indentations at PD sites. Scale bar = 100 nm.
1
Profile banner
AO
Annals of Botany
@annbot.bsky.social
Bluesky feed for Annals of Botany articles.
305 followers14 following694 posts