
If you want ready to go options of colour palettes that work with multiple colour-vision conditions, I can recommend looking into the dataviz color palettes originally created for ggplot. Colorbrewer: colorbrewer2.org#type=sequent...cran.r-project.org/web/packages...
I mean, that would be a step too far! Unless everyone who'll use the report is fully onboard with it as a fun thought experiment? Lucky the insurance was only for cats and dogs! If there were the full range, I'm not sure I'd have done it!
I once had a Pet Insurance company as a client. The report was meant to go to Vet clinics. I designed little KPI icons as pets for them. The "negative" was a dog wearing a cone of shame and a cat with a bandage around the ear. It's honestly the cutest thing I've ever done. lol

Yes! Or any symbols! 👍👉👎 ⬆️➡️⬇️ 🙆🙅🤦 🌞🌥️🌨️ ✅❕❌ The possibilities are endless! Symbols, like arrows, can also de double encoded with colours too, so you get the best of both options!
And if you want a really good simulator, Coblis is usually my favourite, because it simulates a wide range of vision options. You'll get to see how different some of these palettes look in each of them! www.color-blindness.com/coblis-color...
Yes, some of these will work better than others! There are also multiple types of colour related vision deficiencies, like issues with contrast or brightness. This is a range of options to pick from where some will work better in certain conditions of the vision spectrum than others.
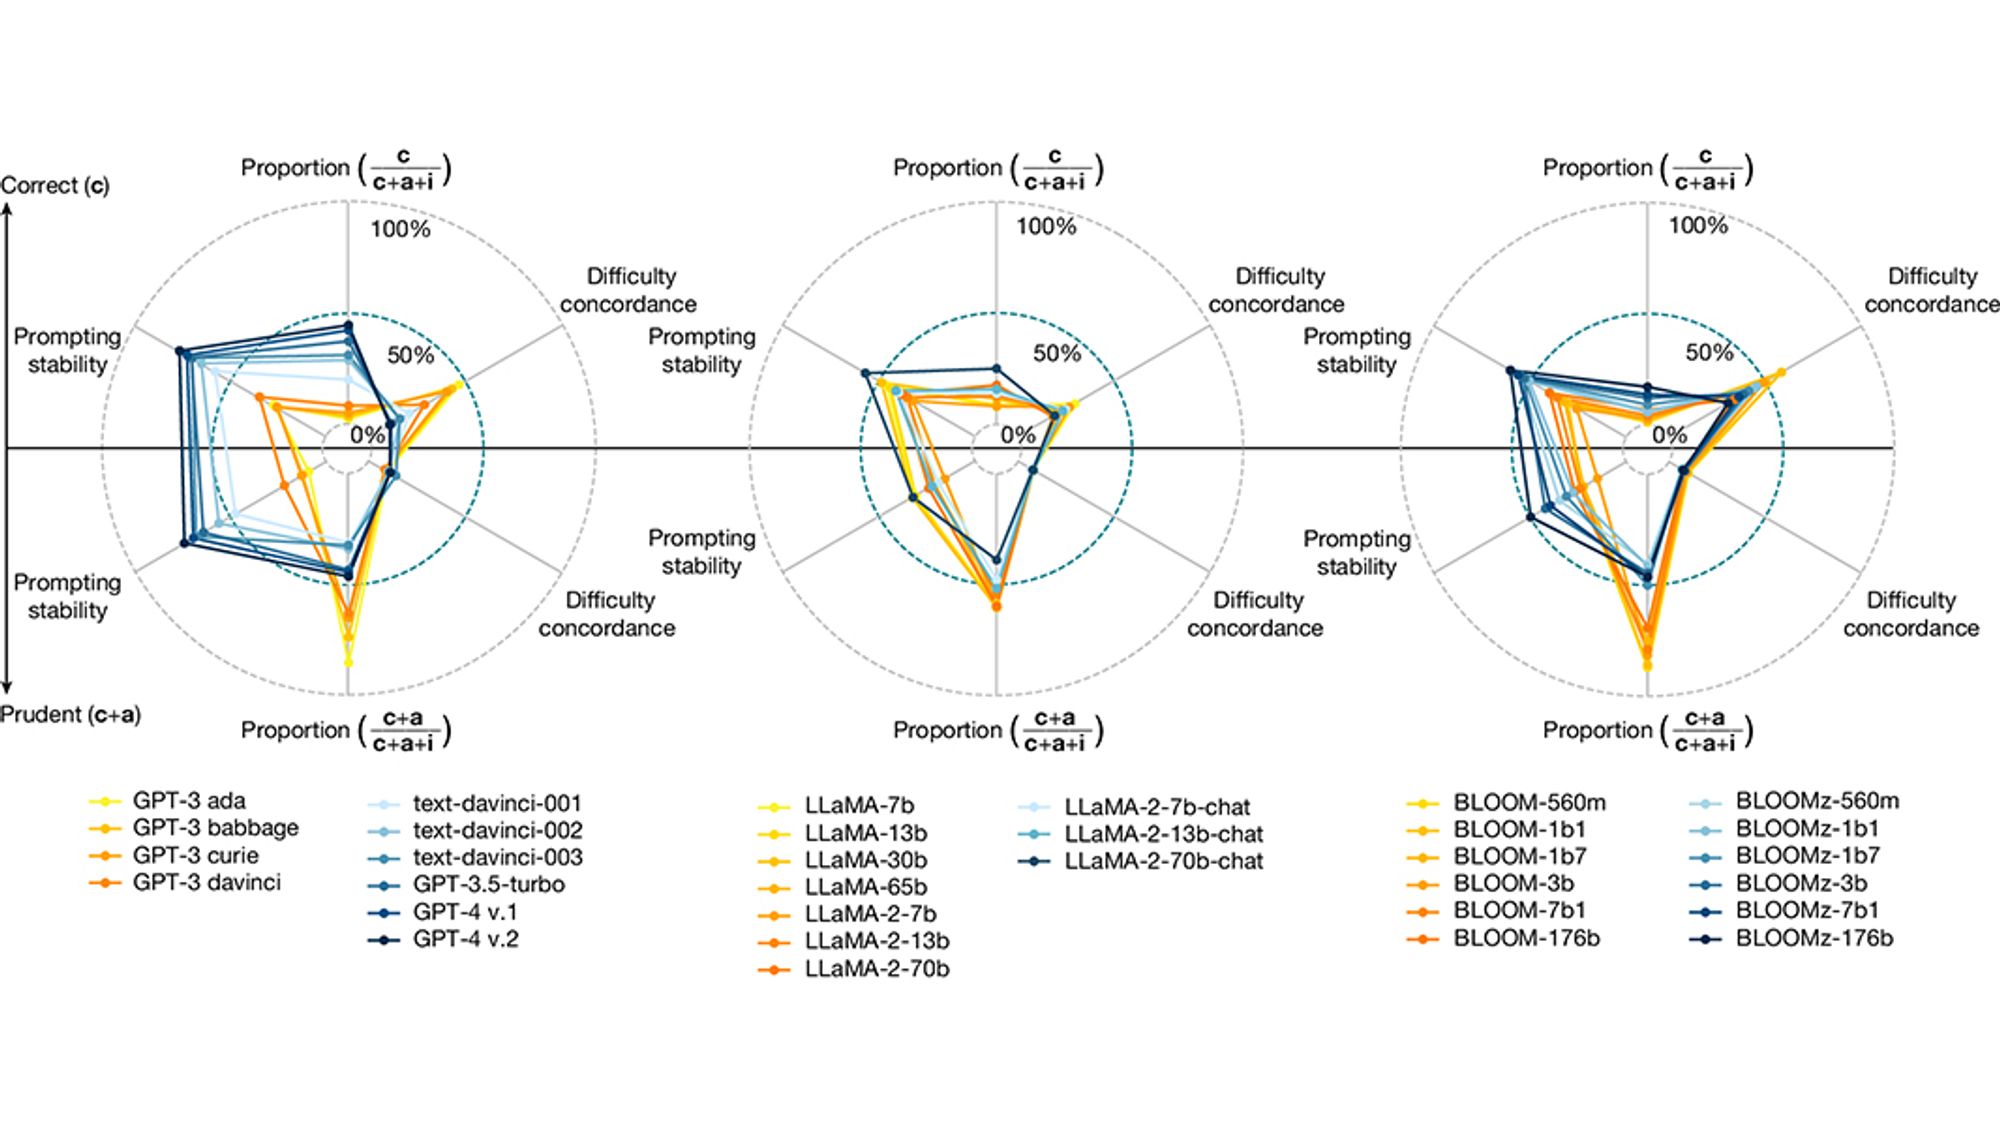
Scaling up and shaping up large language models increased their tendency to provide sensible yet incorrect answers at difficulty levels humans cannot supervise, highlighting the need for a shift in AI design towards reliability, according to a paper in Nature. go.nature.com/4eCAnis 🧪